U.S. Department of Transportation
Federal Highway Administration
1200 New Jersey Avenue, SE
Washington, DC 20590
202-366-4000
Federal Highway Administration Research and Technology
Coordinating, Developing, and Delivering Highway Transportation Innovations
 |
| This report is an archived publication and may contain dated technical, contact, and link information |
|
Publication Number: FHWA-RD-01-097 Date: January, 2002 |
The Elmwood Avenue bridge over NY Route 198, Buffalo, NY, carries two northbound and two southbound lanes of traffic. The bridge has four spans and is supported by three piers with four circular columns each. Figure 2-1 shows a general view of the Elmwood Avenue bridge. Rehabilitation of the bridge (deck, approaches, sidewalks, piers, and abutments) started in March 1992, and was completed in October 1992. The substructure repair work was performed in stages between these dates as weather permitted.
Personnel from the New York State Department of Transportation (NYSDOT) sounded the substructure components prior to the rehabilitation work and determined the location and extent of the hollow-sounding areas to be patched. Sawcuts, 19 mm deep, were cut along the borders of the identified hollow-sounding areas and the concrete was removed to a depth of 19 mm below the reinforcing steel with pneumatic hammers. The patch cavities were backfilled with concrete. The exposed reinforcing steel was severely corroded and was not cleaned before the concrete was placed. Sound chloride-contaminated concrete adjacent to the patch areas was left in place.
Two corrosion-inhibitor admixtures were used, Cortec 2000 and DCI-S. The columns and pier caps for each pier were patched. The middle pier, columns, and pier cap were patched with concrete containing Cortec 2000 corrosion inhibitor admixture at a dosage rate of 1.2 kilograms per cubic meter (kg/m3). The north pier was patched with concrete containing DCI-S corrosion-inhibitor admixture at a dosage rate of 29.9 liters per cubic meter (L/m3). The columns and pier cap of the south pier were patched with portland cement concrete and were designated as the control.
Corrosion performance evaluations of the inhibitor admixtures had been limited to the south faces of the three pier caps. A sounding survey conducted prior to rehabilitation indicated a significant difference between the south and north faces of the three pier caps. The south faces were more severely and uniformly delaminated than the north face of the pier caps. The percentages of hollow-sounding areas in the south face for the control (south pier), Cortec (middle pier), and DCI (north pier) pier caps were 51, 59, and 56, respectively. The percentages of hollow-sounding areas in the north face for the control, Cortec, and DCI pier caps were 17, 40, and 22, respectively. To assess the effectiveness of the corrosion-inhibitor treatments, corrosion performance evaluations were limited to equivalent areas on the west sections of the south face of the three pier caps. Figures 2-2 through 2-5 show sections of the south pier, middle pier, and north pier that were evaluated.
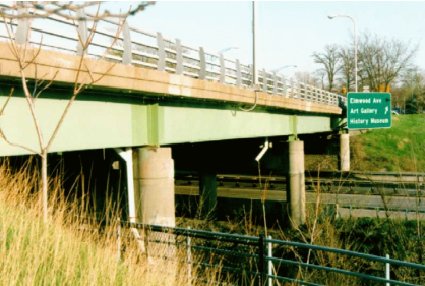
Figure 2-1. General view of the Elmwood Avenue bridge over NY Route 198, Buffalo, NY.
Field evaluations were performed on the following dates:
| First evaluation | October 17-19, 1994 | ~2 years after treatment |
| Second evaluation | May 7-9, 1997 | ~5 years after treatment |
| Third evaluation | June 17-23, 1998 | ~6 years after treatment |
The following sections describe the results of five standard surveys and the chloride ion content analysis.
Visual surveys were conducted during all three visits. In October 1994, approximately 2 years after the repair of the piers, the west section of the south face of all three pier caps appeared sound and no spalls were observed. The patched areas, particularly those with inhibitor treatments, were severely cracked. The observed cracking pattern was mud-flat cracking, typical of drying shrinkage cracks. During the second and third visits (May 1997, and June 1998, respectively), the drying shrinkage cracks appeared to be about the same. However, minor spalling was observed in the three piers.
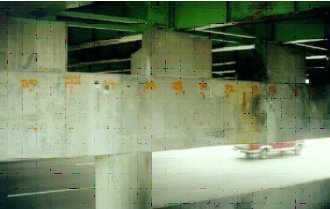
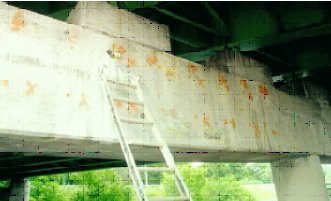
Figure 2-2. Views of test sections on: (a) south pier (control), (b) middle pier (Cortec 2000), and (c) north pier (DCI).
Delamination surveys were conducted during the first and third visits; results are presented in table 2-1. The first evaluation (October 1994) revealed hollow-sounding areas in patches of all three south face sections and in the original concrete within the south face sections of the control and Cortec-treated pier cap faces. It was not determined whether the hollow-sounding areas were the result of continued corrosion, drying shrinkage cracking, or disbondment of the patch material. It was noted in the SHRP C-103 Field Validation report (Publication No. SHRP-S-658) that difficulties were encountered in bonding the cast-in-place patch concrete to the original concrete. Researchers detected hollow-sounding areas in patch concrete within weeks after the repairs were completed. The researchers did not survey all of the patch areas and did not verify that all hollow-sounding areas were repaired.
In general, the hollow-sounding areas increased between the first and third evaluations. The increase in hollow-sounding areas with respect to the first evaluation was significant, especially on the original concrete areas of the control pier and on patched areas of the treated piers. The overall percentages of hollow-sounding areas for the control pier increased from 4.8 to 13.1; the middle pier (Cortec 2000-treated) increased from 4.3 to 5.1 percent; and the north pier (DCI-treated) increased from 6.0 to 13.6 percent.
An attempt was made to identify the cause(s) of the hollow-sounding areas. Several 7.6- centimeter cores were collected from sound and deteriorated areas located in patches or original concrete. Corrosion-induced delaminations were observed in some cores; bond failure between the patch and the original concrete was observed in others.
2.3.3. Clear Concrete Cover Survey
A clear concrete cover survey was performed during the first evaluation using a cover meter. Readings were taken in the patch concrete, at the interface, and in the original concrete. The results of the cover meter were verified at random locations with actual cover measurements at drill holes. The results are shown in table 2-2. The average clear concrete cover for the middle pier was greater than that for the south and the north piers.
2.3.4. Corrosion Potential Survey
Corrosion potential measurements were conducted as indicated by the American Society for Testing and Materials (ASTM) C-876 during all three visits. The test areas were approximately 1.4 x 12.1 m for the south pier, 1.4 x 5.5 m for the middle pier, and 1.4 x 9.2 m for the north pier. Potential measurements were taken on a 0.61-m grid on patched (P) areas, interface (I), and original (O) concrete. However, the majority of the measurements were located on patches and original concrete. According to ASTM C-876, rebars with corrosion potentials less than -350 mV (millivolts measured against a copper-copper sulfate electrode (CSE)) have a high probability of active corrosion. When the potentials are in the range of -200 mV to -350 mV, corrosion activity is uncertain. Rebars with corrosion potentials that are greater than -200 mV have a low probability of corrosion.
Summaries of corrosion potential measurements for the three visits are shown in tables 2-3 through 2-5. Corrosion potential data should be analyzed with caution from inhibitor treated areas, as the presence of inhibitor in the concrete can impact potential measurements due to the formation of junction cells.
* millivolts measured against a copper-copper sulfate electrode
* millivolts measured against a copper-copper sulfate electrode
* millivolts measured against a copper-copper sulfate electrode
In general terms, there was a slight increase in the active potentials for the control and DCI-treated piers. The potentials for the Cortec-treated pier remained in the passive to uncertain range.
Corrosion rate tests were conducted with an NBS-3LP corrosion rate device and measurements were made at 31 locations (11 in the control section and 10 each in the Cortec- and DCI-treated sections) during each of the three visits. Measurements were made on original concrete, on the patches, and at the interface. Table 2-6 shows average corrosion rate values determined in each of the test areas for all three visits.
* milliamps per square meter
1 mA/m2 = 10.753 mA/ft2
The guidelines for interpreting corrosion rate data obtained with the NBS-3LP device are shown in table 2-7.
* milliamps per square meter
1 mA/m2 = 10.753 mA/ft2
As the corrosion rate varies significantly with temperature, the variation in data as a function of time and a comparison between test sections provides more information than the actual magnitude of the corrosion rate measurements. The highest rate of increase in corrosion rate with time in patched areas was observed on the north pier (DCI-treated). Similarly, the highest rate of change in original concrete and on the interface was observed on the south (control) pier. In general, the corrosion rate data do not differentiate between the treated areas and the control.
2.3.6. Chloride Ion Content Analysis
Total chloride ion content analysis as per the standard American Association of State Highway and Transportation Officials (AASHTO) T-260(3) method was conducted during the first and third visits. Powdered samples (at 1.27-cm intervals from the top surface to beyond the depth of the embedded steel) were obtained from cores collected from original concrete, patched areas, and the interface. The chloride content analysis results from the first and third visits are given in tables 2-8 and 2-9, respectively.
The chloride content in the various test areas has increased in a span of about 4 years, from the first evaluation in October 1994 to the third evaluation in June 1998. The chloride content at the average level of the reinforcing steel (5.1 cm) was above the corrosion threshold for all piers. The average chloride content at the level of the reinforcing steel in patched areas was approximately 50 percent higher on the treated piers than on the control pier. The average chloride content at the steel depth in patched and interface areas for the treated and control piers was approximately 3 to 4 times the chloride corrosion threshold.
All patched areas, particularly those treated with the inhibitor, had suffered shrinkage cracking. The cause of shrinkage cracking was not determined in this study. Immediately after the installation of the repairs, hollow-sounding areas were detected. The formation of hollow-sounding areas was attributed to lack of bonding between the patch material and the original concrete. Generally, bond failure occurs soon after the installation of new concrete and does not continue to occur with time. The size and number of hollow-sounding areas in patches continued to increase with time. This suggests that a process other than bond failure was responsible for the increase in hollow-sounding areas. Some cores extracted from patches in the control pier and the treated piers exhibited ongoing corrosion and consequent formation of delamination.
The average corrosion rate measurements in patched areas and original areas were of a magnitude that can result in corrosion-induced damage in 2 to 10 years. The variation in average corrosion rates with time suggests that corrosion continued unabated in the patches of the control area and the treated areas. Also, the corrosion rate in the patches of the control area and the area treated with the DCI inhibitor increased with time; it varied with time for the patches treated with the Cortec inhibitor. Corrosion was ongoing in the original concrete and was increasing with time. The corrosion rates at the interface between the patches and the original concrete in treated areas were similar to or higher than that for the control area.
Sufficient levels of chloride ions were present everywhere to ensure continuation of corrosion. The cracking of the patches probably aided the ingress of chloride ions (CI) into the patches and reached such high levels of concentration within 6 years of completion of the repairs.
* ppm = parts per million

