U.S. Department of Transportation
Federal Highway Administration
1200 New Jersey Avenue, SE
Washington, DC 20590
202-366-4000
Federal Highway Administration Research and Technology
Coordinating, Developing, and Delivering Highway Transportation Innovations
 |
| This report is an archived publication and may contain dated technical, contact, and link information |
|
Publication Number: FHWA-RD-01-143 Date: October 2003 |
Three procedures were used to collect the distress data currently stored in the LTPP database, one manual procedure and two photographic procedures, PADIAS 1.x and PADIAS 4.2 (PADIAS stands for PAvement DIstress Analysis System). Each procedure was used to collect distress data on LTPP test sections of the following pavements types: hot-mix asphalt (HMA), jointed concrete (JC) (plain and reinforced), and continuously reinforced concrete (CRC).
The PADIAS 1.x and 4.2 procedures are semiautomated methodologies that use the PASCO photographic distress survey technology. Thirty-five millimeter film images of the pavement surface are collected at night. Lamps mounted on the survey vehicle provide a uniform lighting of the pavement surface. A semi-automated process is used to interpret the film to derive distress data.(1) The distress definitions and severity levels used are those provided in the 1993 Distress Identification Manual (DIM).(2) This method involves less risk than the manual survey method because the survey vehicle operates at highway speeds, and requires no traffic control or lane closure.
After the first two rounds of distress data were collected and reviewed, discrepancies were observed between the manual and photographic results. Note that a "round" of data collection implies that data have been collected on as many test sections as possible within a time frame of about one year. The sections were chosen based on a prioritized list. The first round of PADIAS data collection occurred in 1989-1990 and included a survey of all test sections that were part of the LTPP program at that time. After the first two rounds, changes were made to the data interpretation procedures to try to minimize discrepancies. The two interpretation procedures are referred to as PADIAS version 1.x and PADIAS 4.2.
A preliminary review of the distress data was conducted to identify the most commonly occurring distresses. The subsequent detailed review then focused on those specific distresses. Tables 1 to 3 list the various distresses defined in the DIM and the frequency of occurrence. The most commonly occurring distresses are identified in table 4, along with other distresses such as block cracking and patching, which often tend to exacerbate the most commonly occurring distresses. The distresses shown in table 4 were the focus of this study.
Table 1. Summary of distress on surveys of HMA-surfaced sections.
| Distress Type | Total Surveys |
Survey Methodologies | |||||||||
|---|---|---|---|---|---|---|---|---|---|---|---|
| Manual | PADIAS4.2 | PADIAS 1.x | |||||||||
| No. | %* | No. | %* | %** | No. | %* | %** | No. | %* | %** | |
| Fatigue | 1,445 | 27 | 1,062 | 32 | 73 | 205 | 29 | 14 | 178 | 13 | 12 |
| Block | 215 | 4 | 163 | 5 | 76 | 40 | 6 | 19 | 12 | 1 | 6 |
| Edge | 198 | 4 | 166 | 5 | 84 | 16 | 2 | 8 | 16 | 1 | 8 |
| Longitudinal, WP | 1,717 | 32 | 1,370 | 41 | 80 | 347 | 50 | 20 | 0 | 0 | 0 |
| Longitudinal, NWP | 2,858 | 53 | 1,525 | 46 | 53 | 479 | 69 | 17 | 854 | 63 | 30 |
| Transverse Reflective, No. | 180 | 3 | 66 | 2 | 37 | 78 | 11 | 43 | 36 | 3 | 20 |
| Longitudinal Reflective | 174 | 3 | 52 | 2 | 30 | 91 | 13 | 52 | 31 | 2 | 18 |
| Transverse, No. | 3,292 | 61 | 1,893 | 57 | 58 | 513 | 73 | 16 | 886 | 65 | 27 |
| Patch/Patch Deterioration, No. | 469 | 9 | 328 | 10 | 70 | 61 | 9 | 13 | 80 | 6 | 17 |
| Potholes, No. | 123 | 2 | 100 | 3 | 81 | 13 | 2 | 11 | 10 | 1 | 8 |
| Shoving, No. | 14 | 0 | 14 | 0 | 100 | 0 | 0 | 0 | 0 | 0 | 0 |
| Bleeding | 605 | 11 | 521 | 16 | 86 | 84 | 12 | 14 | 0 | 0 | 0 |
| Polished Aggregate | 17 | 0 | 17 | 1 | 100 | 0 | 0 | 0 | 0 | 0 | 0 |
| Raveling | 537 | 10 | 474 | 14 | 88 | 63 | 9 | 12 | 0 | 0 | 0 |
| Pumping, No. | 99 | 2 | 85 | 3 | 86 | 11 | 2 | 11 | 3 | 0 | 3 |
| No Distress | 1,110 | 21 | 727 | 22 | 65 | 65 | 9 | 6 | 318 | 23 | 29 |
| Total | 5,367 | 100 | 3,314 | 100 | 62 | 698 | 100 | 13 | 1,355 | 100 | 25 |
Table 2. Summary of distess on surveys of JC-surfaced sections.
| Distress Type | Total Surveys |
Survey Methodologies | |||||||||
|---|---|---|---|---|---|---|---|---|---|---|---|
| Manual | PADIAS4.2 | PADIAS 1.x | |||||||||
| No. | %* | No. | %* | %** | No. | %* | %** | No. | %* | %** | |
| Corner Breaks | 157 | 9 | 114 | 13 | 73 | 8 | 2 | 5 | 35 | 9 | 22 |
| Durability Cracking, No. | 29 | 2 | 23 | 3 | 79 | 4 | 1 | 14 | 2 | 1 | 7 |
| Longitudinal | 345 | 21 | 209 | 23 | 61 | 98 | 28 | 28 | 38 | 10 | 11 |
| Transverse, No. | 596 | 36 | 275 | 30 | 46 | 178 | 51 | 30 | 143 | 37 | 24 |
| Transverse, Joint Sealant, No. | 1,119 | 68 | 767 | 84 | 69 | 352 | 100 | 31 | 0 | 0 | 0 |
| Longitudinal Joint Sealant, No. | 888 | 54 | 595 | 65 | 67 | 293 | 83 | 33 | 0 | 0 | 0 |
| Longitudinal Spalling | 544 | 33 | 226 | 25 | 42 | 177 | 50 | 33 | 141 | 36 | 26 |
| Transverse Spalling, No. | 810 | 49 | 396 | 43 | 49 | 149 | 42 | 18 | 265 | 68 | 33 |
| Scaling, No. | 39 | 2 | 26 | 3 | 67 | 13 | 4 | 33 | 0 | 0 | 0 |
| Polished Aggregate | 81 | 5 | 79 | 9 | 98 | 2 | 1 | 2 | 0 | 0 | 0 |
| Popouts, No./Unit Area | 204 | 12 | 48 | 5 | 24 | 26 | 7 | 13 | 130 | 33 | 64 |
| Blowups | 3 | 0 | 3 | 0 | 100 | 0 | 0 | 0 | 0 | 0 | 0 |
| Flexible Patch, No. | 202 | 12 | 117 | 13 | 58 | 35 | 10 | 17 | 50 | 13 | 25 |
| Rigid Patch, No. | 166 | 10 | 126 | 14 | 76 | 24 | 7 | 14 | 16 | 4 | 10 |
| Pumping, No. | 64 | 4 | 54 | 6 | 84 | 9 | 3 | 14 | 1 | 0 | 2 |
| Map Cracking, No. | 122 | 7 | 117 | 13 | 96 | 5 | 1 | 4 | 0 | 0 | 0 |
| No Distress | 91 | 6 | 55 | 6 | 60 | 0 | 0 | 0 | 36 | 9 | 40 |
| Total | 1,653 | 100 | 911 | 100 | 55 | 352 | 100 | 21 | 390 | 100 | 24 |
Table 3. Summary of distress on surveys of CRC-surfaced sections.
| Distress Type | Total Surveys |
Survey Methodologies | |||||||||
|---|---|---|---|---|---|---|---|---|---|---|---|
| Manual | PADIAS4.2 | PADIAS 1.x | |||||||||
| No. | %* | No. | %* | %** | No. | %* | %** | No. | %* | %** | |
| Durability Cracking, No. | 3 | 1 | 1 | 1 | 33 | 2 | 2 | 67 | 0 | 0 | 0 |
| Longitudinal Cracking | 120 | 29 | 38 | 21 | 32 | 66 | 69 | 55 | 16 | 12 | 13 |
| Transverse, No. | 401 | 98 | 177 | 99 | 44 | 96 | 100 | 24 | 128 | 96 | 32 |
| Map Cracking, No. | 13 | 3 | 12 | 7 | 92 | 1 | 1 | 8 | 0 | 0 | 0 |
| Scaling, No. | 1 | 0 | 0 | 0 | 0 | 1 | 1 | 100 | 0 | 0 | 0 |
| Polished Aggregate | 15 | 4 | 13 | 7 | 87 | 2 | 2 | 13 | 0 | 0 | 0 |
| Popouts, No./Unit Area | 44 | 11 | 6 | 3 | 14 | 6 | 6 | 14 | 32 | 24 | 73 |
| Blowups, No. | 0 | 0 | 0 | 0 | – | 0 | 0 | – | 0 | 0 | – |
| Construction Joint, No. | 41 | 10 | 21 | 12 | 51 | 13 | 14 | 32 | 7 | 5 | 17 |
| Flexible Patch, No. | 34 | 8 | 13 | 7 | 38 | 13 | 14 | 38 | 8 | 6 | 24 |
| Rigid Patch, No. | 19 | 5 | 12 | 7 | 63 | 2 | 2 | 11 | 5 | 4 | 26 |
| Punchouts, No. | 74 | 18 | 17 | 9 | 23 | 55 | 57 | 74 | 2 | 1 | 3 |
| Longitudinal Spalling | 102 | 25 | 18 | 10 | 18 | 37 | 39 | 36 | 47 | 35 | 46 |
| Pumping, No. | 11 | 3 | 9 | 5 | 82 | 2 | 2 | 18 | 0 | 0 | 0 |
| Longitudinal Joint Sealing, No. | 127 | 31 | 80 | 45 | 63 | 47 | 49 | 37 | 0 | 0 | 0 |
| No Distress | 7 | 2 | 2 | 1 | 29 | 0 | 0 | 0 | 5 | 4 | 71 |
| Total | 409 | 100 | 179 | 100 | 44 | 96 | 100 | 23 | 134 | 100 | 33 |
*The percentages in this column represent the percentage of total number of surveys of that methodology on which the distress was observed.
**The percentages in these columns represent the pecentage of the total number of surveys of the observed distress that were of that methodology.
| HMA | JC | CRC |
|---|---|---|
| Fatigue Cracking | Corner Breaks | Longitudinal Cracking |
| Transverse Cracking | Transverse Cracking | Patch/Patch Deterioration |
| Patch/Patch Deterioration | Patch/Patch Deterioration | Punchouts |
| Block Cracking |
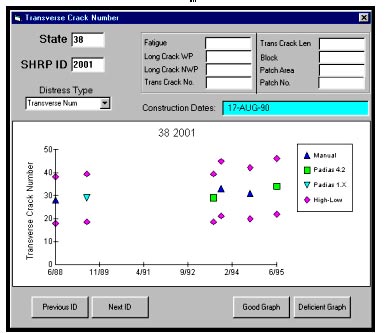
Following identification of six key distresses for the HMA and five key distresses for both the JC and the CRC-surfaced pavements from over 2,000 test sections, more than 10,000 data sets had to be examined. To facilitate this review, a graphical interface program was developed to allow the reviewer to examine data by the State, section, and distress type of interest. Figure 1 illustrates the user interface software that was developed under this study, and chapter 5 discusses automation of the review process. The "State" and "SHRP ID" boxes allow the user to quickly select a particular State or section. The "Distress Type" drop-down menu allows the user to select the type of distress for review.
The interface software produces a graph of the selected distress versus time for each section. For each data point, a set of error bands is shown to signify the accepted variability. The coefficients of variation (COV) shown in table 5 were used to calculate these error bands in accordance with equation 1.(3)
| Upper and Lower Limit = x ± 3(COV)x | (1) |
| Where: COV = coefficient of variation |
| x = distress value of interest |
The upper and lower limits of each distress effectively represent three standard deviations. Ninety-nine percent of the data from any given data set should fall within three standard deviations of the mean of that data set. In other words, there is a 1 percent probability that a data point within a particular data set will occur more than three standard deviations away from the mean, as illustrated in figure 2.
Experienced distress raters who had been accredited by the Federal Highway Administration (FHWA) performed the initial reviews. After the initial review was completed, the results were verified by cross-checking of the work of each reviewer. This cross-checking of the distress surveys was subsequently automated. This automation is discussed in chapter 4.
Table 5. Coefficient of variation used in consolidated distress study.
HMA
| Distress | COV (%) | Source |
|---|---|---|
| Fatigue Cracking | 32.67 | Law/PCS(3) |
| Longitudinal Cracking, WP | 31.17 | Law/PCS(3) |
| Longitudinal Cracking, NWP | 20.45 | Law/PCS(3) |
| Transverse Cracking, No. | 11.97 | Law/PCS(3) |
| Transverse Cracking, Length | 8.95 | Law/PCS(3) |
| Patch/Patch Deterioration, No. | 15 | Default |
| Patch/Patch Deterioration, Area | 15 | Default |
| Block Cracking | 15 | Default |
JC
| Distress | COV (%) | Source |
|---|---|---|
| Corner Breaks | 13.14 | Law/PCS(3) |
| Longitudinal Cracking | 17.28 | Law/PCS(3) |
| Transverse Cracking, No. | 14.19 | Law/PCS(3) |
| Transverse Cracking, Length | 7.32 | Law/PCS(3) |
| Patch/Patch Deterioration, No. | 15 | Default |
| Patch/Patch Deterioration, Area | 15 | Default |
CRC
| Distress | COV (%) | Source |
|---|---|---|
| Longitudinal Cracking | 17.28 | Law/PCS(3) |
| Transverse Cracking, No. | 14.19 | Law/PCS(3) |
| Transverse Cracking, Length | 7.32 | Law/PCS(3) |
| Patch/Patch Deterioration, No. | 15 | Default |
| Patch/Patch Deterioration, Area | 15 | Default |
| Punchouts | 15 | Default |
A recommendation was made by a previous study to combine all severity levels to reduce variability in the distress data (3) That recommendation was followed for the purposes of this consolidation effort; quantities of low, medium, and high severity were totaled prior to reviewing time-series data.
During review of the surveys, if distress increased in a generally linear fashion with time, the data were deemed acceptable for inclusion in the consolidated distress table. If not, the data were considered discrepant and were examined further. Discrepancies in the data were first attributed to one of the following: DIM interpretation, summarization, seasonal variability, or data collection methodology.
The distress data were classified as discrepant due to DIM interpretation if the extent or severity of the distress was illogical from one survey to the next (e.g., the initial survey reflected severe fatigue cracking but subsequent surveys showed zero fatigue cracking). If the extent or severity of the distress varied with season, the survey was classified as discrepant due to seasonal variability (e.g., more fatigue cracking was observed during winter months than summer months). If distress recorded from manual surveys differed from that recorded with automated surveys, the data were classified as discrepant based on data collection methodology. Finally, if none of these errors were readily apparent, the discrepancy was classified as summarization. These four classifications are discussed in more detail in chapter 3.
The DIM has undergone several revisions over the years of data collection. For instance, initially, all longitudinal cracking was recorded as a single distress. However, because longitudinal cracking occurring within the wheel paths is usually related to loading of the pavement and longitudinal cracking occurring between the wheel paths is usually related to climatic conditions, the decision was made to split these into two different data elements. At that time, the manual distress surveys were reviewed and edited to reflect this change in definition.
The method for performing distress surveys (both manual and PADIAS) involves mapping the distress first. Then the map is used to determine the total quantities of each type of distress. Because determining the total quantity is performed manually under both survey methods, the occasional math error is expected. Math errors should not occur on PADIAS surveys since they are summarized automatically. Determining when a math error has been made strictly from the trend of the distress over time, without referring to the distress maps, is nearly impossible. It is much easier to determine when the discrepancy noted was not a math, or summarization, error, and classify all remaining discrepancies as summarization.
Refinement within these four categories may be possible; however, the discrepancies initially were classified based only on the graphical analysis. As shown in figure 3, these classifications would appear as DIM, summary, season, or method in the boxes next to the distress in the upper portion of the interface. For this section, the initial reviewer classified the distress data as follows: fatigue as "good," the discrepancy in the longitudinal wheel path (WP) cracking as a summarization error, and the discrepancy in the longitudinal non-wheel path (NWP) cracking as due to data collection methodology.
As the reviewer classified the graph, a record would be logged if it was discrepant. Again, discrepant data were classified and stored into one of the following: DIM interpretation, summarization, seasonal variability, and methodology. As illustrated in figure 4, each record includes the data collection methodology, the State, SHRP ID, construction event number, survey date, amount of distress, and type of distress. All of the data for the discrepant distress on a particular section are stored in the appropriate file.
Those sections with only one or two surveys were written directly into a database to distinguish them from the sections for which there were sufficient data to assess variability in observations. The review software does not graph the sections for which only a single distress survey is available; instead, the data are written directly to a file named "1POINT.TXT." The software provides graphs of sections for which two observations are available. The reviewer classifies these graphs and the data are stored in the file named "2POINT.TXT." Although the reviewer cannot specify which point is discrepant, the trend is specified as discrepant. Both of these files contain the same information as the files previously described.
Figure 3. Illustration of section that has been through the review.
Figure 4. Example of output file from graphical review software.
| Method | State | SHRP | CN | Survey | Value | Distress |
|---|---|---|---|---|---|---|
| ac_rev | 01 | 0102 | 1 | 94-08-25 | 0 | Fatigue |
| ac_rev | 01 | 0102 | 1 | 95-02-08 | 1.8 | Fatigue |
| ac_rev | 01 | 0102 | 1 | 95-07-27 | 0 | Fatigue |
| pad42_ac | 01 | 0102 | 1 | 96-01-10 | 0 | Fatigue |
| ac_rev | 01 | 0102 | 1 | 96-04-17 | 2.1 | Fatigue |
| ac_rev | 01 | 0102 | 1 | 96-10-11 | 26.3 | Fatigue |
| ac_rev | 01 | 0102 | 1 | 97-10-30 | 21.1 | Fatigue |
| ac_rev | 01 | 0105 | 1 | 94-08-25 | 0 | Long_Crack_WP |
| ac_rev | 01 | 0105 | 1 | 95-02-08 | 0 | Long_Crack_WP |
| pad42_ac | 01 | 0105 | 1 | 96-01-10 | 0 | Long_Crack_WP |
| ac_rev | 01 | 0105 | 1 | 96-04-19 | 37.4 | Long_Crack_WP |
The software described in the preceding narrative was used for the review of the HMA and JC test sections. Because the number of CRC test sections is limited, the review of these data was performed using graphs created in Microsoft® Excel.
The results from the initial graphical analysis are summarized in table 6. Almost 66 percent (4,879 of 7,428) of the surveys from release 8.6 of the LTPP database could be directly transferred to the consolidated data set (i.e., there were no discrepancies with 66 percent of the surveys). The remaining 34 percent were discrepant surveys. The percentage of discrepant surveys was higher for the photographic surveys than for the manual surveys. Surprisingly, the PADIAS 4.2 data had a higher percentage of discrepant surveys than did the PADIAS 1.x data.
One potential explanation for the differences observed in the percentage of discrepant surveys is related to the number of surveys. The manual surveys were not performed on a routine basis until 1995. Hence, the ratio of the number of manual surveys to the number of PADIAS surveys is a lot smaller prior to 1995 than after 1995. All of the surveys performed using the PADIAS 1.x methodology were performed prior to 1995. These surveys may define truth for that timeframe. In other words, since this type of survey is more prevalent for that time period, it may define the trend against which the manual surveys are judged. On the other hand, since 1995, more manual surveys have been conducted than PADIAS surveys. For that timeframe, the trends are dominated by the manual surveys and the PADIAS surveys are judged against those. Therefore, the differences in percentages of discrepant surveys between the two methodologies may be due to this change in data collection policy.
The number and percentage of questionable surveys for the HMA, JC, and CRC sections are summarized in tables 7, 8, and 9, respectively, by distress type. The largest number of discrepant surveys occurred when extensive longitudinal and transverse cracking was recorded, regardless of pavement type. This is logical because these distresses are the most commonly occurring distresses.
The review of the number of cracks or patches was conducted separately from the review of the length of cracks or area of patches. Because quantifying the length of crack or area of patch is more subjective than counting the number of cracks or patches, it is not surprising that the number of questionable surveys for number and length of cracks, and for number and area of patches, are not identical. As shown in tables 7 to 9, the number of questionable surveys pertaining to crack length or patch area typically exceeds the number shown for number of cracks or patches.
Tables 10, 11, and 12 summarize the number and percentage of discrepancies per survey. Nearly 75 percent of the surveys were problem free, with actual percentages of 61, 78, and 75 for HMA, JC, and CRC-surfaced pavements, respectively. Only 3 to 4 percent of the concrete surveys included more than two discrepancies per survey, while 6 percent of the HMA-surfaced test sections had more than three discrepancies per survey. The likelihood of misclassification is greater on HMA pavements than on concrete pavements. A distress that is misclassified leads to two discrepancies—one in the assigned distress and one in the appropriate distress.
Table 6. Number of discrepant surveys by data collection methodology.
| MANUAL | |||
|---|---|---|---|
| Surface Type | Number of Surveys | Number of Surveys with No Distress* | Number of Discrepant Surveys* |
HMA |
3,318 | 727 (22) | 1,115 (34) |
| JC | 911 | 465 (51) | 195 (21) |
| CRC | 178 | 2 (01) | 53 (30) |
| PADIAS 1.x | |||
|---|---|---|---|
| Surface Type | Number of Surveys | Number of Surveys with No Distress* | Number of Discrepant Surveys* |
| HMA | 1,351 | 311 (23) | 574 (42) |
| JC | 390 | 198 (51) | 81 (21) |
| CRC | 134 | 5 (04) | 14 (10) |
| PADIAS 4.2 | |||
|---|---|---|---|
| Surface Type | Number of Surveys | Number of Surveys with No Distress* | Number of Discrepant Surveys* |
| HMA | 698 | 54 (08) | 393 (56) |
| JC | 352 | 139 (39) | 89 (25) |
| CRC | 96 | 0 (0) | 35 (36) |
| TOTAL | |||
|---|---|---|---|
| Surface Type | Number of Surveys | Number of Surveys with No Distress* | Number of Discrepant Surveys* |
| HMA | 5,367 | 1,092 (20) | 2,082 (39) |
| JC | 1,653 | 802 (49) | 365 (22) |
| CRC | 408 | 16 (04) | 102 (25) |
*Percentages shown in parentheses
Table 7. Number of discrepant surveys by distress for HMA sections.
| Distress | Number of Discrepant Surveys | Percentage of Total Surveys | Percentage of Surveys with Associated Distress |
|---|---|---|---|
| Fatigue | 513 | 10 | 36 |
| Block Cracking | 133 | 2 | 62 |
| Longitudinal Cracking, WP | 884 | 16 | 51 |
| Longitudinal Cracking, NWP | 1,012 | 19 | 35 |
| Transverse Cracking, No. | 819 | 15 | 25 |
| Transverse Cracking, Length | 848 | 16 | 25 |
| Patching, No. | 160 | 3 | 34 |
| Patching, Area | 172 | 3 | 34 |
Table 8. Number of discrepant surveys by disress for JC sections.
| Distress | Number of Discrepant Surveys | Percentage of Total Surveys | Percentage of Surveys with Associated Distress |
|---|---|---|---|
| Corner Breaks | 79 | 5 | 50 |
| Longitudinal Cracking | 113 | 7 | 33 |
| Transverse Cracking, No. | 129 | 8 | 22 |
| Transverse Cracking, Length | 162 | 10 | 22 |
| Flexible Patching, No. | 50 | 3 | 25 |
| Flexible Patching, Area | 55 | 3 | 25 |
| Rigid Patching, No. | 35 | 2 | 21 |
| Rigid Patching, Area | 43 | 3 | 21 |
Table 9. Number of discrepant surveys by distress for CRC sections.
| Distress | Number of Discrepant Surveys | Percentage of Total Surveys | Percentage of Surveys with Associated Distress |
|---|---|---|---|
| Longitudinal Cracking | 40 | 10 | 33 |
| Transverse Cracking, No. | 25 | 6 | 6 |
| Transverse Cracking, Length | 39 | 10 | 6 |
| Length | |||
| Flexible Patching, No. | 12 | 3 | 35 |
| Flexible Patching, Area | 12 | 3 | 35 |
| Rigid Patching, No. | 11 | 3 | 58 |
| Rigid Patching, Area | 11 | 3 | 58 |
| Punchouts | 37 | 9 | 50 |
Table 10. Number of discrepancies observed on each HMA survey.
| No. of Problems for Survey | No. of Surveys | Percentage of Total Surveys |
|---|---|---|
0 |
3,285 | 61.0 |
1 |
772 | 14.0 |
2 |
639 | 12.0 |
3 |
365 | 7.0 |
4 |
175 | 3.3 |
5 |
100 | 1.9 |
6 |
21 | 0.4 |
7 |
7 | 0.1 |
8 |
3 | 0.1 |
Table 11. Number of discrepancies observed on each JC survey.
| No. of Problems for Survey | No. of Surveys | Percentage of Total Surveys |
|---|---|---|
0 |
1,288 | 78.0 |
1 |
160 | 10.0 |
2 |
134 | 8.0 |
3 |
53 | 3.0 |
4 |
11 | 0.7 |
5 |
7 | 0.4 |
6 |
0 | 0.0 |
Table 12. Number of discrepancies observed on each CRC survey.
| No. of Problems for Survey | No. of Surveys | Percentage of Total Surveys |
|---|---|---|
0 |
306 | 75.0 |
1 |
44 | 11.0 |
2 |
45 | 11.0 |
3 |
2 | 0.5 |
4 |
8 | 2.0 |
5 |
3 | 0.7 |
6 |
0 | 0.0 |