U.S. Department of Transportation
Federal Highway Administration
1200 New Jersey Avenue, SE
Washington, DC 20590
202-366-4000
Federal Highway Administration Research and Technology
Coordinating, Developing, and Delivering Highway Transportation Innovations
 |
| This report is an archived publication and may contain dated technical, contact, and link information |
|
Publication Number: FHWA-RD-03-041 |
Previous | Table of Contents | Next
This chapter summarizes the results from the evaluation of the thickness data variability indicators based on core thickness measurements and field elevation measurements (SPS only). Typical LTPP layer thickness variability values are summarized by different layer and material types.
The chapter also presents the summary of the comparisons of layer thickness variances and means obtained based on the core and elevation thickness measurements for newly constructed SPS sections for different layer types, material types, and target thicknesses.
Layer thickness summary statistics such as average, minimum, maximum, standard deviation, and coefficient of variation (COV) serve as indicators of layer thickness variability along the section. For GPS sections, most of these values could be obtained from the LTPP database tables INV_LAYER and RHB_LAYER. These summary statistics were provided by the highway agencies and could be either estimated or computed. No additional information on how summary statistics were derived for these tables is available. For the SPS sections, layer thickness summary statistics could be obtained from the SPS*_LAYER tables. These values were computed from the elevation shots measurements. The SPS*_LAYER tables do not contain summary information on the number of data points used to derive the statistics. No information is available on whether all these data points were used to compute summary statistics or whether some "outlier" points were excluded.
Due to limited information on how the layer thickness summary statistic measures provided in the INV_LAYER, RHB_LAYER, and SPS*_LAYER tables were developed, it was not possible to determine whether statistical indices available in these tables were obtained using similar procedures and whether a comparable number of samples were used to derive the statistical indices. Based on this limitation, no cross-table comparison of layer thickness variability indicators available in these tables was carried out in this study
.Alternatively, layer thickness summary statistics could be computed using LTPP layer thickness data obtained from individual core measurements or from elevation measurements. The following data sources are available in the LTPP database:
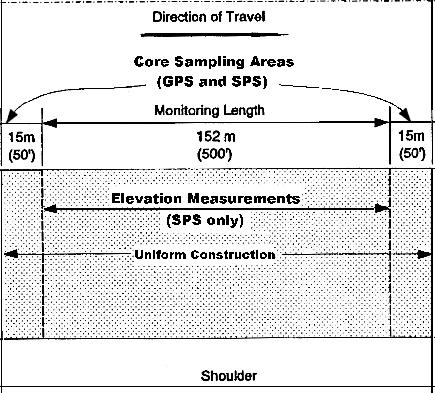
Figure 12 shows schematically where core samples and elevation layer thickness measurements were obtained along the LTPP sections. Core data were obtained for both GPS and SPS sections, while elevation measurements were obtained only for the newly constructed SPS sections.
Data Assessment and Exclusion of Erroneous Data Points
Two different data sources were used in the analysis of layer thickness variability reasonableness:
Core elevation measurements are available for both GPS and SPS sections, while elevation measurements are available only for the SPS sections. Analysis of layer thickness variability reasonableness was carried out separately for each data source, and the results of analysis obtained from different sources then were compared.
Prior to the statistical analysis, erroneous layer thicknesses measurements were identified and excluded. Several different error sources were identified in the course of this study. Details of erroneous data evaluation are included in the discussion of analyses carried out using data from each data source.
Thickness Variability Indicators
To compare the thickness information at a layer level in lieu of individual measurement level, the following summary statistics from individual measurements were computed for each pavement layer:
COV provides a good measure of whether the dispersion of layer thickness values around the established mean thickness value is large or small. The COV is computed as a ratio between standard deviation and the mean thickness value.
| ||||||||
Figure 13: Equation. Definition of coefficient of variation.
Thickness Variability Reasonableness Criteria
Criteria established under an LTPP material study [31] were adopted to evaluate the reasonableness of the thickness variability measures, as following:
The analysis is based on evaluation of the layer thickness variation reasonableness for individual LTPP sections and individual layers within the section. Under the LTPP material study [31], the core thickness data for individual layers from the LTPP tables TST_AC01_LAYER and TST_PC06 were evaluated to exclude erroneous data points and to compute summary statistics. These summary statistics were used in this study to evaluate reasonableness of the layer thickness variability indicators for individual layers.
Prior to the analysis, LTPP sections and individual layers with computed summary statistics were correlated with data elements in the TST_L05B table describing experiment, layer, and material types.
The criteria established in the referenced study [31] were used to evaluate the reasonableness of layer thickness variability indicators for each layer that had data in either the TST_AC01_LAYER or TST_PC06 table and in the TST_L05B table. The results of the layer thickness variability evaluation are presented in table 19 for different LTPP experiments, layers, and material types.
| Layer Type | Experiment | Number of Sections | Percentage of Sections with Acceptable Layer Thickness Variations | ||
|---|---|---|---|---|---|
| With Data | With COV > 20 % | With SD > 8 mm | |||
| PCC Overlay | GPS-9 | 24 | 7 | 70.8 | |
| SPS-7 | 29 | 10 | 65.5 | ||
| PCC Original Surface | GPS-3 | 126 | 22 | 82.5 | |
| GPS-4 | 61 | 12 | 80.3 | ||
| GPS-5 | 84 | 9 | 89.3 | ||
| GPS-7 | 43 | 6 | 86.0 | ||
| GPS-9 | 24 | 5 | 79.2 | ||
| SPS-2 | 139 | 40 | 71.2 | ||
| SPS-6 | 50 | 1 | 98.0 | ||
| SPS-7 | 30 | 5 | 83.3 | ||
| SPS-8 | 2 | 0 | 100.0 | ||
| SPS-9 | 18 | 1 | 94.4 | ||
| LC | SPS-2 | 35 | 7 | 80.0 | |
| AC Original Surface | GPS-1 | 229 | 9 | 94.3 | |
| GPS-2 | 139 | 9 | 93.5 | ||
| GPS-6 | 143 | 21 | 85.3 | ||
| SPS-1 | 134 | 2 | 98.5 | ||
| SPS-3 | 252 | 39 | 84.5 | ||
| SPS-5 | 133 | 14 | 89.5 | ||
| SPS-8 | 18 | 0 | 100.0 | ||
| SPS-9 | 25 | 1 | 96.0 | ||
| AC Binder | GPS-1 | 147 | 3 | 98.0 | |
| GPS-2 | 83 | 6 | 92.8 | ||
| GPS-3 | 2 | 0 | 100.0 | ||
| GPS-6 | 125 | 20 | 84.0 | ||
| GPS-7 | 41 | 8 | 80.5 | ||
| GPS_9 | 2 | 1 | 50.0 | ||
| SPS-1 | 110 | 8 | 92.7 | ||
| SPS-3 | 118 | 16 | 86.4 | ||
| SPS-5 | 150 | 22 | 85.3 | ||
| SPS-6 | 11 | 1 | 90.9 | ||
| SPS-8 | 11 | 0 | 100.0 | ||
| SPS-9 | 19 | 1 | 94.7 | ||
| AC Overlay | GPS-6 | 204 | 25 | 87.7 | |
| GPS-7 | 57 | 4 | 93.0 | ||
| SPS-1 | 6 | 1 | 83.3 | ||
| SPS-3 | 51 | 11 | 78.4 | ||
| SPS-5 | 96 | 6 | 93.8 | ||
| SPS-6 | 20 | 3 | 85.0 | ||
| SPS-8 | 7 | 0 | 100.0 | ||
| ATB | GPS-1 | 2 | 0 | 100.0 | |
| GPS-2 | 52 | 1 | 98.1 | ||
| GPS-3 | 7 | 1 | 85.7 | ||
| GPS-4 | 1 | 0 | 100.0 | ||
| GPS-5 | 20 | 1 | 95.0 | ||
| GPS-6 | 8 | 1 | 87.5 | ||
| SPS-1 | 102 | 15 | 85.3 | ||
| SPS-3 | 24 | 3 | 87.5 | ||
| SPS-5 | 13 | 0 | 100.0 | ||
| Total | 3227 | 257 | 125 | 88.2 | |
Core Thickness Data Availability and Assessment for Newly Constructed SPS Layers
For the newly constructed SPS layers with a documented target thickness, thickness measurements are available from both core examination and elevation measurements. Layer thickness summary statistics computed for the newly constructed SPS layers were compared to the elevation measurements data, as discussed later in this chapter.
To reflect the most recent LTPP data upload status for the newly constructed SPS layers with a specified target thickness, the core thickness data were evaluated again with erroneous data points excluded and summary statistics computed for each layer and each analysis cell. A summary of the available core thickness data for SPS experimental sections is presented in table 20.
| Layer Type | Experiment | Number of Records (measurements) | Number of Sections with Data |
|---|---|---|---|
| DGATB | SPS-1 | 323 | 78 |
| PATB | SPS-1 | 142 | 32 |
| SPS-2 | 0 | 0 | |
| LC | SPS-2 | 182 | 36 |
| PCC | SPS-2 | 894 | 140 |
| SPS-7 | 235 | 22 | |
| SPS-8 | 16 | 2 | |
| SB | SPS-1 | 759 | 170 |
| SPS-5 | 455 | 92 | |
| SPS-6 | 99 | 26 | |
| SPS-8 | 137 | 18 | |
| Total | 3242 | 616 |
Using the three-standard deviation criterion, one core thickness record was identified as erroneous (Section 22-0708, PCC layer) and was eliminated from the analysis at the project level. The measured core thicknesses for this layer are between 140 mm (5.5 in) and 149 mm (5.85 in), except for the excluded core measurement that was 198 mm (7.8 in).
For SPS newly constructed layers, elevation measurements were taken throughout the section of the final finished surface. The measurements normally are made at five offset points at 152-m (500-ft) spacing along the section.
This big number of elevation thickness measurements available at each layer level makes them a good candidate for thickness variability evaluation. One additional advantage of these thickness measurements is that their layer design or target thickness is known to the research team. As a result, the thickness variability values can be compared and summarized for different target values.
Elevation Data Availability
The availability of elevation data in SPS*_LAYER_THICKNESS tables by layer type and number of sections are presented in table 21.
| Layer Type | Experiment | Number of Records (measurements) | Number of Sections with Data |
|---|---|---|---|
| DGAB | SPS-1 | 5295 | 97 |
| SPS-2 | 4050 | 85 | |
| SPS-8 | 1863 | 38 | |
| DGATB | SPS-1 | 5250 | 97 |
| PATB | SPS-1 | 4496 | 83 |
| SPS-2 | 2242 | 47 | |
| LC | SPS-2 | 2242 | 47 |
| PCC | SPS-2 | 6955 | 140 |
| SPS-7 | 918 | 24 | |
| SPS-8 | 763 | 14 | |
| SB | SPS-1 | 9138 | 167 |
| SPS-5 | 4856 | 93 | |
| SPS-6 | 1933 | 40 | |
| SPS-8 | 1202 | 24 | |
| Total | 51419 | 997 |
The total number of records at Level E in the SPS*_LAYER_THICKNESS tables was 51,419 at the time of the study.
Exclusion of the Erroneous Data Points
Prior to the data analysis, 78 erroneous data points were excluded before the analysis because of data inconsistency. The following list summarizes data inconsistencies found during review of the data from the SPS*_LAYER_THICKNESS tables:
These erroneous thickness values were reported to the FHWA for further investigation.
Additionally, data points that deviated by more than three standard deviations from the mean were considered as potentially erroneous and were excluded from the analysis data set. Analysis of sections with outliers revealed that most of these sections had one outlier per section; some had two outliers, and a few three or four outliers. In all, 202 data points were excluded from further analysis. The summary of outlier analysis is presented in the table 22. A total of 51,139 records were used in the statistical analysis.
| Number of Outliers per Layer | Number of Layers | Total | |
|---|---|---|---|
| With Outliers | With Other Excluded Points | ||
| 1 | 162 | 5 | 167 |
| 2 | 15 | 3 | 18 |
| 3 | 2 | 2 | 4 |
| 4 | 1 | 1 | |
| 6 | 1 | 1 | |
| 55 | 1 | 1 | |
| Total number of layers | 180 | 12 | 192 |
| Total number of outlier records | 202 | 78 | 280 |
The number of outliers summarized by different layer types is presented in table 23.
| Layer Type | Number of Records (Measurements) | Total Number of Records (Measurements) | Percent of Records (Measurements) |
|---|---|---|---|
| DGAB | 46 | 11208 | 0.41 |
| DGATB | 18 | 5250 | 0.34 |
| PATB | 23 | 6738 | 0.34 |
| LC | 8 | 2458 | 0.33 |
| PCC | 35 | 8636 | 0.41 |
| SB | 72 | 17129 | 0.42 |
| Total | 202 | 51419 | 0.39 |
The highest percentage of the sections with outliers is for AC and PCC surface layers and unbound base, while the lowest percentage is for LC base, PATB, and DGATB.
Analysis of Layer Thickness Variation
Elevation measurements obtained after each layer construction were used to conduct analysis of layer variation reasonableness. Table 24 provides summary of the layer thickness variation reasonableness evaluation results for all SPS sections.
| Layer Type | Experiment | Number of Sections | Percentage of Sections with Acceptable Layer Thickness Variations | ||
|---|---|---|---|---|---|
| With Data | With COV > 20 % | With SD > 8 mm | |||
| DGAB | SPS-1 | 97 | 5 | 94.8 | |
| SPS-2 | 84 | 2 | 97.6 | ||
| SPS-8 | 38 | 3 | 92.1 | ||
| DGATB | SPS-1 | 97 | 0 | 100.0 | |
| PATB | SPS-1 | 83 | 1 | 98.8 | |
| SPS-2 | 46 | 0 | 100.0 | ||
| LC | SPS-2 | 48 | 26 | 45.8 | |
| PCC | SPS-2 | 139 | 61 | 56.1 | |
| SPS-7 | 24 | 14 | 41.7 | ||
| SPS-8 | 14 | 12 | 14.3 | ||
| SB | SPS-1 | 167 | 2 | 98.8 | |
| SPS-5 | 92 | 12 | 87.0 | ||
| SPS-6 | 36 | 0 | 100.0 | ||
| SPS-8 | 24 | 1 | 95.8 | ||
For all material types except for PCC and LC the percentage of acceptable data is very close to or above 90 percent. For PCC and LC material types this percentage is below 60.
To estimate typical values for layer thickness variability indicators, layer thickness data for SPS experimental sections were obtained from TST_AC01_LAYER and TST_PC06 tables (core thickness), and from SPS*_LAYER_THICKNESS tables (elevation thickness). The analyses were done separately for the thickness data obtained from core measurements and for the data from elevation measurements. Table 25 summarizes layer thickness COV and standard deviations by layer and material types obtained for PCC and AC layers from GPS and SPS sections based on the analysis of core thickness data. Table 26 summarizes layer thickness COV and standard deviations by layer and material types obtained for the newly constructed SPS sections based on analysis of elevation measurements. The COV and standard deviation values from the tables 25 and 26 could be used as approximate estimates of the expected layer thickness variability along the project for a given material and layer type.
| Experiment Type | Description | Number of Analysis Layers | Mean COV, % | Min COV, % | Max COV, % | Mean St. dev., mm | Min St. dev., mm | Max St. dev., mm |
|---|---|---|---|---|---|---|---|---|
| GPS | AC Binder | 396 | 10.10 | 0.78 | 83.19 | 7.46 | 0.87 | 110.28 |
| DGATB | 88 | 6.83 | 1.02 | 46.92 | 8.34 | 1.30 | 61.38 | |
| AC Surface | 506 | 9.76 | 0.70 | 93.24 | 5.44 | 0.52 | 107.46 | |
| AC Overlay | 259 | 10.68 | 1.48 | 59.92 | 5.44 | 0.87 | 44.90 | |
| SPS | AC Binder | 382 | 10.41 | 0.62 | 71.38 | 7.89 | 1.27 | 95.19 |
| ATB | 139 | 12.66 | 0.85 | 184.88 | 14.79 | 1.47 | 135.97 | |
| AC Surface | 488 | 10.21 | 0.69 | 64.28 | 5.34 | 1.14 | 45.58 | |
| AC Overlay | 160 | 10.70 | 0.72 | 70.71 | 4.90 | 1.14 | 25.85 | |
| GPS | PCC | 336 | 2.36 | 0.40 | 10.92 | 5.44 | 1.04 | 31.14 |
| PCC Overlay | 24 | 2.92 | 0.55 | 13.10 | 6.22 | 1.04 | 20.74 | |
| SPS | LC | 34 | 4.62 | 1.12 | 23.38 | 7.37 | 1.80 | 38.80 |
| PCC | 233 | 2.66 | 0.51 | 27.97 | 6.31 | 1.14 | 65.21 | |
| PCC Overlay | 29 | 5.19 | 1.61 | 12.59 | 7.22 | 2.19 | 14.63 |
| Material Type | Number of Analysis Layers | Mean COV, % | Min COV, % | MaxCOV, % | Mean St. Dev., mm | Min St. Dev., mm | Max St. Dev., mm |
|---|---|---|---|---|---|---|---|
| DGAB | 219 | 8.78 | 1.90 | 37.44 | 13.00 | 3.20 | 55.76 |
| DGATB | 97 | 5.31 | 1.79 | 15.10 | 9.50 | 3.87 | 24.48 |
| LC | 48 | 5.69 | 2.55 | 20.33 | 8.96 | 3.81 | 32.38 |
| PATB | 129 | 8.74 | 3.45 | 21.21 | 8.91 | 3.59 | 20.41 |
| PCC | 177 | 4.18 | 0.98 | 17.98 | 8.61 | 2.88 | 22.96 |
| SB | 319 | 8.32 | 2.01 | 35.80 | 8.41 | 2.47 | 21.10 |
For the newly constructed SPS layers (layers that were constructed during the LTPP program and were monitored by the LTPP team), both elevation and core thickness measurements are available in the LTPP database. These two measurement methods employ different measuring techniques. The objective of this section is to evaluate if the means and the variances derived from these two methods are significantly different from each other at the project-level. Thus, the analysis is based on evaluation of statistical indicators derived for each layer of each SPS section. Only newly constructed SPS layers were used in the analysis.
Analysis Methodology
The normality of distribution of elevation data was tested and it was concluded that for a majority of sections and for all material types the distribution is normal. The detailed results are presented in chapter 5. In this analysis it was assumed that core thickness measurements have also normal distribution, because they represent different sort of the measurements for the same kind of data.
The variances and means of layer thickness data were obtained for each newly constructed layer from each SPS section from two different data sources, elevation and core thickness measurements, were compared to determine the level of agreement.
Two statistical procedures were utilized to perform the comparison of elevation and core thickness measurements:


Analysis Data Set
Elevation data for bound asphalt and concrete layers were available for 770 individual layers, while core data were available for only 616 layers. However, both elevation and core thickness data were available for only 498 asphalt and concrete layers. For 118 layers, only core data were available and for 272 layers only elevation data were available. Additionally, for 15 layers only one core measurement per layer was available. Therefore, the total number of asphalt and concrete layers used in the analysis was 483. Table 27 presents the summary of data availability.
| Layer Type | Experiment | Number of Layers with both Elevation and Core Data |
|---|---|---|
| DGATB | SPS-1 | 59 |
| PATB | SPS-1 | 30 |
| SPS-2 | - | |
| LC | SPS-2 | 31 |
| PCC | SPS-2 | 123 |
| SPS-7 | 15 | |
| SPS-8 | 2 | |
| SB | SPS-1 | 134 |
| SPS-5 | 60 | |
| SPS-6 | 15 | |
| SPS-8 | 14 | |
| Total | 483 |
Comparison of the Standard Deviation and COV Values
Figure 16 provides a comparison of the standard deviations computed from core thickness measurements versus standard deviations computed from elevation thickness for all the layers. For the standard deviation values below 10 mm, the standard deviations computed from the core thickness data are lower than the standard deviations computed from the elevation measurements in most cases. However, for standard deviations above 10 mm, the standard deviations from the core data are higher than the standard deviations computed from the elevation measurements for a significant number of cases. For the majority of the elevation data, the standard deviation is below 20 mm.
Overall, 321 layers (66.5 percent) had a standard deviation computed from the elevation measurements higher than the standard deviation computed from the core measurements. Figure 16 indicates that, for a few sections, the variation of core thickness was very high as compared to the elevation-determined thickness. However, the differences between the standard deviations were not statistically significant (99 percent confidence level) for a large majority of the sections.
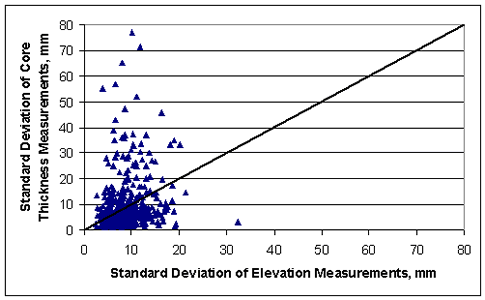
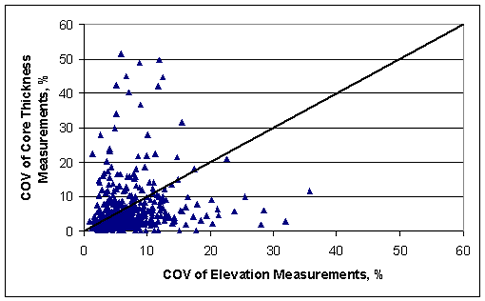
Figure 17 provides a comparison between the COV values computed from the elevation and core thickness data sets. Over 80 percent of the COV values computed using each data set are below 10 percent. However, a small percentage of sections show low COV computed from one data source and high COV computed using the other data source, i.e. high COVs for elevation measurements and low COVs for core thickness measurements for the same section, or vice versa.
Comparison of the Variances
Table 28 presents the results of the comparison of variances. Sections were grouped by material type, experiment number, target thickness, and subbase type. For more than 80 percent of the sections, the differences between variances obtained from elevation and core thickness measurements were not statistically significant (99 percent confidence level). This percentage is even higher for DGATB and LC layers (about 90 percent).
The greatest differences of variance values were observed for PATB and some analysis cells with PCC and SB layers, and the lowest differences were observed for DGATB and LC layers.
| Material Type | EXP. | Target Thickness | Subbase | Variance | Total Number of Sections | ||||
|---|---|---|---|---|---|---|---|---|---|
| Equal | Unequal | ||||||||
| mm | in | Number of Sections | Percent of Sections | Number of Sections | Percent of Sections | ||||
| DGATB | SPS-1 | 102 | 4 | 12 | 80.0 | 3 | 20.0 | 15 | |
| 203 | 8 | 25 | 92.6 | 2 | 7.4 | 27 | |||
| 305 | 12 | 16 | 94.1 | 1 | 5.9 | 17 | |||
| PATB | SPS-1 | 102 | 4 | 22 | 73.3 | 8 | 26.7 | 30 | |
| LC | SPS-2 | 152 | 6 | 28 | 90.3 | 3 | 9.7 | 31 | |
| PCC | SPS-2 | 203 | 8 | S1 | 17 | 77.3 | 5 | 22.7 | 22 |
| W2 | 35 | 89.7 | 4 | 10.3 | 39 | ||||
| 279 | 11 | S | 15 | 68.2 | 7 | 31.8 | 22 | ||
| W | 35 | 87.5 | 5 | 12.5 | 40 | ||||
| SPS-7 | 76 | 3 | S | 6 | 85.7 | 1 | 14.3 | 7 | |
| 127 | 5 | S | 4 | 50.0 | 4 | 50.0 | 8 | ||
| SPS-8 | 203 | 8 | W | 1 | 100.0 | 0 | 0.0 | 1 | |
| 279 | 11 | W | 1 | 100.0 | 0 | 0.0 | 1 | ||
| SB | SPS-1 | 102 | 4 | S | 33 | 82.5 | 7 | 17.5 | 40 |
| W | 25 | 86.2 | 4 | 13.8 | 29 | ||||
| 178 | 7 | S | 32 | 86.5 | 5 | 13.5 | 37 | ||
| W | 20 | 71.4 | 8 | 28.6 | 28 | ||||
| SPS-5 | 51 | 2 | S | 24 | 85.7 | 4 | 14.3 | 28 | |
| 127 | 5 | S | 23 | 71.9 | 9 | 38.1 | 32 | ||
| SPS-6 | 102 | 4 | S | 12 | 100.0 | 0 | 0.0 | 12 | |
| 203 | 8 | S | 1 | 33.3 | 2 | 66.7 | 3 | ||
| SPS-8 | 102 | 4 | W | 5 | 71.4 | 2 | 28.6 | 7 | |
| 178 | 7 | W | 5 | 71.4 | 2 | 28.6 | 7 | ||
| Total | 397 | 82.2 | 86 | 17.8 | 483 | ||||
| Notes: S - "Strong" subbase (DGATB, LC). W - "Weak" subbase (DGAB, PATB). | |||||||||
Comparison of the Means
The mean layer thicknesses computed from elevations and those computed from core samples were compared using the t-test at a 95 percent confidence level and assuming either equal or unequal variances, based on the F-test results, presented in table 28. The results of the t-tests are presented in table 29.
| Material Type | Exp. | Target Thicknesses | Subbase | No Significant Difference between Elevation and Core Thickness | Significant Difference between Elevation and Core Thickness | Total Number of Sections | |||
|---|---|---|---|---|---|---|---|---|---|
| mm | in | Number of Sections | Percent of Sections | Number of Sections | Percent of Sections | ||||
| DGATB | SPS-1 | 102 | 4 | 9 | 60.0 | 6 | 40.0 | 15 | |
| SPS-1 | 203 | 8 | 20 | 74.1 | 7 | 25.9 | 27 | ||
| SPS-1 | 305 | 12 | 8 | 47.1 | 9 | 52.9 | 17 | ||
| LC | SPS-2 | 152 | 6 | 20 | 64.5 | 11 | 35.5 | 31 | |
| PATB | SPS-1 | 102 | 4 | 12 | 40.0 | 18 | 60.0 | 30 | |
| PCC | SPS-2 | 203 | 8 | S | 14 | 63.6 | 8 | 36.4 | 22 |
| SPS-2 | W | 16 | 41.0 | 23 | 59.0 | 39 | |||
| SPS-2 | 279 | 11 | S | 10 | 45.5 | 12 | 54.5 | 22 | |
| SPS-2 | W | 16 | 40.0 | 24 | 60.0 | 40 | |||
| SPS-7 | 76 | 3 | S | 3 | 42.9 | 4 | 57.1 | 7 | |
| SPS-7 | 127 | 5 | S | 5 | 62.5 | 3 | 37.5 | 8 | |
| SPS-8 | 203 | 8 | W | 0 | 0.0 | 1 | 100.0 | 1 | |
| SPS-8 | 279 | 11 | W | 1 | 100.0 | 0 | 0.0 | 1 | |
| SB | SPS-1 | 102 | 4 | S | 19 | 47.5 | 21 | 52.5 | 40 |
| SPS-1 | W | 10 | 34.5 | 19 | 65.5 | 29 | |||
| SPS-1 | 178 | 7 | S | 11 | 29.7 | 26 | 70.3 | 37 | |
| SPS-1 | W | 13 | 46.4 | 15 | 53.6 | 28 | |||
| SPS-5 | 51 | 2 | S | 10 | 35.7 | 18 | 64.3 | 28 | |
| SPS-5 | 127 | 5 | S | 12 | 37.5 | 20 | 62.5 | 32 | |
| SPS-6 | 102 | 4 | S | 9 | 75.0 | 3 | 25.0 | 12 | |
| SPS-6 | 203 | 8 | S | 2 | 66.7 | 1 | 33.3 | 3 | |
| SPS-8 | 102 | 4 | W | 3 | 42.9 | 4 | 57.1 | 7 | |
| SPS-8 | 178 | 7 | W | 4 | 57.1 | 3 | 42.9 | 7 | |
| Total | 47.0 | 256 | 53.0 | 483 | |||||
| Notes: S - "Strong" subbase (DGATB, LC). W - "Weak" subbase (DGAB, PATB). | |||||||||
Based on the t-test results, the mean thicknesses computed from the core measurements are not different from those computed from the elevation measurements at a 95 percent confidence level for 227 (47 percent) of all layers analyzed. The opposite is true for the remaining 256 layers analyzed (53 percent).
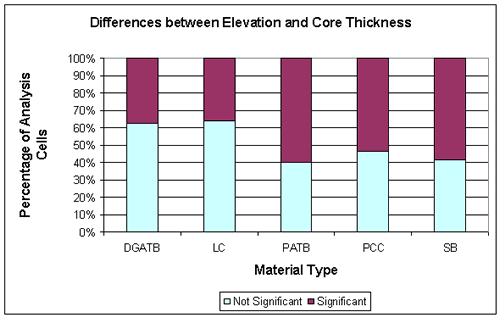
Figure 18 presents aggregated results of the statistical analysis of the differences between elevation and core thickness measurements. More than 60 percent of the layers with DGATB and LC had no significant difference between elevation and core thickness data. This percentage is about 40 for PATB, PCC, and SB layers.
In this chapter, the layer thickness variability indicators available in the LTPP database were reviewed. A discussion about the limitations of the available data was provided. In addition, new layer thickness variability indicators (mean, range, standard deviation, COV, and variance) were developed based on the core thickness measurements and field elevation measurements (SPS only) from the most recent LTPP database upload (release 11.5 version NT3.0, obtained on June 8, 2001).
Evaluation of Layer Thickness Variability Reasonableness
Using layer thickness summary statistics, reasonableness of the layer thickness variability data was evaluated. The purpose of the analysis was to compare layer thickness variation for each section and each layer with the benchmark layer thickness variability values. The analysis results indicated that over 88 percent of layers have layer thickness variability indicators below the benchmark values.
Additionally, typical values and ranges of layer thickness variability indicators for different layer and material types were computed. These typical values could serve as approximate estimates of the expected layer thickness variability for the project-level analysis and design.
Excessive Variability in Layer Thickness
For the layer thickness data obtained from the core measurements, 257 layers (10.0 percent) from the TST_AC01_LAYER table and 125 layers (18.8 percent) from the TST_PC06 table had excessive variability in the layer thickness data even after outliers were removed.
For the layer thickness data obtained from the elevation measurements, 139 layers (14.1 percent) from the SPS*_LAYER tables had excessive variability in the layer thickness data even after outliers were removed.
No remedial action was taken for the identified records. However, comment codes were assigned in the analysis summary table to the records containing such data. To determine the reasons for excessive variability, individual core samples should be reviewed.
Comparison of Layer Thickness Variability Indicators from Different Data Sources
Statistical comparisons were made between the layer thickness variances and means obtained from the core and elevation thickness measurements. Only data for newly constructed SPS sections were utilized. The results of the analysis are as follows:

