U.S. Department of Transportation
Federal Highway Administration
1200 New Jersey Avenue, SE
Washington, DC 20590
202-366-4000
Federal Highway Administration Research and Technology
Coordinating, Developing, and Delivering Highway Transportation Innovations
 |
| This report is an archived publication and may contain dated technical, contact, and link information |
|
Publication Number: FHWA-RD-02-082 Date: August 2006 |
This test site is the pavement described in the SHRP C-343 report, "Eliminating or Minimizing Alkali-Silica Reactivity." The test section consists of eleven 24.4-meter (m) groups of five-slab panels on the travel (number 2) lane of U.S. Interstate 80 (I-80) just east of Winnemucca, NV. The pavement was built in 1981. It consists of a plain, jointed, 20.3-centimeter (cm)-thick concrete slab over a 15.2-cm portland cement-treated base and a 7.6-cm gravel subbase. An asphalt concrete bondbreaker was used between the base and subbase. Non-doweled, skewed transverse joints are spaced at a repeating pattern of 3.66, 3.97, 5.49, and 5.80 m. Coarse aggregate was reportedly obtained from a commercial source in Winnemucca, and an American Society of Testing Materials (ASTM) Type II low-alkali cement was used. An overall view of the section is shown in figure 1. A key to the sections is given in figure 2.
Different surface treatment materials were applied to each five-slab-long test section. The materials tested were a high-molecular weight methacrylate resin (Sika Pronto 19TF), a polysiloxane resin sealer (Sikagard 70), a lithium hydroxide solution, a silane sealer (SilAct), and a linseed oil. There are also three five-slab-long untreated control sections. The treatments were applied in 1991 and 1992. Two different sets of test slabs were treated. One section, on the east end of the test site, includes the sections methacrylate 1 (M1), control 1 (C1), lithium 1 (L1), siloxane 1 (S1), and control 2 (C2). A second group of the same materials was applied on slabs on the west end of the test site; methacrylate (M2), siloxane (S2), lithium (L2), and control 3 (C3). The pavement in the west end of the test area was less severely distressed than the sections in the east end. Within 1 year, two additional treatments were applied to the sections. One section used SilAct silane and was designated silane number 2 section 1 (SA1). The other material was a linseed oil and was designated linseed oil section 1 (LO1). Two additional applications of 10 percent LiOH solution were applied to the existing LiOH test areas. The following excerpt describes the application of the test materials (letter, Stark to Surdahl, October 8, 1987):
During the SHRP program in 1991, a search was made for an existing pavement where several candidate techniques for mitigating ASR might be investigated. Mr. Richard Moore, Materials and Testing Engineer of the State of Nevada, Department of Transportation (DOT), and the writer concluded that the abovementioned I-80 pavement exhibited the intended severity of cracking due to ASR to be the test pavement. It was preferred that ASR be only moderate so that traffic loading would not render such severe distress that remediation efforts would have no potential to arrest ASR-related distress. Based on SHRP laboratory work, LiOH was considered a satisfactory candidate. The intent was to spray the solution on the top of the wearing surface several times to allow penetration into the concrete, thereby arresting ASR. The second surface-applied treatment was a high-molecular weight methacrylate known as Sika Pronto 19 TF. It was a twocomponent, rapid curing, solvent-free product intended to penetrate and bond near-surface ASR and other cracks, thereby strengthening the pavement concrete against further distress.
Figure 1. Overall view of Winnemucca, NV test site.
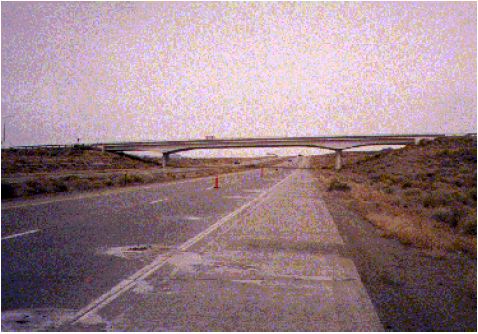
Figure 2. Winnemucca, NV test section layout.
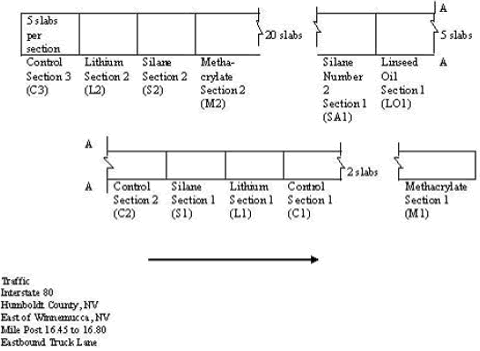
A third surface treatment was Sikagard 70. It was a blend of polysiloxane resins that was a colorless, nonfilm-forming, nonvapor barrier formulation to seal absorbent cementitious surfaces. The intent was to minimize penetration of atmospheric moisture into the concrete pavement, thereby reducing additional cracking from swelling of ASR gel reaction products. Figure 2 shows the location of the individual test sections.
The first three surface treatments were applied on October 2, 1991. Prior to the initial application, all surfaces, including the nontreated control sections were sand- and air-blasted to remove adhered surface debris to facilitate penetration of the treatment. The Sikagard 70 polysiloxane sealant was sprayed on at the recommended rate of (9.3 m2/3.8 liter (L) (100 square feet per gallon (ft2/gal)) in a single application. Sika Pronto 19 Tack Free was squeegeed and broomed on the surface at a rate of 6.5 to 7.4 m2/3.8 L (70 to 80 ft2/gal), then treated with fine (sandblasting) sand to minimize stickiness during setting that day.
A 283.88 L quantity of a 10 percent LiOH solution was used for the two treatment areas. The LiOH was dissolved in a wheeled spray tank on October 1, 1991, and stored at the maintenance garage in Winnemucca. The following day, after surface cleaning, four individual applications of LiOH solution were sprayed on immediately following atmospheric surface drying during the late morning and middle afternoon. The rate of application was calculated at 5.6 m2/3.8 L (60 ft2/gal) for the 10 percent LiOH solution.
On October 7, 1992, one year after the initial testing, three additional surface treatments were applied on the same region of Eastbound I-80 near Winnemucca. One application of linseed oil and one of SilAct silane each were applied to test sections as shown in figure 2. Also, two applications of the 10 percent LiOH solution were applied to the same test sections, at the same locations as before. These were applied at the rate of 1.7 m2/3.8 L (18 ft2/gal).
The Winnemucca pavement test section was inspected each fall for the 5 years of the study. Table 1 shows the inspection dates for this site. Annual tests included visual inspection and crack mapping, faulting measurements, relative humidity measurements, FWD readings (performed by the Nevada DOT), and core removal for wet and dry modulus testing and petrographic studies. The cores were taken by Nevada DOT personnel.
| Year | Inspection Dates | Weather Conditions |
|---|---|---|
| 1994 | October 18, 1994 | Warm, 65—90 °F |
| 1995 | December 12, 1995 | Rainy, breezy, 50 °F |
| 1996 | December 5, 1996 | Rain, snow, 40 °F |
| 1997 | October 9, 1997 | Cold, became clear, 50—60 °F |
| 1998 | October 28, 1998 | Cold, showers, 40 °F |
The condition of the pavement test section was determined by visual inspection. Notes were made as to the extent of map cracking, transverse cracking, etc. Generally, all sections had extensive map cracking, but some sections were worse than others. The condition of one section was compared to others. The results of the final visual inspection (1998) are given below. Photographs of typical sections are shown in appendix A.
The joint ratings categorized the length of crack or joint at each severity level. This provided more information than the overall rating, based on the 10 percent rule defined in the LTPP rating system. Using the 10 percent rule rating method it is sometimes difficult to describe the actual visual difference between two sections. In the LTPP rating system, as long as a joint has at least 10 percent high-severity spalling, it is labeled high. The joint distress ratings for this project and test site were further defined using the following rating scale.
Figure 3 shows an example of joint distress of high severity, and figure 4 shows an example of joint distress of medium severity.
Figure 3. Joint distress of high severity (Winnemucca, NV).
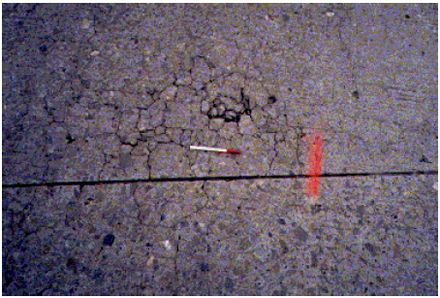
Figure 4. Joint distress of medium severity (Winnemucca, NV).
Figures 5 through 9 show the amount and severity of joint distress for each section over the 4 years of the study. The figures are based on the 10 percent rule defined in the LTPP rating system. The amount and severity of joint distress has increased considerably during the study period. In 1994, all the joint distress was rated low except for small areas in sections SA1, C3, LO1, and M2 where the rating was medium. At that time, there were a large number of joints that had lengths without cracking or spalling. The deterioration increased to a point in 1998 where almost the entire length of all transverse joints in each test section is distressed. The only section with any joint length rated low was section S2 (figure 9). The joints in several sections (C2, L1, C3, and S1) are rated high using the 10 percent rule.
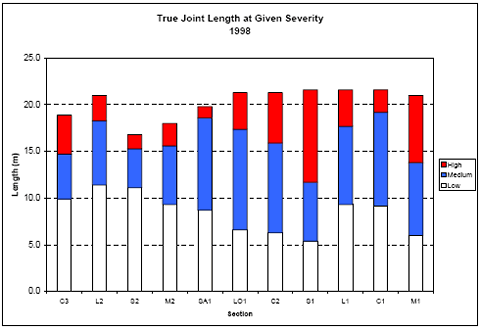
Figure 10 shows the actual measured joint length at each level of severity for all the sections in 1998. If the true joint length at each severity is considered, all sections have some areas of lowseverity spalling. The length of high-severity joint spalling per section is less than the length of low- and medium-severity spalling. The section with the most high-severity joint distress is S1. The sections with the least amount of high joint distress are SA1 and S2, but these slabs were in better condition at the start of the study. Of the sections in the same group or beginning condition as S1, the section with least amount of high-severity spalling is section C1 (control). The next best is section L1. In the second group of sections, which were initially in better shape, the one with the most high-severity spalling is C3, followed by section LO1.
Figure 5. Joint distress for all sections of Winnemucca test site (1994).
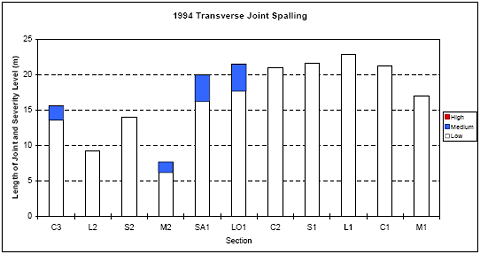
Figure 6. Joint distress for all sections of Winnemucca test site (1995).
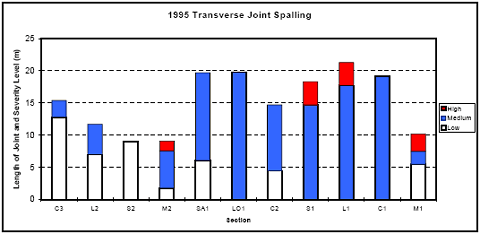
Figure 7. Joint distress for all sections of Winnemucca test site (1996).
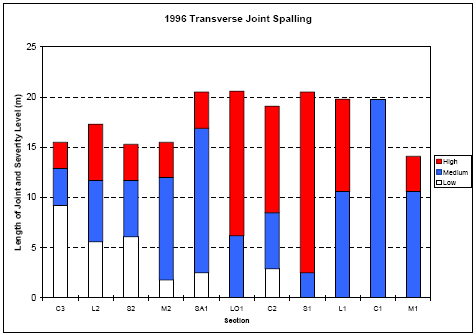
Figure 8. Joint distress for all sections of Winnemucca test site (1997).
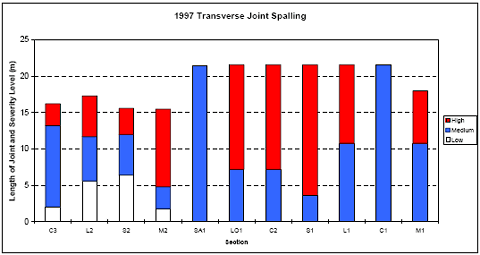
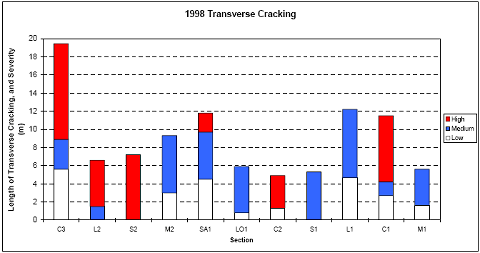
Figure 9. Joint distress for all sections of Winnemucca test site (1998).
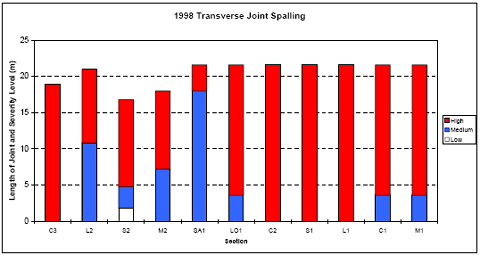
Figure 10. Actual joint length of each severity level for each section (Winnemucca, NV, 1998).
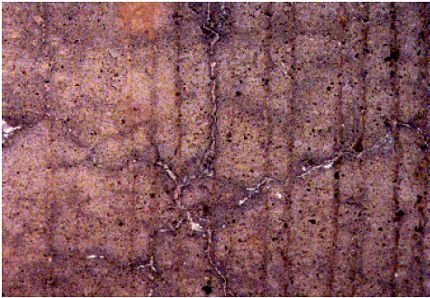
Almost the entire test site was covered with map cracking when the study began in 1994. The cracking is more visible in the wheelpaths and shoulder areas (figure 11), but it does cover the entire pavement surface. Many of the cracks have efflorescence, as shown in figure 12. Because the entire test site is covered with fine map cracking, it is meaningless to compare sections on the basis of map cracking according to LTPP criteria. Therefore, only areas of severe map cracking will be discussed and used to compare the sections. The severely map cracked areas typically appeared in the wheelpaths, especially at the joints. These areas represent locations where spalling or loss of concrete pieces has occurred or is likely to occur in the near future. Sometimes loss of base support and depressions occur. The number and area of interconnected "pockets" of severe cracking were noted during the visual survey and were recorded in category 8a in the SHRP LTPP recording sheets.
Figure 11. Photograph showing widespread map cracking in shoulder area of Winnemucca test site.
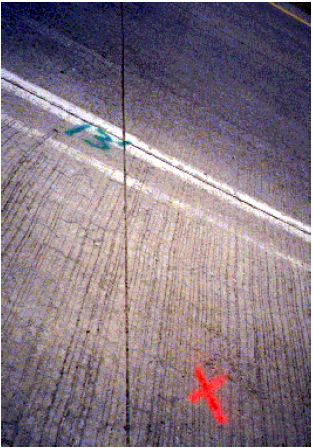
Figure 12. Close-up of map cracking with efflorescence (Winnemucca, NV).
The number of areas of severe map cracking in each section has increased each year over the 4 years. However, sections C2, LO1, and M2 have remained nearly constant for the last 2 years. Figure 13 shows the number of areas of severe map cracking in each section for the years 1995 through 1998. The sections with the most severe map cracking in 1998 are sections M1 and S1 with 16 and 18 areas, respectively. The sections with the least number of areas are sections L2 with eight areas and M2 and S2 with nine areas.
Figure 13. Number of areas of severe map cracking in each section from 1995 through 1998 (Winnemucca, NV).
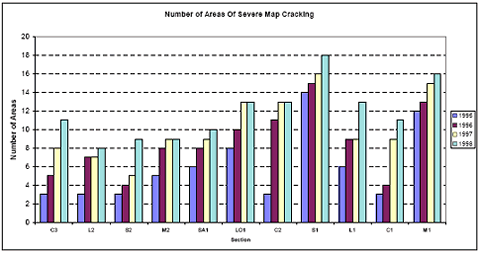
Figure 14 shows the total area of severe map cracking for each section for the years 1995 and 1998. The most distressed sections are the S1 and M1 sections, which have approximately 16 and 15 square meters (m2) of severe cracking, respectively. These sections also had the most distress at the start of the study. They are followed by section LO1 with approximately 11 m2 and section C2 with about 9 m2. These sections are all at the eastern end of the test site, which had the more severe cracking at the start of the test. sections L1 and C1 have the least area affected of the sections in the eastern end. Of the sections in the western end of the site, section M2, with over 7 m2 of severe map cracked area, is the worst. The best performing section in this group is section L2, with 4 m2.
Overall, the only treatment that shows minor improvement in severe map cracking over the control sections is the LiOH (sections L1 and L2). In 1998, section L2 had less area affected than control 3 in the western end of the site. Section L1 in the eastern end had less area affected than control 2 and about the same amount as control 1. In general, all the test sections are performing similar to or worse than the control sections.
Figure 14. Total area of severe map cracking for each section for 1995 through 1998 (Winnemucca, NV).
The severity of the wheelpath and centerline map cracking at the center of the slabs, away from the transverse joints, was rated as low, medium, or high, as follows:
The wheelpath and centerline ratings for all sections for 1995 and 1998 are given in table 2. In general, the map cracking areas have increased in severity from 1995 to 1998. In 1995, no sections of wheelpath or centerline areas were rated high severity. The wheelpath areas were approximately 50 percent low and 50 percent medium severity in 1995, but in 1998 they were mostly of medium severity with some low- and occasional high-severity ratings.
| Section | C3 | L2 | S2 | M2 | SA1 | LO1 | C2 | S1 | L1 | C1 | M1 | |
|---|---|---|---|---|---|---|---|---|---|---|---|---|
| WP | L | 2 | 3 | 3 | 4 | 3 | 1 | 2 | 0 | 0 | 0 | 5 |
| M | 3 | 2 | 2 | 1 | 2 | 4 | 3 | 5 | 5 | 5 | 0 | |
| 1995 | H | 0 | 0 | 0 | 0 | 0 | 0 | 0 | 0 | 0 | 0 | 0 |
| WP | L | 0 | 1 | 1 | 1 | 0 | 0 | 0 | 0 | 0 | 0 | 0 |
| M | 4 | 4 | 2 | 4 | 5 | 5 | 3 | 3 | 5 | 4 | 3 | |
| 1998 | H | 1 | 0 | 2 | 0 | 0 | 0 | 2 | 2 | 0 | 1 | 2 |
| CL | L | 4 | 5 | 5 | 5 | 3 | 3 | 5 | 3 | 4 | 4 | 5 |
| M | 1 | 0 | 0 | 0 | 2 | 2 | 0 | 2 | 1 | 1 | 0 | |
| 1995 | H | 0 | 0 | 0 | 0 | 0 | 0 | 0 | 0 | 0 | 0 | 0 |
| CL | L | 1 | 3 | 0 | 5 | 0 | 1 | 0 | 0 | 2 | 1 | 4 |
| M | 4 | 2 | 5 | 0 | 5 | 4 | 5 | 5 | 3 | 4 | 1 | |
| 1998 | H | 0 | 0 | 0 | 0 | 0 | 0 | 0 | 0 | 0 | 0 | 0 |
In 1995, the centerline areas were mostly of low severity with some medium-severity areas, but in 1998, the centerlines are mostly of medium severity with some low-severity areas. In 1998, there were no areas of high-severity cracking in the centerline areas.
In 1998, sections M1, C2, and S1 had the highest levels of distress in the wheelpaths with three panels rated medium severity and two panels rated high severity. Section M2 and L2 had the lowest wheelpath distress in 1998 with one panel rated low severity and four panels rated medium severity. Sections L2, LO1, and L1 had moderately low relative distress. Sections S2, SA1, C2, and S1 all had the highest level of centerline distress in 1998 with all five panels rated medium severity. Section M2 had the lowest distress in the centerline area with all five panels rated low severity.
All of the test sections have several transverse cracks, such as that shown in figure 15. Some extend full width while others only reach partway across the lane. Some other transverse cracks, such as the one in figure 16, intersect with longitudinal cracks. A comparison of the transverse cracking for each year is shown in figures 17 through 21. Table 3 indicates the number of transverse cracks in each section for all years of the study. A transverse crack consists of a single distinct crack or a single crack with only a few branches. The number of transverse cracks in a section can decrease if the crack becomes part of an area of severe map cracking.
Figure 15. Full-width transverse cracking in test section (Winnemucca, NV).
Figure 16. Transverse cracking with intersecting longitudinal crack (Winnemucca, NV).
Figure 17. Amount and severity of transverse cracking for all sections (Winnemucca, NV, 1994).
Figure 18. Amount and severity of transverse cracking for all sections (Winnemucca, NV, 1995).
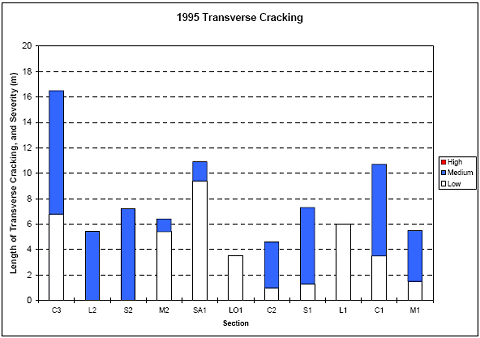
Figure 19. Amount and severity of transverse cracking for all sections (Winnemucca, NV, 1996).
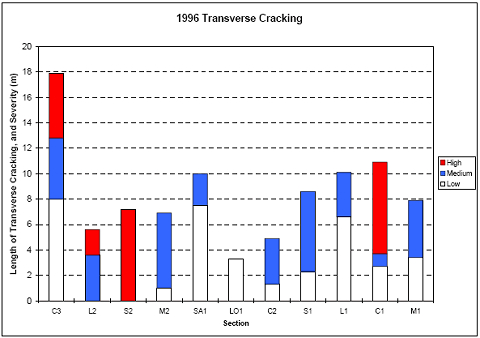
Figure 20. Amount and severity of transverse cracking for all sections (Winnemucca, NV, 1997).
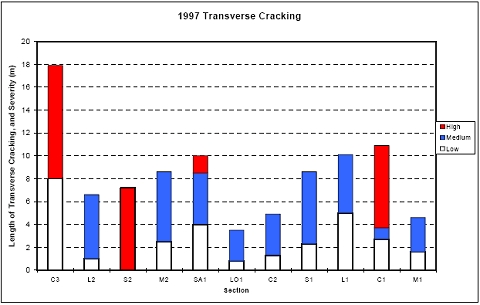
Figure 21. Amount and severity of transverse cracking for all sections (Winnemucca, NV, 1998).
| Section ID | Year | ||||
|---|---|---|---|---|---|
| 1994 | 1995 | 1996 | 1997 | 1998 | |
| C3 | 11 | 10 | 11 | 11 | 11 |
| L2 | 3 | 2 | 2 | 3 | 3 |
| S2 | 3 | 2 | 2 | 2 | 2 |
| M2 | 5 | 4 | 4 | 5 | 5 |
| SA1 | 8 | 8 | 8 | 8 | 8 |
| LO-1 | 2 | 3 | 3 | 3 | 3 |
| C2 | 3 | 2 | 2 | 2 | 2 |
| S1 | 7 | 7 | 8 | 8 | 4 |
| L1 | 7 | 7 | 7 | 7 | 8 |
| C1 | 7 | 6 | 6 | 6 | 6 |
| M1 | 4 | 4 | 4 | 4 | 5 |
Section C3 (control) has the most cracks at 11, and the greatest length of high-severity cracking. However, the section with the lowest total number and length of transverse cracking is section C2 (control). Section S2 also has the fewest number of cracks, but all cracks are high severity. The section with the lowest overall severity of transverse cracking is section M1. Transverse cracking does not appear to be a good indicator of relative performance of these ASR test sections.
Core samples were removed from each test section and tested for modulus of elasticity in both dry and wet conditions. In the field, after some cores came out in several pieces, an additional core had to be taken. The dry-tested and wet-tested moduli of elasticity for the test sections over the 4-year test duration are shown in tables 4 and 5. The cores taken in 1994 were only tested in the dry condition. A summary of the average data is shown in table 6.
There is no obvious trend from 1994 to 1998. The measured modulus fluctuated up and down over the test period. There is, however, a trend when the test sections from different groups are studied. For all sections in 1998, the average dry modulus of elasticity is 13.92 x 10⁶ kilopascals (kPa) (2.02 x 10⁶ pounds per square inch (psi)).
The average for the group of test sections at the eastern end that were originally in worse condition (C1, C2, L1, M1, and S1) is 11.78 x 10⁶ kPa (1.71 x 10⁶ psi) while the sections on the western end (C3, L2, M2, and S2) have an average modulus of 15.71 x 10⁶ kPa (2.28 x 10⁶ psi). For the wet-tested modulus, shown in tables 5 and 6, the trend is the same. The east group of sections has an average modulus of elasticity of 10.82 x 10⁶ kPa (1.57 x 10⁶ psi) compared to 14.33 x 10⁶ kPa (2.08 x 10⁶ psi) for the west group.
The same trend is also found in the compressive strength results listed in table 7. All compressive strength tests were conducted on dry cores. No compressive strength tests were conducted on cores from 1994 or 1995 since compressive strength was not in the original scope of work. In 1998, the average strength of the sections in the east group is 32,564 kPa (4,723 psi) compared to 37,101 kPa (5,381 psi) for the sections in the west group. In general, it appears the concrete in the western end of the site was in better condition at the beginning of the study and suffered a lesser amount of distress during the study. There is no trend to indicate which surface treatment is performing better than the others.
| Section ID | Year | ||||
|---|---|---|---|---|---|
| 1994 | 1995 | 1996 | 1997 | 1998 | |
| C3 | 2.28 | 2.77 | 2.73 | 2.60 | 1.97 |
| L2 | 3.41 | 2.31 | 3.49 | 4.06 | 2.74 |
| S2 | 1.74 | 1.84 | 3.25 | 2.34 | 1.88 |
| M2 | 2.04 | 1.59 | 1.96 | 2.02 | 2.35 |
| SA1 | 1.67 | 2.69 | 1.75 | 2.34 | 2.28 |
| LO1 | 2.31 | 1.46 | 1.19 | 2.49 | 2.47 |
| C2 | – | 1.46 | 1.99 | 2.83 | 1.20 |
| S1 | 1.67 | 1.11 | 1.93 | 1.49 | 1.97 |
| L1 | 2.17 | 1.62 | – | 1.72 | 1.53 |
| C1 | 2.71 | 2.06 | – | 1.72 | 2.45 |
| M1 | 0.97 | 1.71 | – | 1.19 | 1.40 |
| Average | 2.10 | 1.87 | 2.29 | 2.25 | 2.02 |
| Section ID | Year | ||||
|---|---|---|---|---|---|
| 1994 | 1995 | 1996 | 1997 | 1998 | |
| C3 | – | 3.08 | 2.23 | 2.39 | 2.20 |
| L2 | – | 2.59 | 3.51 | 3.90 | 2.51 |
| S2 | – | 1.96 | 3.00 | 2.72 | 1.84 |
| M2 | – | 1.70 | 1.72 | 1.64 | 2.08 |
| SA1 | – | 2.86 | 1.84 | 2.22 | 2.12 |
| LO1 | 1.52 | 1.28 | 2.37 | 1.70 | |
| C2 | – | 1.56 | 1.82 | 3.60 | 1.64 |
| S1 | – | 1.04 | 1.93 | 1.23 | 1.03 |
| L1 | – | 1.62 | – | 1.80 | 1.04 |
| C1 | – | 2.12 | – | 1.25 | 2.46 |
| M1 | – | 1.81 | – | 1.24 | 1.66 |
| Average | – | 1.99 | 2.17 | 2.21 | 1.84 |
| Average | Year | ||||
|---|---|---|---|---|---|
| 1994 | 1995 | 1996 | 1997 | 1998 | |
| E-dry | 2.09 | 1.87 | 2.29 | 2.25 | 2.02 |
| E-dry east | 1.88 | 1.59 | 1.96 | 1.79 | 1.71 |
| E-dry west | 2.24 | 2.11 | 2.40 | 2.64 | 2.28 |
| E-wet | – | 1.99 | 2.17 | 2.21 | 1.84 |
| E-wet east | – | 1.63 | 1.88 | 1.82 | 1.57 |
| E-wet west | – | 2.29 | 2.26 | 2.54 | 2.08 |
| Section | Year | ||
|---|---|---|---|
| 1996 | 1997 | 1998 | |
| C3 | 6951 | 4968 | 4831 |
| L2 | 6230 | 5028 | 5811 |
| S2 | 6210 | 5511 | 4837 |
| M2 | 5968 | 5132 | 5875 |
| SA1 | 6785 | 5244 | 5633 |
| LO1 | 5444 | 5573 | 5297 |
| C2 | 5395 | 5141 | 4305 |
| S1 | 6401 | 4250 | 4279 |
| L1 | – | 4494 | 4749 |
| C1 | – | 5113 | 5107 |
| M1 | 4510 | 4920 | 5175 |
| Average | 6173 | 5034 | 5082 |
Powdered samples of the concrete pavement were taken from various locations in 1995, 1997, and 1998. The samples were taken at four different depths, as shown in tables 8, 9, and 10. A rotary hammer drill with a 2.858-cm (1.125-inch) diameter drill bit was used to drill the concrete. The powder samples were sealed in glass containers. The humidity within the containers was measured using a resistance humidity probe.
| Section | Depth (inches) | |||
|---|---|---|---|---|
| 0.5–1 | 2–2.5 | 4–4.5 | 6–6.5 | |
| C3 | 47 | 76 | 86 | 91 |
| L2 | 38 | 60 | 83 | 89 |
| S2 | 52 | 86 | 89 | 98 |
| M2 | 40 | 68 | 89 | 91 |
| SA1 | 44 | 73 | 92 | 86 |
| LO1 | 38 | 61 | 85 | 81 |
| C2 | 96 | 98 | 90 | 100 |
| S1 | 44 | 96 | 99 | 97 |
| L1 | 56 | 74 | 88 | 95 |
| C1 | 40 | 58 | 86 | 91 |
| M1 | 59 | 80 | 69 | 93 |
| Section | Depth (inches) | |||
|---|---|---|---|---|
| 0.5–1 | 2–2.5 | 4–4.5 | 6–6.5 | |
| C3 | 78 | 95 | 96 | 97 |
| L2 | 87 | 94 | 99 | 99 |
| S2 | 39 | 62 | 96 | 97 |
| M2 | 88 | 97 | 92 | 99 |
| SA1 | 71 | 88 | 96 | 93 |
| LO1 | 100 | 100 | 100 | 100 |
| Section | Depth (inches) | |||
|---|---|---|---|---|
| 0.5–1 | 2–2.5 | 4–4.5 | 6–6.5 | |
| C3 | 100 | 100 | 100 | 100 |
| L2 | 100 | 100 | 100 | 100 |
| S2 | 100 | 100 | 100 | 100 |
| M2 | 100 | 100 | 100 | 100 |
| SA1 | 100 | 100 | 100 | 100 |
| LO1 | 100 | 100 | 100 | 100 |
Intermittent heavy rain occurred during the 1998 inspection. Light rain occurred after sampling in 1995. For all samples taken deeper than 10.2 cm (4.016 inch) below the surface, the relative humidity is typically more than 80 percent. This would indicate that even though the test site is in a dry climate, there is enough moisture migrating up from the soil underneath the pavement to sustain the ASR.
Petrographic examinations were made of at least one core from each test section at selected years. The core was cut into the largest possible rectangular prism, and two faces of the prism were lapped. Parallel sections were marked on each lapped face to delineate each traverse and ensure that the entire lapped surface was examined. Evidence of an ASR in the form of gel, cracks characteristic of ASR, and reacted particles were then counted. Cracks were counted more than once if they were encountered in more than one traverse.
The relative number of reacted coarse and fine aggregate particles should be regarded as approximate, since alkali-silica gel is highly mobile and may have migrated away from the originating particle. For example, gel may be present on the surface of a potentially reactive coarse aggregate particle that shows no other signs of distress. This particle would be counted as a reacted coarse aggregate particle although it is entirely possible the gel originated from an adjacent fine aggregate particle.
The petrographic reports are in appendix A. Table 11 gives a summary of the findings for the years 1996, 1997, and 1998. Generally, there is a significant increase in the number of cracks, particles that have reacted, and gel locations for all treatment sections in 1997 and 1998. Table 12 shows a summary and ranking of each section relative to the average number of cracks, reacted particles, and gel spots for 1997 and 1998.
| Core ID | Year | Cracks | Reacted particles | Gel | ||
|---|---|---|---|---|---|---|
| Micro | Large | Fine | Coarse | Locations | ||
| C1 | 1996 1997 1998 | – 61 40 | – 0 0 | – 22 115 | 0 8 17 | – 54 129 |
| C2 | 1996 1997 1998 | 54 34 139 | 0 0 3 | 11 42 129 | 0 9 35 | 10 58 104 |
| C3 | 1996 1997 1998 | 38 11 72 | 0 0 1 | 20 27 134 | 0 3 16 | 23 50 84 |
| M1 | 1996 1997 1998 | – 185 196 | – 0 7 | – 42 102 | – 13 47 | – 81 105 |
| M2 | 1996 1997 1998 | 22 48 75 | 0 0 0 | 8 27 65 | 0 5 35 | 22 75 73 |
| SA1 | 1996 1997 1998 | 7 77 114 | 0 0 1 | 1 64 156 | 0 10 43 | 10 41 78 |
| S1 | 1996 1997 1998 | 70 97 113 | 0 0 2 | 12 23 173 | 0 13 58 | 31 85 90 |
| S2 | 1996 1997 1998 | 15 29 153 | 0 0 3 | 7 53 102 | 0 14 45 | 8 40 116 |
| L1 | 1996 1997 1998 | 45 65 121 | 0 0 1 | 4 21 81 | 0 1 31 | 11 39 69 |
| L2 | 1996 1997 1998 | 1 20 23 | 0 0 0 | 4 22 126 | 0 0 16 | 20 32 88 |
| LO-1 | 1996 1997 1998 | 19 73 46 | 0 0 0 | 7 32 69 | 0 5 27 | 40 62 84 |
| Section | Cracks | Reacted Particles | Gel | Total |
|---|---|---|---|---|
| C3 | 84 | 180 | 134 | 398 |
| L2 | 43 | 164 | 120 | 327 |
| S2 | 185 | 214 | 156 | 555 |
| M2 | 123 | 132 | 148 | 403 |
| SA1 | 192 | 273 | 119 | 584 |
| LO1 | 119 | 133 | 146 | 398 |
| C2 | 176 | 215 | 162 | 553 |
| S1 | 212 | 267 | 175 | 654 |
| L1 | 187 | 134 | 108 | 429 |
| C1 | 101 | 162 | 183 | 446 |
| M1 | 388 | 204 | 186 | 778 |
Table 13 summarizes selected data for the Winnemucca, NV test site. Overall, little difference was seen in the performance of the test sections. None of the treatments stopped the progression of ASR distress. The humidity in the pavement was sufficient to allow continued ASR in each section. Review of all data indicates that sections L2 and M2 may have improved the durability slightly over the controls. None of treatments (LO1, S1, L1, M1) applied to the eastern pavement section, which started in the worst condition, improved performance. This indicates that the timing of the treatment may be important and treatment should be performed before the pavement is seriously distressed.
| Section ID | Percent Joint Distress 1998 | Severe Map Cracking (m2) 1998 | Wheelpath Ratings 1998-High | Centerline Ratings 1998-Med. | Average Modulus (10-6 psi) 1997-1998 | Average Compressive Strength (psi) 1997-1998 | Average Relative Humidity(%) 1995-1997 | Total Petrographic Defects 1997-1998 | |||
|---|---|---|---|---|---|---|---|---|---|---|---|
| Medium | High | Dry | Wet | Dry | 0.75 in. | 2.25 in. | |||||
| C3 | 24 | 23 | 6 | 1 | 4 | 2.29 | 2.30 | 4900 | 75 | 90 | 398 |
| L2 | 32 | 13 | 4 | 0 | 2 | 3.40 | 3.21 | 5420 | 75 | 85 | 327 |
| S2 | 24 | 10 | 6 | 2 | 5 | 2.11 | 2.28 | 5174 | 64 | 83 | 555 |
| M2 | 34 | 14 | 7 | 0 | 0 | 2.19 | 1.86 | 5504 | 76 | 88 | 403 |
| SA1 | 49 | 7 | 7 | 0 | 5 | 2.31 | 2.17 | 5439 | 72 | 87 | 584 |
| LO1 | 49 | 19 | 11 | 0 | 4 | 2.48 | 2.04 | 5435 | 79 | 87 | 398 |
| C2 | 44 | 26 | 9 | 2 | 5 | 2.02 | 2.62 | 4723 | 96 | 98 | 553 |
| S1 | 28 | 46 | 16 | 2 | 5 | 1.73 | 1.13 | 4265 | 44 | 96 | 654 |
| L1 | 37 | 18 | 6 | 0 | 3 | 1.63 | 1.42 | 4622 | 56 | 74 | 429 |
| C1 | 46 | 11 | 6 | 1 | 4 | 2.09 | 1.86 | 5110 | 40 | 58 | 446 |
| M1 | 36 | 35 | 15 | 2 | 1 | 1.30 | 1.45 | 5048 | 59 | 80 | 778 |

