U.S. Department of Transportation
Federal Highway Administration
1200 New Jersey Avenue, SE
Washington, DC 20590
202-366-4000
Federal Highway Administration Research and Technology
Coordinating, Developing, and Delivering Highway Transportation Innovations
 |
| This report is an archived publication and may contain dated technical, contact, and link information |
|
Publication Number: FHWA-RD-02-086 Date: August 2006 |
Previous | Table of Contents | Next
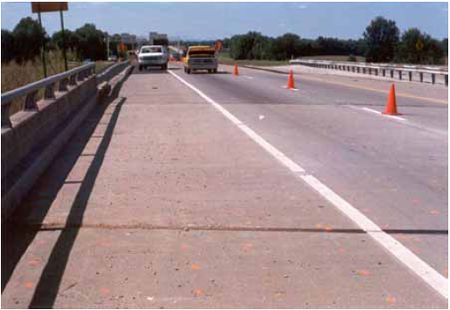
This test site consists of two medium-length (42 m, 243 ft) three-span parallel bridges carrying I–265 over KY 22, approximately 11 km (7 miles) northeast of the Louisville city limits on KY 22. The end spans are 15 m (49.5 ft) long, and the center span is 42 m (137 ft). The decks were constructed in 1969, and were rated as "satisfactory" by State forces in 1991. They were described as having a few transverse cracks and isolated spalled areas that had been patched with asphaltic material. During work to maintain the riding surface and replace deteriorated joints, the deck was overlaid with concrete overlays. The northbound lanes shown in figure 17, received a LMC-III overlay and the southbound lanes shown in figure 18, received a SFC overlay.
Northbound Lanes – Materials for the LMC-III mix consisted of: Type III cement; a subangular to rounded natural sand consisting of a mixture of siliceous and calcareous minerals having a specific gravity of 2.60, absorption of 1.40 percent, and fineness modulus of 2.56; and a crushed limestone coarse aggregate having a maximum topsize of 12 mm (0.5 inch) with a specific gravity of 2.71 and an absorption of 0.6 percent. The latex used was DPS Modifier A, a styrene-butadiene latex emulsion.
Southbound Lanes – A Type I cement was used in the SFC mix. Aggregates were from the same sources used for the LMC-III mix at this site. Admixtures included: Force 10,000 silica fume (slurry form); Darex II AEA, an organic-acid salt based air–entraining agent; and WRDA-19, a Type F high-range water reducing admixture. The mixture proportions and plastic concrete characteristics for both overlays, as reported in the C-206 report, are shown in table 32.
Figure 17. Photograph of I–265 northbound lanes with latex-modified overlay.
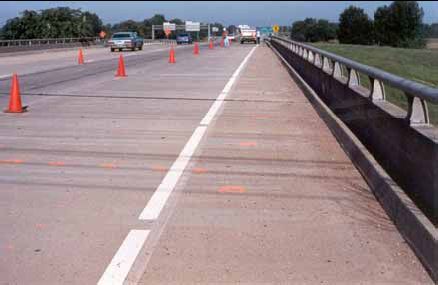
Figure 18. Photograph showing I–265 southbound lanes with silica fume concrete overlay.
| Material | LMC-III | SFC |
|---|---|---|
| Cement (lb/yd3) | 658 (Type III) | 658 (Type I) |
| Fine aggregate (lb/yd3) | 1708 | 1395 |
| Coarse aggregate (lb/yd3) | 1162 | 1531 |
| Water (lb/yd3) | 219 | 240 |
| Latex modifier (gal/yd3) | 24.5 | – |
| Silica fume (lb/yd3) | – | 50 |
| HRWRA (oz/yd3) | – | 105 |
| AEA (oz/yd3) | – | 39 |
| W/C ratio | 0.33 | 0.34 |
| Air content (percent) | 5.5 | 6.5 |
| Slump (inches) | 5.0 | 6.0 |
| Temperature (°F) | 79 | 82 |
| Unit weight (lb/ft3) | 144.0 | 143.8 |
| Placement date | 6/08/92 | 6/29/92 |
| Weather conditions | Clear | Clear |
| 1 lb/yd3 = .347 kg/m3 1 gal/yd3 = 5 l/m3 1 oz/yd3 = .037 kg/m3 |
1 inch = 25.4 mm (°F - 32/1.8) = °C 1 lb/ft3 = 16 kg/m3 |
The Kentucky Department of Highways (KYDOH) specifications on fresh properties of LMC-III include a range of slump from 100 to 150 mm (4 to 6 inches) and an air content not to exceed 7 percent. Specifications for SFC mixes include a slump range of 100 to 178 mm (4 to 7 inches) and an air content range of 5 to 8 percent. As required by the State specifications, the placements took place at night to prevent the hot conditions typically seen during the daytime of the summer months. The LMC-III overlay was placed on June 8, 1992 using two mobile concrete mixers. The water used to pre-wet the deck was noted in inspector diaries to be "excessive" with some water remaining at the bottom of deeply-excavated areas at the time of placement. The surface was textured with a stiff-broom finish. The surface was covered with wet burlap and polyethylene film immediately following the finishing, although no soaker hoses were used. The curing was removed after 24 hours, and no further curing was applied. The LMC-III overlay was opened to traffic two days after casting.
The concrete for the SFC overlay was placed on June 29, 1992 and was delivered using transit mix trucks. It was placed smoothly and without problems. The surface was finished in a similar manner to the LMC-III overlay. The curing was also similar to that of the LMC-III overlay, except that the wet burlap and polyethylene was maintained on the concrete for 72 hours. Although soaker hoses were not used at the site, the burlap was wetted at the start of each day of curing. The SFC overlay was opened to traffic 13 days after casting.
The northbound and southbound structures are not identical. The northbound structure LMC-III is wider, carrying a merge area across the bridge. Due to the extreme difficulty in closing the northbound travel lane through the merge area, the test section was set up in the shoulder and merge area, and it does not receive "main line" traffic exposure.
The underside of the structure was inspected annually while the traffic control was being set up on the lanes above. The southbound SFC span sits on only seven simple-span girders, and it does not carry a merge lane. The girders were noted to be somewhat rusty and the underside of the bridge exhibited occasional transverse cracks, some with efflorescence. The joints on the edges of the structure exhibited cracking and delamination with exposed bars. The bearing blocks under the rocker bearings were cracked and spalled.
The deck of the structure was inspected visually for appearance and performance. In 1994, the southbound SFC deck had several areas of concentrated "spidery" cracks, with Span 1 appearing worse than the other spans. The cracks were a mix of longitudinal and transverse cracks, and were concentrated primarily in the travel lane. In 1998, the cracking had become more noticeable and was generally more severe in the travel lane than the shoulder. Span 1 had the most severe cracking with some located in the shoulder as well as the travel lane. In all three spans, the cracking is more severe in the wheel paths. Most of the cracking is longitudinal with some shorter transverse cracking. The crack widths of the major cracks range from 0.127 to 0.381 mm (0.005 to 0.015 inches).
The northbound structure LMC is wider than the southbound structure, carrying a merge area across the bridge. Because of the merge area, the northbound traffic on the south side of the bridge was brought into one lane, into which the on-ramp traffic was merged. Because of these traffic control requirements, the test section was set up in the shoulder and merge area, and does not receive "main line" traffic exposure. The initial inspection in 1994 showed narrow cracks, many of which had healed by 1998. Cores showed cracks about 6 mm (0.25 inch) deep. The inspection in 1998 showed the overlay to be in good condition. There were several rough surface areas both in the shoulder and the merge lane but very little cracking. There were occasional short transverse and longitudinal cracks but no major cracks. The condition of the latex modified concrete overlay is much better than the silica fume concrete overlay but this is partly because the latex-modified overlay test section is subjected to a lesser amount of traffic.
The chain drag and hammer survey techniques were used to locate and delineate areas of delamination of the overlay concrete from the old concrete deck. Delaminations were found mostly at crack locations. The number and total area of delaminations on the I–265 bridge are shown in tables 33 and 34. The southbound SFC spans have many more delaminations, both in number and area, than the northbound LMC spans.
| Year | No. Areas | Total Area (m2) |
Percent of Total Area |
|---|---|---|---|
| 1994 | 0 | 0.00 | 0.00 |
| 1995 | 11 | 1.48 | 0.33 |
| 1996 | 25 | 7.75 | 1.71 |
| 1997 | 45 | 13.33 | 2.95 |
| 1998 | 60 | 20.20 | 4.47 |
| Year | No. Areas | Total Area (m2) |
Percent of Total Area |
|---|---|---|---|
| 1994 | 0 | 0.00 | 0.00 |
| 1995 | 2 | 0.18 | 0.05 |
| 1996 | 6 | 0.97 | 0.25 |
| 1997 | 13 | 1.62 | 0.42 |
| 1998 | 17 | 3.46 | 0.90 |
Of the southbound spans, the first span on the approach end of the bridge has the most severe delaminations of the three spans. Also, most of the delaminations are located in the travel lane and not in the shoulder areas. For the northbound structure, almost all of the delaminations are located in the center span. The areas of the two test sections are different because the northbound section tapers at the end where the merge lane ends. The area of the southbound SFC section is 452 m2 (4,860 ft2) and the area of the northbound section LMC is 384 m2 (4,130 ft2). Tables 33 and 34 show the percentage of the total area delaminated is 4.47 percent for the southbound sections SFC and 0.90 percent for the northbound LMC section. The southbound section appears much worse than the northbound but still has moderately little delaminated area and also has much more traffic than the northbound section.
The potential survey test grid on the southbound SFC bridge was marked using a 0.6-m (2-ft) grid beginning at the approach end of each span. Each span was numbered independently. The transverse rows were numbered from 1 to 25 and 1 to 68 from the approach side to the leave side, for the end and center spans, respectively. The longitudinal rows were lettered A to K, with the A-line placed along the paint stripe separating the travel lane from the passing lane. In the survey from 1994, the half-cell potential readings ranged from approximately +50 mV to –414 mV, with large potential differences between nearby areas. These readings tend to indicate that some limited corrosion is taking place in the bridge. Span 1 appeared to have the most corrosion activity, with rapid potential changes noticeable between nearby areas and an average potential reading of –211 mV. Span 2 had the highest (most negative) potential reading but also the lowest average potential reading of –136 mV. Span 3 had an average potential reading of –191 mV.
In 1997, the half–cell potentials ranged from +265 mV to –600 mV. Span 1 again had the highest average potential reading of –207 mV. Span 2 again had the highest potential reading at –600 mV and the lowest average reading at –149 mV. Span 3 had an average potential reading of –160 mV. Tables 35 and 36 give the cumulative frequencies of the half-cell potentials for the southbound test section of I–265 for 1994 and 1997, respectively. In 1994, over 85 percent of the readings were less negative than –250 mV. In 1997, over 86 percent of the readings were less negative than –250 mV. A histogram of the half-cell potential readings for the southbound test section in 1994 and 1997 is shown in figure 19.
| Potential Range (mV) |
Number of Observations |
Cumulative Percentage |
|---|---|---|
| 0 to –49* | 54 | 4.1 |
| –50 to –99 | 259 | 23.5 |
| –100 to –149 | 312 | 46.9 |
| –150 to –199 | 272 | 67.3 |
| –200 to –249 | 244 | 85.6 |
| –250 to –299 | 128 | 95.2 |
| –300 to –349 | 50 | 99.0 |
| –350 to –399 | 10 | 99.8 |
| –400 to –449 | 2 | 100.0 |
| –450 to –499 | 0 | 100.0 |
| –500 to –549 | 0 | 100.0 |
*Note. Any positive reading is counted as 0 for tabulation.
| Potential Range (mV) |
Number of Observations |
Cumulative Percentage |
|---|---|---|
| 0 to –49* | 53 | 4.0 |
| –50 to –99 | 215 | 20.1 |
| –100 to –149 | 355 | 46.6 |
| –150 to –199 | 323 | 70.7 |
| –200 to –249 | 212 | 86.5 |
| –250 to –299 | 113 | 94.9 |
| –300 to –349 | 48 | 98.5 |
| –350 to –399 | 17 | 99.8 |
| –400 to –449 | 1 | 99.9 |
| –450 to –499 | 1 | 100.0 |
| –500 to –549 | 0 | 100.0 |
*Note. Any positive reading is counted as 0 for tabulation.
Figure 19. Histogram of half-cell potential readings for I–265 southbound SFC test section.
The 0.6-m (2-ft) grid for the northbound LMC spans was started at the approach side of the bridges. The transverse rows of points were numbered from 1 to 25 and 1 to 69 on the end and center spans, respectively. The longitudinal were lettered A to K, beginning at the paint stripe between the travel and passing lanes. Due to tapering of the merge lane across the bridge, row H was the last row at the leave end of the bridge. The half-cell potential for the northbound test section in 1994 readings ranged from +59 mV to –356 mV, with the more negative potentials occurring primarily at the joints. In 1994, span 3 had the highest average potential reading at –102 mV.
Span 2 had the highest individual reading at –356 mV but had an average reading of only –65 mV. Span 1 had an average potential reading of –55 mV. In 1997, span 3 again had the highest average potential reading at -86 mV but also had the highest individual reading at –352 mV. Span 2 had an average potential reading of –61 mV and span 1 had an average of –27 mV. Tables 37 and 38 show the cumulative frequency of the half-cell readings for the northbound spans in 1994 and 1997. A histogram of the half-cell potential readings for the northbound test section for 1994 and 1997 is shown in figure 20. In 1994 and 1997, approximately 98 percent of the readings were less negative than –250 mV. In areas away from the joints, the potentials were generally less negative than –100 mV, indicating that very little corrosion is taking place in the bridge.
Figure 21 shows an equipotential map of the half-cell readings for the southbound SFC test section for 1997. Spans 1 and 3 appear to have more isolated spots of corrosion (anodic) activity than the main span. An equipotential map of the half-cell potential readings for the northbound LMC test section for 1997 is shown in figure 22. The magnitude of the half-cell readings is much lower in the northbound LMC test section than in the southbound SFC test section. However, some anodic areas are present, mainly near the joints and in the main span.
| Potential Range (mV) | Number of Observations |
Cumulative Percentage |
|---|---|---|
| 0 to –49 | 494 | 46.1 |
| –50 to –99 | 317 | 75.7 |
| –100 to –149 | 134 | 88.2 |
| –150 to –199 | 74 | 95.1 |
| –200 to –249 | 33 | 98.2 |
| –250 to –299 | 15 | 99.5 |
| –300 to –349 | 4 | 99.9 |
| –350 to –399 | 1 | 100.0 |
| –400 to –449 | 0 | 100.0 |
| –450 to –499 | 0 | 100.0 |
| –500 to –549 | 0 | 100.0 |
| Potential Range (mV) | Number of Observations |
Cumulative Percentage |
|---|---|---|
| 0 to –49 | 626 | 60.0 |
| –50 to –99 | 226 | 81.6 |
| –100 to –149 | 98 | 91.0 |
| –150 to –199 | 45 | 95.3 |
| –200 to –249 | 32 | 98.4 |
| –250 to –299 | 14 | 99.7 |
| –300 to –349 | 2 | 99.9 |
| –350 to –399 | 1 | 100.0 |
| –400 to –449 | 0 | 100.0 |
| –450 to –499 | 0 | 100.0 |
| –500 to –549 | 0 | 100.0 |
Figure 20. Histogram of half-cell potential readings for the I–265 northbound LMC test section.
Figure 21. Equipotential maps of half-cell potentials of the three southbound spans SFC of the I–265 test section in 1997.
Figure 22. Equipotential maps of half-cell potentials of the three northbound spans LMC of the I–265 test section in 1997.
Polarization resistance tests were performed at five locations on the southbound SFC bridge in 1994. The test locations were chosen from low, moderate and high-potential areas. The PR tests were performed using a EG&G Princeton Applied Research Company (EG&G PARC) model 273A potentiostat under computer control. Simulated 3LP tests were also performed at each of the test locations. Only three of the five locations were successfully tested using the PR or the 3LP technique. The results of the testing are summarized in table 39.
| Grid Location |
Equilibrium Potential (mV)* |
PR Testing | 3LP Testing | ||
|---|---|---|---|---|---|
| Rp (ohm) |
Icorr (mA/cm2) |
Rp (ohm) |
Icorr(mA/cm2) | ||
| Span 1, I8 | –0.259 | – | – | 565 | 0.048 |
| Span 1, I28 | –0.231 | 254 | 0.085 | – | – |
| Span 2, G21 | –0.103 | 390 | 0.055 | 195 | 0.111 |
| Span 3, F10 | –0.199 | – | – | 76 | 0.286 |
| Span 3, E18 | –0.305 | 696 | 0.031 | – | – |
* Measured using a Cu/CuSO4 reference electrode
The corrosion rate measurements were variable and did not generally agree with the half-cell potential measurements, as some of the most negative potentials were associated with the lowest corrosion rates. The 3LP measurements indicated higher corrosion rates than the PR tests. The difficulties encountered may have been related to the high resistivity of the silica fume overlay concrete.
The PR and 3LP testing was only slightly more successful on the northbound LMC structure than on the southbound structure, with four of the six locations being successfully tested using either technique. This may have been due to the overall low corrosion rates observed on the structure, as very low corrosion rates are typically more difficult to measure than actively corroding areas. The results of the testing are summarized in table 40.
| Grid Location | Equilibrium Potential (mV)* |
PR Testing | 3LP Testing | ||
|---|---|---|---|---|---|
| Rp (ohm) |
Icorr (mA/cm2) |
Rp (ohm) |
Icorr (mA/cm2) |
||
| Span 1, C0 | –0.151 | 701 | 0.030 | 2400 | 0.009 |
| Span 1, EF4 | –0.119 | 325 | 0.067 | – | – |
| Span 1, D16 | –0.000 | – | – | – | – |
| Span 3, C18 | –0.163 | – | – | 281 | 0.077 |
| Span 3, C50 | –0.147 | 11300 | 0.002 | 1283 | 0.016 |
| Span 3, C47 | –0.122 | 8802 | 0.002 | 5021 | 0.004 |
* Measured using a Cu/CuSO4 reference electrode
In 1997, linear polarization measurements were performed on both spans at locations with high, medium, and low corrosion potentials. Because the southbound SFC structure appeared to have more corrosion activity occurring, the corrosion rate was measured at eight locations while only one location was measured on the northbound structure. The one location on the northbound test section was chosen because it was one of the few areas that had a higher negative potential. The testing was performed using a James Instruments GECOR 6 Polarization Resistance Tester and the results are shown in table 41. There is some scatter in the corrosion rate measurements. The corrosion rates vary from very low to moderately low. Some corrosion appears to be occurring in local areas but at low to moderate rates.
| Direction | Grid Location |
Half-Cell Potential (mV) |
Measured Corrosion Rate (µA/cm2) |
Notes |
|---|---|---|---|---|
| Southbound Travel SFC | E62 | –171 | 0.093 | Random half-cell |
| EF34 | –212 | 0.104 | Wheelpath | |
| EF31 | –329 | 0.157 | Moderate potential | |
| H20 | –211 | 0.154 | Moderate potential | |
| C20 | –124 | 0.054 | Low potential | |
| H12 | –334 | 0.061 | Negative potential | |
| E90 | –245 | 0.110 | Moderate potential | |
| EF130 | –243 | 0.114 | Delamination area | |
| LMC (NB) | F22 | –282 | 0.212 | Delaminated area |
Cores were taken from both test sections in 1994 and 1997. In the laboratory, the cores were examined to determine the overlay thickness and the cover over the uppermost reinforcing bars. The overlay thicknesses ranged from 32 to 50 mm (1.25 to 2.0 inches) and the observed clear cover over the reinforcing bars ranged from 64 to 95 mm (2.5 to 3.75 inches). In 1994, shear bond testing was performed on three cores from each test section. The test results are shown in able 42. The test result for one of the cores from the northbound test section was much higher than all the others. This is because the failure occurred completely in the overlay. Without this result, there is no appreciable difference in the bond strength of the cores from either test section. All the other cores failed mostly or completely in the base concrete.
| Overlay Type |
Core ID |
Bond Strength MPa (psi) |
Failure Location (percent of failure Overlay | ||
|---|---|---|---|---|---|
| Overlay | Bond Line | Substrate | |||
| Southbound | 1 | 3.4 (493) | 25 | 0 | 75 |
| Travel | 4 | 3.9 (570) | 30 | 0 | 70 |
| SFC | 8 | 2.9 (420) | 40 | 20 | 40 |
| Northbound | 1 | 5.7 (827) | 100 | 0 | 0 |
| Travel | 2 | 2.9 (424) | 10 | 0 | 90 |
| LMC | 3 | 4.0 (580) | 0 | 0 | 100 |
In 1997, four cores from the southbound travel lane and one core from the northbound travel lane were tested in shear. The results are shown in table 43. The bond strength of all the cores remains good and most failures occurred in the substrate or overlay concrete.
| Location and Overlay Type |
Core ID | Exposure Condition |
Bond Strength MPa (psi) |
|---|---|---|---|
| Southbound Travel LMC | 4 | Shoulder | 3.7 (540) |
| 5 | Centerline | 3.9 (570) | |
| 6 | Centerline | 4.4 (640) | |
| 7 | Wheel path | 3.9 (560) | |
| Average | 4.0 (578) | ||
| Northbound Travel SFC | 4 | Wheel path | 3.2 (460) |
Following the visual examination of the cores, chloride analyses were performed on six cores from each overlay taken in 1994. The samples were taken from the 25- to 50-mm (0.5- to 1-inch) depth surface region and from the 75- to 95-mm (3- to 3.75-inches) depth where the reinforcing bars would have been located. All of the slices were then pulverized and analyzed to determine their acid-soluble chloride content. In addition to the acid-soluble chloride analyses, water-soluble chloride analyses were performed on selected samples. The results of the testing are shown in table 44.
| Overlay Type |
Sample Number |
Acid-Soluble Chloride Content, percent by concrete weight |
Water-Soluble Chloride Content, percent by concrete weight |
||
|---|---|---|---|---|---|
| 0.5 to 1 inch |
3 to 3.75 inches |
0.5 to 1 inch |
3 to 3.75 inches |
||
| Southbound Travel SFC |
S 2A | 0.031 | 0.117 | 0.015 | 0.065 |
| S 5 | < 0.007 | 0.018 | – | – | |
| S 6 | – | < 0.007 | – | – | |
| S 7 | 0.010 | 0.095 | – | – | |
| S 9 | – | 0.040 | – | – | |
| S GRND | – | 0.065 | – | – | |
| Northbound Travel LMC-III |
N 1 | – | 0.027 | – | – |
| N 5 | 0.019 | 0.034 | 0.011 | 0.017 | |
| N 7 | 0.039 | 0.034 | 0.018 | 0.018 | |
| N 8 | 0.010 | 0.080 | – | – | |
| N GRND 3 | 0.016 | – | – | – | |
| N X | – | 0.039 | – | – | |
All of the locations had moderate to low chloride concentrations at the level of the reinforcing bars. The water-soluble chlorides were considerably lower than the acid-soluble results. The approximate threshold for chloride-induced corrosion of black reinforcing steel is approximately 0.025 percent by concrete weight, so only some of the locations in the deck appear to have sufficient chloride to support corrosion. In 1998, one core from each test section was analyzed for chloride. The chloride was measured at four depths as shown in table 45.
| Location and Type Overlay |
Acid-Soluble Chloride Content, percent by weight of Location and concrete | |||
|---|---|---|---|---|
| 0.25 to 0.5 inch |
0.625 to 1 inch |
1.125 to 1.5 inches |
3.75 to 4 inches |
|
| Southbound Travel SFC |
0.110 | 0.045 | 0.100 | 0.021 |
| Northbound Travel LMC |
0.077 | 0.047 | 0.151 | 0.076 |
The chloride levels at the reinforcing bars are similar to those in 1994. Some chloride has penetrated into the near surface of the overlays and to a depth of 25 to 50 mm (0.5 to 1 inch). Elevated chloride levels are present at the 28 to 38 mm (1.125 to 1.5 inches) level likely due to chloride contamination in the original deck surface.
The SFC and LMC-III overlays were placed in June 1992. The SFC test section carries main line traffic while the LMC-III test section carries a shoulder and merge lane. The SFC overlay has developed progressive cracking with cracking being most severe in the wheelpaths. Delaminations have increased with time and 4.5 percent of the overlay was delaminated in 1998. The LMC-III overlay test area has much less cracking and few delaminations, 0.9 percent in 1998, however, it does not handle main line traffic.
The half-cell potential data had values more positive than –250 mV (noncorrosive) for 86 percent of the measurements on the SFC overlay and 98 percent of the measurements on the LMC overlay. These percentages did not change between 1994 and 1997. Local anodic locations were present for both overlays. The corrosion rates tended to be low with some areas being moderate to low. The bond of the overlays, away from delaminations, remained high over the test period. Chloride has penetrated into the surface of the overlays and some chloride was present in the near surface of the existing substrate concrete. The chloride content at the level of the reinforcing steel remains low to moderately low.

