U.S. Department of Transportation
Federal Highway Administration
1200 New Jersey Avenue, SE
Washington, DC 20590
202-366-4000
Federal Highway Administration Research and Technology
Coordinating, Developing, and Delivering Highway Transportation Innovations
 |
| This report is an archived publication and may contain dated technical, contact, and link information |
|
Publication Number: FHWA-RD-97-146 Date: NOVEMBER 1997 |
Previous | Table of Contents | Next
7.1 PASTE
It is necessary to calculate, estimate, or determine microscopically the percentage of air-free paste in an HCC specimen in order to calculate the specific surface and the spacing factor by means of the equations in ASTM C 457 (see Chapter 6).
7.1.2.1 Calculation from Design of Mixture
When the design of the mixture is known and it is fairly certain that all additions of water or other changes in the mixture have been properly documented, the percentage of paste can be calculated from the design of the mixture by adding the volumes of water, cement, and particulate admixtures and determining the percentage this total of paste components is of the total volume of HCC produced by the mixture (ACI 211.1; ACI 211.2; ACI 211.3).
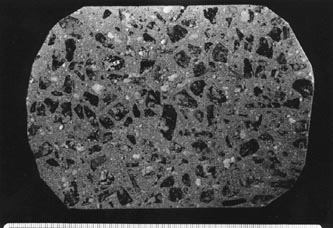
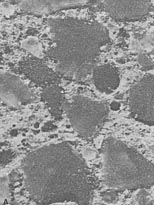
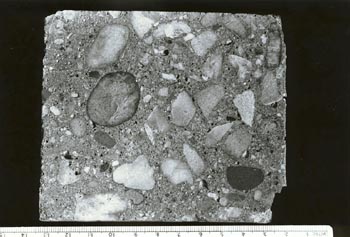
Slight variations in paste content used in the calculations of air-void parameters do not cause much change in the values obtained. Therefore, at VTRC, for ordinary intradepartmental work, for preliminary work, and whenever the accuracy of the spacing factor and specific surface is not required to be defended against opposing expert witnesses, the paste content is estimated. The normal range of paste content is 23% to 32%; 27% has often been used as a good estimate of paste content in normal concrete (ACI 2111; ACI 211.3; ACI 221R). This figure should be weighted by the judgment of the petrographer of the appearance of the specimen (see Fig. 7-1). If the quantity of paste appears to be far from normal (see Fig. 7-2), a microscopical determination of the percentage of paste should be made. If an estimate is to be used, the calculations may proceed and the data and method recorded in the notes for the report.
7.1.2.3 Microscopical Determination
The amount of air-free paste present is most easily determined by making a microscopical determination (linear traverse or point count) of the amount of aggregate present. The aggregate occurrence (sum of aggregate chords or sum of points falling in aggregate) is calculated by dividing by the total (total traverse length or total number of points) to determine the percentage of aggregate. Most laboratories using point-count equipment perform paste content determinations concurrently with the air content determinations; therefore, separate paste determinations are
 |
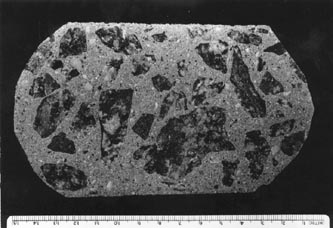 |
Figure 7-1 FINELY LAPPED SLICES OF CONCRETE WITH NORMAL PASTE CONTENT. Actual size. A. Rounded quartz gravel coarse aggregate and sand fine aggregate. B. Angular crushed granite coarse aggregate and sand fine aggregate.
 |
|
Figure 7-2 FINELY LAPPED SLICES OF CONCRETE WITH NONSTANDARD PASTE CONTENT. Actual size. A. High paste content. The coarse and medium-sized aggregate is a fine grained metamorphosed shale, and the fine aggregate is a quartzitic sand. B. Low paste content. The coarse aggregate is a granitic gneiss, and the fine aggregate is a river sand.
most often performed with linear traverse equipment. The percentage of paste is determined by subtracting the percentage of aggregate and the percentage of air from 100%.
To obtain the same accuracy in a microscopical determination of the aggregate as that of the air voids, at least 1,000 occurrences (fragments) of the aggregate must be counted (point count) or measured (linear traverse). To determine the percentage of a substance of which there are only 200 occurrences in the traverse of the surface on which the percentage of air was determined, five such slices would have to be prepared and examined. Examining such a large number of surfaces is often economically impossible, and unless the air-void determination included these surfaces, the air content determined may not be relevant to the paste content. When there are fewer than 1,000 aggregate particles along a microscopical traverse, the percentage of paste or aggregate determined should be considered an estimate.
At VTRC, we find that paste can be distinguished from aggregate on the basis of color, luster, internal structure, and the sort of surface produced by the lapping procedures. However, we have seen aggregate particles that so closely matched the paste in color and luster and finely lapped texture that it was possible to miss small corners of coarse aggregates and fragments of sand and be quite uncertain about the exact location of the boundary between these phases. Strangely enough, carbonate aggregate is usually distinguishable by color, luster, translucency, and crystal structure. It is usually the light brown to creamy gray quartz pebbles and sands that are the most difficult to distinguish from paste.
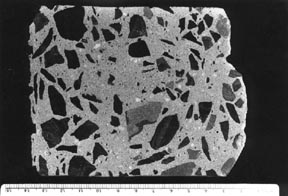
When aggregate particles are lapped in a slice of concrete, they are leveled off to the level of the paste and a fine-matte surface is produced on the aggregate surface remaining in the slice of concrete (see Fig. 7-3). This matte surface will be a little different for each lithology of the aggregate in the surface, but it is generally sufficiently different from a broken surface or a natural water-worn surface of the type of aggregate for a technician to be able to distinguish a matte-lapped surface from all others. Because of the higher capillarity of the paste and greater hardness of the aggregate, the matte surface on an aggregate particle is usually quite different from the surface of finely lapped paste. The lower the water-cement ratio, the denser the paste becomes and the more the lapped surface on the paste becomes like the lapped surface on the aggregate. When the problem of distinguishing paste from aggregate becomes difficult, the differences in solubility in weak acid or the differences in porosity indicated by dye absorption can be used to differentiate between aggregate and paste.
The problem cannot be solved by adhering to such statements such as: "The paste content calculated from the known mixture proportions is approximately 12 percent higher than the one obtained from the ASTM C 457 measurements" (Pleau et al., 1990). Pleau et al. called this sort of error "an unavoidable artifact of the measurement process." In their work, no effort seems to have been made to enhance the paste-aggregate boundary and lessen their error. They used the point-count method, determining paste concurrently with the analysis of the air content. They explain the difference between their mixture proportion and their point-count results by stating that there are errors made in determining the proper outlines of aggregates when the aggregate occurs close to the surface being examined. In their specimens, the paste seems to be more translucent than in our specimens. Reportedly, their operators frequently see through the paste and count an aggregate particle be
 |
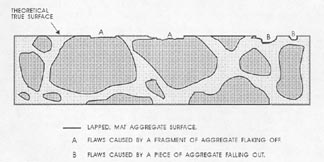 |
Figure 7-3 FLAWS IN PASTE. Illustrates the type of flaws caused by aggregate that is fragile and recognizable by the broken aggregate surface (marked A) and the type of flaw caused by complete or nearly complete loss of an aggregate particle (marked B) and recognizable by the shape of the cavity remaining and the texture of the paste surface within the cavity.
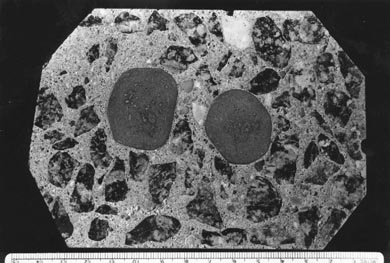
Figure 7-4 KNOTS OF CEMENT EXPOSED ON FINELY LAPPED SLICE. Actual size. The rounded shape is caused by tumbling in the mixer.
Also, they have occurrences of discolored portions of the paste that appear to be aggregate particles and become counted as such.
Other than the dark blue-green blotchy appearance often seen in pastes containing GGBFS, the only such "discolorations" seen in the VTRC laboratory have, when studied in thin section, been determined to be lumps of cement (see Fig. 7-4) caused by either exposure of the cement to moisture during storage or an improper mixing sequence. In retempered concrete (see Appendix D), some of the aggregate may have coatings of dense, partially hydrated cement. Obviously, counting a cement lump or coating as aggregate in the point-count method will decrease the ratio of paste to aggregate determined. Although Pleau et al. (1990) found a consistent 12% shortage in the microscopically determined paste content in the laboratory-mixed specimens they used, they did not present any evidence that indicates that all paste contents determined microscopically should be increased by such an amount.
The percentage of paste is determined in six steps, as listed in Table 7-1.
1. Etch the slice if necessary. Determine if etching the slice will enhance the visibility of the boundary between the aggregate and the paste. Test etchings can be performed by dropping a small quantity of acid on companion surfaces or even on the slice under examination. Most users of point-count or image analysis equipment make the paste determination concurrent with the air-void determination and forgo the greater definition of boundaries available by etching. When the color of the paste and the aggregate match and the lapped surfaces are similar, the determination of the exact boundaries between aggregate and paste is very difficult. If the results of the determination will have to be presented as legal evidence and perhaps
Table 7-1 PROCEDURE-DETERMINING PERCENTAGE OF PASTE
1. Etch the slice if necessary.
2. Examine the etched slice, and become familiar with the way the paste and aggregates reacted to the acid.
3. Prepare to recognize the true lapped surface of the aggregate.
4. Survey the slice to become familiar with any features that could cause confusion.
5. Perform the microscopical determination of the amount of aggregate in the slice.
6. Calculate the percentage of paste.
questioned by opposing expert witnesses and sufficient specimen material is available, VTRC subjects the specimen surface to a very short etch (see 5.2.3) so that the exact aggregate-paste boundaries can be distinguished by the different solubilities of the phases in the dilute acid. Avoid etching the specimen to determine an accurate paste percentage unless sufficient slices can be obtained so that the slice etched will not have to be used for other purposes and an unetched slice will remain available for archival purposes.
At VTRC, we find it more accurate and efficient to perform a count of a single substance at a time and almost always etch the surface before performing a paste determination.
| CAUTION: Perform the etch procedure after the air-void determinations have been made because the acid will round off the void edges and make the voids appear larger Therefore, if an acid etch is to be used, determining the paste content must be a separate procedure from the air-void determination. |
2. Examine the slice, and become familiar with the manner in which the paste and the various lithologies of aggregate reacted to the lapping and the acid. Usually, the paste is more soluble than the aggregate and is etched down to a lower level (see Fig. 7-5A). Occasionally, there may exist pieces of pure calcite in the aggregate. Calcite itself is much more soluble in weak HCl than concrete paste and will be dissolved away to an even lower level. Thus, there exists a solubility difference, and the boundary can be distinguished. Unless the aggregate rock used is exceptionally rich in pure calcite, this should not occur often. Impure carbonate (calcitic and dolomitic) rocks are not removed to such a great extent. The pyrites, clays, and other minerals included in the more complex carbonate rocks remain at the level to which the specimen was lapped even if a layer of the carbonate is removed (see Fig. 7-5B).
3. Prepare to recognize the true lapped surface of the aggregate as distinguished from any broken or water-worn natural gravel aggregate surfaces. Whether the paste determination is made on a flat lapped surface or an etched surface (whether the quantity of paste is determined at the same time as the quantity of voids or not), think clearly about the fact that the matte surface on the aggregate is the portion of the aggregate that exists on the plane on which the determinations are being made. Other surfaces of the aggregate will have a natural broken or water-worn surface. Figure 7-3 illustrates (1) the type of flaws caused by aggregate
 |
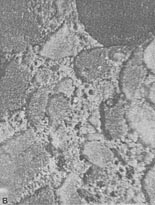 |
Figure 7-5 ETCHED SLICES. A. Etched surface on a concrete fabricated with quartz sand fine aggregate. B. Etched surface on a concrete fabricated with crushed limestone fine aggregate.
that is fragile and recognizable by the broken aggregate surface and (2) the type of flaw caused by the complete or nearly complete loss of an aggregate particle and recognizable by the shape of the cavity remaining and the texture within the cavity. These flaws are not a common occurrence, but when present, a mental reconstruction of the surface will usually indicate that they should be counted as aggregate. If these flaws are common and a mental reconstruction of the true surface does not indicate the proper location of the boundaries between paste and aggregate, the slice should be refinished or replaced with one of better quality. For highest accuracy, the air-void determination should be made on the better prepared slice. In cases other than the flaws indicated in Figure 7-3, refrain from recognizing as aggregate any area that is below the finely lapped surface. If a part of the aggregate that should be covered with paste is exposed, count such areas as paste. If the paste surface has been removed from over an aggregate surface (chipped off or etched off), the aggregate particle will not exhibit the finely lapped matte surface of the properly exposed aggregate particle and it is likely that at a magnification of 100X (or larger) there will be a decided difference in the location of the planes of focus between the true lapped surface and any aggregate surface beneath. This difference in focus (which must be adjusted for if the surface is to be kept in focus) should alert you to the fact that you are viewing a surface that is further from the objective lens than was the surface on which the focus was originally located.
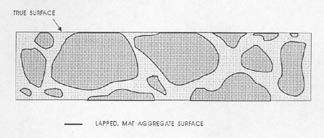
None of these problems should cause errors if you think clearly about the view seen and mentally reconstruct the view that would be seen if the paste area on the lapped surface accurately indicated the true proportion of paste present. Avoid errors by allowing sufficient time for the analysis. Figure 7-6 illustrates some of the flawed and etched artifacts that may be observed in surfaces during the microscopical
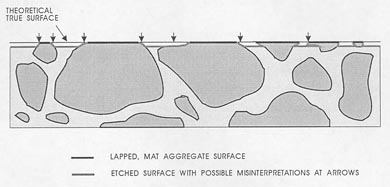
Figure 7-6 CROSS SECTION OF SURFACE DEMONSTRATING PROBLEMS OF BOUNDARY DISTINCTION. This is an acid-etched surface that shows the need for counting as aggregate only the matte-lapped surface of the aggregate.
determination of the paste-aggregate ratio. These surfaces are different from the undercut surfaces discussed in 5.2.1 (see Fig. 5-1). The undercut surfaces have a somewhat similar high relief, but the features are rounded and there is no way a mental reconstruction of the surface will yield a good estimate of the position of the paste-aggregate boundary. Undercutting must be overcome by proper surface preparation.
4. Survey the slice and become familiar with any portions of the paste that could be mistaken for aggregate because of coloration, carbonation, or other factors. Paste that is dark because of concentrations of unhydrated cementor GGBFS or paste that has been carbonated and therefore not etched as deeply as the surrounding paste will not have a lapped matte surface as the aggregate particles do. Although the calcite in carbonated areas is soluble in HCl with effervescence, these areas are seldom etched as deeply as uncarbonated paste. The calcite is completely dissolved, but usually there remains a porous layer of material that is not soluble in the acid and is often as high as was the original lapped surface. It appears that the siliceous components of the uncarbonated paste are more soluble than the siliceous portion of the carbonated paste.
5. Perform the microscopical determination of the amount of aggregate in the surface. With the exception of the kinds of flaws shown in Figure 7-3, be careful to count as aggregate only those portions of the aggregate that were at the surface when the air-void determination was made, i.e., the high matt-lapped surfaces of the aggregate.
6. Calculate the air-free percentage of paste according to the following formula:
% Paste = 100% - (% Aggregate + % Air voids).
7.2 AGGREGATE AND OTHER SUBSTANCES
The percentage of a specific type of aggregate or other substance should be determined when deemed important by the client or the petrographer. Any substance that can be recognized when seen on the surface of the slice as being composed of a particular material can be counted by point-count or measured by linear traverse equipment and an estimated volume percentage of the substance determined. The accuracy of such determinations is dependent on the frequency of occurrence of the particles of the substance, as discussed in 7.1.2.
Substances cannot be distinguished on the basis of size. It is possible to know only that the cross section exposed of an object indicates that the object is large enough to have the particular cross section. The object may be much larger.
Occasionally, the petrographer is requested to determine the relative amounts of coarse aggregate and fine aggregate. If there is a distinct lithologic difference between the two (e.g., a fine-grained greenstone coarse aggregate and quartz sand fine aggregate), an estimate of the percentage of each can be made using point-count or linear traverse equipment. If there is no readily recognizable lithologic difference (most often the case when crushed limestone is used for the fine as well as the coarse aggregate), it is impossible to make a percentage determination of the relative amounts of these materials by readily available optical methods (see 12.3). Calculation of diameters from chords such as that of Lord and Willis (1951) that are dependent on the spherical shape of the item measured cannot be used for aggregate particles. The distinction cannot be made on the size of the area of the particle exposed on the lapped surface because a piece of coarse aggregate may be almost hidden, with only a tiny corner showing. At present, the only method available is the removal of the paste with an acid and the sieve analysis of the aggregate. An acid that attacks the aggregate cannot be used. Limestone is usually soluble in acid.
An experienced petrographer will usually be able to tell by comparison with other specimens of concrete if an unusual amount of either coarse or fine aggregate is present. The original design of the mixture should indicate the sizes intended to be used (see Fig. 7-7).
If the petrographer feels that the aggregate is not sized according to the intended grading, an investigation of the sizes of the materials in the stockpiles can be made. If the sizes in the stockpiles are within specification, the problem may be in the proportioning of the aggregates during fabrication of the concrete mixture.
 |
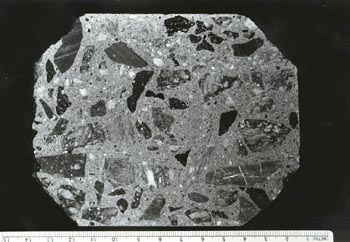 |
Figure 7-7 VARYING AMOUNTS OF AGGREGATE SIZE FRACTIONS. Actual size. A. Concrete fabricated without larger sizes of coarse aggregate. B. Concrete fabricated with coarse aggregate that is larger than is now normal for bridge deck concrete.

