U.S. Department of Transportation
Federal Highway Administration
1200 New Jersey Avenue, SE
Washington, DC 20590
202-366-4000
Federal Highway Administration Research and Technology
Coordinating, Developing, and Delivering Highway Transportation Innovations
 |
| This report is an archived publication and may contain dated technical, contact, and link information |
|
Publication Number: FHWA-RD-98-171 Date: FEBRUARY 1999 |
Introduction |
|
The validity and defensibility of a performance-related specification (PRS) depends on the accurate identification and prediction of pavement performance. Pavement performance is described in terms of distress indicators (i.e., transverse cracking, transverse joint faulting, transverse joint spalling, and pavement smoothness). The implementation of a PRS requires considerable knowledge of how these distress indicators develop over time, as well as the construction and material acceptance quality characteristics (AQC’s) that influence them. One goal of this research study was to establish new (or improve existing) distress indicator prediction models associated with the AQC’s to be included in the PRS for jointed plain concrete pavements (JPCP). Each of these prediction models must be associated with one or more AQC’s that are measurable and under the control of the contractor.
A comprehensive literature search was conducted to identify previous studies in which the effects of concrete pavement AQC’s (construction- and material-related) on pavement performance were documented. The information was evaluated so that the present investigation could target those AQC’s for which the effect on pavement performance had not been well-documented. To establish additional information on the relationship of quality level to pavement performance, a field testing program was developed for the identified AQC’s. A comprehensive work plan was developed and carried out during this study.
A discussion of the sampling and testing procedures, as well as a review of the results of the field/laboratory investigations for each of the targeted AQC’s, is provided in this appendix.
In general, data for model development were collected from projects investigated during the variability portion of this research study. A summary of the information collected at each of the projects is shown in table 66.
|
Project |
Model/AQC Studied |
|||||||||
|---|---|---|---|---|---|---|---|---|---|---|
|
Strength Prediction Model |
Spalling Model |
Faulting Model |
Cracking Model |
|||||||
| 3-day Cyl. Compressive | 3-day Core Compressive | 3-day Cyl. Splitting Tensile | 3-day Core Splitting Tensile | Entrained Air Content | Joint Edge Spalling | Consolidation Around Dowels | Load Transfer Efficiency | Tie Bar Depth | Load Transfer Efficiency | |
| Meade, KS—Meade Municipal Airport |
Ö |
Ö |
Ö |
Ö |
||||||
| Shewano, WI—Route 29 East |
Ö |
Ö |
Ö |
Ö |
||||||
| St. Johns, MI—Route 27 North |
Ö |
Ö |
Ö |
Ö |
||||||
| Ottumwa, IA—Route 23 South |
Ö |
Ö |
Ö |
Ö |
||||||
| Des Plaines, IL—Route 58 West |
Ö |
Ö |
Ö |
Ö |
||||||
| Benton Harbor, MI—I-94 West |
Ö |
Ö |
Ö |
Ö |
||||||
| Philo, IL—Route 130 South |
Ö |
Ö |
Ö |
Ö |
||||||
| Omaha, NE—I-80 East & West |
Ö |
Ö |
||||||||
Prediction of 28-day Flexural Strength
The prototype PRS recommends using core testing as an indirect measure of in situ flexural strength.(1,2,3) Cores are taken at some reference maturity equivalent (for example, 3 days at 22 °C). The mean compressive or splitting tensile strength of the cores from each sublot is adjusted to a 28-day strength under standard laboratory-cured conditions. This equivalent mean 28-day compressive or splitting strength is then converted to a third-point loading flexural strength using an approved interstrength relationship developed (prior to construction) from the specific concrete mixture and project-approved aggregates, cement, and admixtures used during construction. The procedure was roughly outlined in the previous PRS study and evaluated during the prediction variability portion of this investigation, as described in appendix D of this report.(1,2,3) The developed prediction procedure is necessary because the concrete fatigue model used in the PRS is based on 28-day, standard cure flexural strength.
The effects of flexural strength on fatigue life performance are well-documented in the literature. Therefore, while no further field investigations of the effects of flexural strength on pavement performance were performed during the current project, a laboratory study was completed to better explore the errors associated with estimating a 28-day standard cure flexural strength from early age strengths.
Testing Procedure.
The previous PRS study compared core and cylinder compressive strength tested at ages of 7, 14, and 28 days for specimens cured under identical curing conditions.(1,2,3) The study concluded that there is no statistical difference between core and cylinder compressive strengths at any of the three investigated maturities. However, the study did not include data from specimens tested at an equivalent 3-day standard laboratory maturity. Therefore, additional laboratory testing was performed to establish whether there is a statistical difference between 102-mm diameter core and 152-mm diameter cylinder compressive and splitting tensile strength at 3 days. Different coarse aggregate types and cements were sampled from each of the four projects used for the strength prediction model study (see table 66). Each coarse aggregate was used with two cement contents to give a total of eight mixes. The concrete mixes were batched in accordance with the American Society for Testing and Materials (ASTM) C 192, Standard Practice for Making and Curing Concrete Test Specimens in the Laboratory. Similar to the previous PRS study, 12 cylinders were cast for each mix and moist-cured for 3 days. Six cylinders were cored just before testing. The core lengths were trimmed to meet the required length-to-diameter ratio of 2 to 1 established by ASTM C 42, Standard Test Method for Obtaining and Testing Drilled Cores and Sawed Beams of Concrete. Along with this standard, strength testing was performed in the laboratory in accordance with the following ASTM specifications:
Compressive strength (three cores and three cylinders) and splitting tensile strength (three cores and three cylinders) were determined on concrete made from the same batch and cured under identical conditions. In addition to the laboratory data collected, results of field samples obtained during the variability investigation were also summarized. For some of the field projects evaluated, cylinders were cast and cored to obtain a cylinder-to-core relationship. Because curing conditions were identical, the relationship is similar to the lab study. In addition, cores were drilled from the field pavement at some sampling locations. Because the variability of this relationship is slightly increased due to inconsistencies between specific batch constituents, the average cylinder and core strengths were evaluated and presented.
Summary of Strength Results
The results of the cylinder-to-core relationships are plotted in figures 73 and 74 for the compressive and splitting tensile strength data, respectively. On each graph, the best-fit linear equations are also presented. As described in the previous section, relationships were made between cylinders and cored cylinders, cylinders and cored slabs, and overall data sets. All three equations are given in the figures.
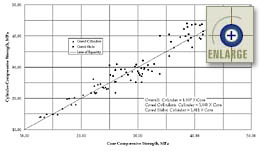 |
Figure 73. Results of the cylinder compressive strength versus core compressive strength study. |
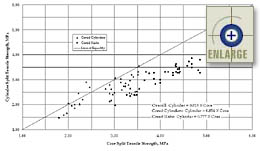 |
Figure 74. Results of the core split tensile strength versus cylinder split tensile strength study. |
In the previous PRS study, it was concluded that there is no significant difference between core and cylinder compressive strengths, irrespective of mix design, coarse aggregate hardness, and coarse aggregate geometry.(1,2,3) Since the data again appear to be clustered around the line of equality (1 to 1), paired t-tests were done to determine if there is a statistically significant difference between matched pairs of core and cylinder compressive strengths. Two-tailed t-tests were performed on data sets of 44 cored cylinders, 44 cored slabs, and 88 overall pairs. In the analyses, the t-values were calculated to be -0.049, -0.222, and -0.099 for the cored cylinders, cored slabs, and overall data, respectively. Therefore, the null hypothesis that there is no statistically significant difference between core and cylinder compressive strengths could not be rejected at the 5-percent significance level for any of the compressive strength data sets.
For completeness, paired t-tests were also performed to confirm that there is a statistically significant difference between matched pairs of core and cylinder splitting tensile strengths. Two-tailed t-tests were performed on data sets of 43 cored cylinders, 36 cored slabs, and 79 overall pairs. In the analyses, the t-values were calculated to be 3.209, 8.631, and 5.569 for the cored cylinders, cored slabs, and overall data, respectively. Therefore, the null hypothesis that there is no statistically significant difference between core and cylinder compressive strengths was rejected at the 5-percent significance level for all of the splitting tensile strength data sets.
Examination of the overall distribution of the compressive strength cylinder-to-core ratios showed an approximately bell-shaped distribution around 1.0. The 88-point relative frequency histogram is shown in figure 75. However, as expected, an examination of the splitting tensile strength cylinder-to-core ratios showed a very skewed curve distributed around 0.75. The 79-point relative frequency histogram is shown in figure 76.
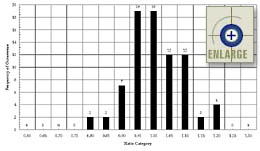 |
Figure 75. Relative frequency histogram of cylinder-to-core compressive strength ratios. |
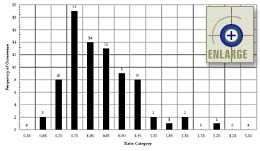 |
Figure 76. Relative frequency histogram of cylinder-to-core splitting tensile strength ratios. |
The current transverse joint faulting, transverse joint spalling, and transverse cracking distress indicator models require a 28-day flexural strength. These current distress indicator models are described in detail in the section titled Summary of Current Distress Indicator Models.
Effect of Entrained Air Content on Transverse Joint Spalling
Introduction
The effects of entrained air content on pavement performance were not well-documented in the collected literature. However, under a previous PRS study, a laboratory materials study was conducted to evaluate the effects of air void system parameters on transverse joint scaling/spalling percentages.(1,2,3) That research resulted in three different relationships in which joint spalling was a function of different combinations of entrained air content, void spacing factor, compressive strength, freeze-thaw cycles (at a depth of 76 mm below the pavement surface), and presence of deicing salt. (Note: These relationships and their inputs are presented in English units.) The first model was a function of entrained air content (not void spacing factor), as not all agencies collect hardened air content data. This developed relationship is presented in equation 14.(1,2,3)
SPALL = 22.6 + 75.1 * SALT * log(FTC76) – 78.0 * SALT – 11.7 * AIR * SALT – 0.00478 * f’c (14)
where
SPALL = Joint spalling, percent of joint length.
SALT = 0 if no calcium chloride is present, 1 if calcium chloride is present.
FTC76 = Cumulative number of estimated freeze-thaw cycles at 76 mm below the pavement surface.
AIR = Measured air content of the fully consolidated specimen, percent.
f’c = Measured compressive strength mean, psi.
The second model estimated joint spalling as a function of both entrained air content and void spacing factor. This relationship is presented in equation 15.(1,2,3)
SPALL = 45.0 + 77.0 * SALT * log(FTC76) – 29.3 * AIR * SALT – 0.001 * AIR * f’c – 1955 * L * SALT – 0.439 * L * f’c (15)
where
SPALL = Joint spalling, percent of joint length.
SALT = 0 if no calcium chloride is present, 1 if calcium chloride is present.
FTC76 = Cumulative number of estimated freeze-thaw cycles at 76 mm below the pavement surface.
AIR = Measured air content of the fully consolidated specimen, percent.
f’c = Measured compressive strength mean, psi.
L = Void spacing factor, 1/in.
The third model estimated joint spalling as a function of void spacing factor and not entrained air content. This relationship is presented in equation 16.(1,2,3)
SPALL = 14.1 + 74.9 * SALT * log(FTC76) – 137.1 * SALT + 1727 * L * SALT – 0.003 * f’c (16)
where
SPALL = Joint spalling, percent of joint length.
SALT = 0 if no calcium chloride is present, 1 if calcium chloride is present.
FTC76 = Cumulative number of estimated freeze-thaw cycles at 76 mm below the pavement surface.
L = Void spacing factor, 1/in.
f’c = Measured compressive strength mean, psi.
In order to use these relationships with confidence, they need to be verified under actual field conditions. Under the preceding PRS study, two alternatives were recommended for additional field investigation to accomplish this task.(1,2,3) The first option recommended using in-service pavement sections that exhibited joint spalling due to deficient air void parameters and consolidation levels. The various air void parameters, effects of deicer salts, and the estimated number of freeze-thaw cycles could then be correlated with joint spalling. This information could be used to modify or verify the previous PRS study performance models. The advantage of this type of study is that a field-calibrated performance model could be incorporated into the PRS.
The second option involved the construction and long-term monitoring of specially constructed test sections. The advantage of this option is that the developed performance model would be based on long-term field performance. The disadvantage is that results would not immediately be available (due to long-term monitoring) and certain pavement sections are essentially sacrificed ("destined" to fail because extremely low air contents would be used in order to observe accelerated deterioration).
The research team decided to verify (or calibrate) the entrained air content-based joint spalling relationships using field site evaluations. The testing procedures and model development are described in the following sections.
Sampling and Testing Procedures
For this research study, in-service pavements were used to calibrate the spalling performance models developed in a preceding PRS study.(1,2,3) Sampling was performed at three pavement joint repair projects, as shown in table 66. The same three projects were used for the consolidation and air content studies for variability. A number of joints from each project, exhibiting varying degrees of joint spalling, were selected for the evaluation. Joint repair projects were investigated because they allowed the retrieval of a sufficient number of 102-mm-diameter cores. At each joint evaluated, a sufficient number of cores were removed from between the dowel bars so that laboratory analyses of hardened air void parameters could be performed. The tests were run in accordance with ASTM C 457, Standard Test Method for Microscopical Determination of Parameters of the Air Void System in Hardened Concrete. In addition, cores were removed to determine the compressive strength of the concrete by ASTM C 42, Standard Test Method for Obtaining and Testing Drilled Cores and Sawed Beams of Concrete.
As seen in equations 14 through 16, the laboratory-developed relationships were functions of the presence of deicer salt (calcium chloride).(1,2,3) However, all three projects used to verify the relationship were in areas where deicer salts were regularly applied. Therefore, the SALT variable was effectively removed from the current investigation. In the previously developed equation, the use of salt was incorporated as "1" and the non-use of salt was included as "0," thus eliminating the salt term. For the current study, SALT was always "1", so the SALT multiplier was simply added to the equation constant.
The final factor necessary to develop/calibrate the joint spalling model was the number of freeze-thaw cycles experienced by the pavement. Because the previous study was controlled in the laboratory, the exact number of freeze-thaw cycles was determined with the use of thermocouples placed 76 mm below the surface of the deicer blocks. All the field sites evaluated in the current study were constructed more than 20 years ago, and the exact number of freeze-thaw cycles was unknown. Therefore, an estimate of the number of freeze-thaw cycles was calculated using the climatic model incorporated into the Climatic-Materials-Structural (CMS) computer program.(64)
Atmospheric data obtained from weather stations located near the three projects for the past 3 years were entered into the CMS program. The program output includes the number of freezing and thawing cycles that occur at any depth in the concrete based on the amount of weather station data input. To mirror the previous laboratory study, a freeze occurred for each pavement when the temperature calculated at a depth of 76 mm below the surface stayed below 0 °C for at least 48 hours. The pavement is assumed to be thawed when the temperature at 76 mm below the surface rises above 0 °C. The CMS program was then used to predict the number of freeze-thaw cycles that occurred for each project for the years 1994, 1995, and 1996. Based on studies published by Dempsey, the resulting number of annual pavement freeze-thaw cycles for the projects evaluated seem reasonable. This average annual number of cycles was then multiplied by the age of the pavements studied to compute the total number of cumulative freeze-thaw cycles for each project.
Transverse Joint Spalling Model Calibration
The collected data were used to calibrate the previously developed model predicting the percent of joint that is spalled as a function of compressive strength, freeze-thaw cycles, and air void system parameters. For simplicity, the model incorporating entrained air content is preferred over the models based on other air void system parameters. The air content model would allow the use of plastic air content data to be used as opposed to costly linear traverse testing.
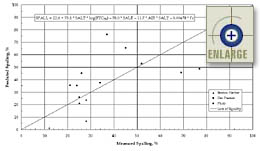
The collected data for the model calibration is summarized in table 67. Figure 77 shows a plot of the predicted joint spalling using the previously developed equation with entrained air content as the only air void parameter (equation 14) versus the field-measured joint spalling. Three new air void parameter-based regression equations were derived using the data collected for this investigation.
Table 67. Data collected for variables related to percent joint spalling.
|
Project |
Year Built |
Entrained Air Content, % |
Void Spacing Factor, mm |
Compressive Strength, MPa |
Number of Freeze/Thaw Cycles |
Percentage of Joint Spalled, % |
|---|---|---|---|---|---|---|
|
Benton Harbor, MI |
1971 |
10.6 |
0.1016 |
47.85 |
375 |
75 |
|
7.1 |
0.1016 |
46.82 |
375 |
28 |
||
|
7.8 |
0.1778 |
45.44 |
375 |
3 |
||
|
7.6 |
0.1016 |
46.61 |
375 |
12 |
||
|
5.6 |
0.2032 |
51.37 |
375 |
25 |
||
|
5.4 |
0.1524 |
51.09 |
375 |
28 |
||
|
Des Plaines, IL |
1967 |
5.7 |
0.3048 |
38.13 |
551 |
69 |
|
4.5 |
0.2540 |
48.26 |
551 |
52 |
||
|
6.7 |
0.1270 |
50.12 |
551 |
25 |
||
|
5.9 |
0.1778 |
46.75 |
551 |
34 |
||
|
4.9 |
0.2286 |
47.30 |
551 |
77 |
||
|
Philo, IL |
1970 |
2.9 |
0.2032 |
40.82 |
208 |
37 |
|
6.7 |
0.2540 |
35.37 |
208 |
21 |
||
|
7.1 |
0.1778 |
29.03 |
208 |
24 |
||
|
5.7 |
0.3048 |
38.54 |
208 |
26 |
||
|
4.3 |
0.3556 |
32.75 |
208 |
45 |
Note: The number of freeze-thaw cycles was determined using air temperature data in Dempsey’s CMS computer program.(64)
|
Figure 77. Predicted versus measured transverse joint spalling using the "entrained air content only" model developed under a previous PRS project.(1,2,3) |
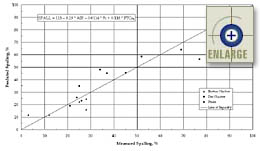
The first calibrated model, giving joint spalling as a function of entrained air content only, is presented as equation 17.
SPALL = 115 – 9.29 * AIR – 0.0114 * f’c + 0.118 * FTC76 (17)
where
SPALL = Joint spalling, percent of joint length.
AIR = Measured air content of the fully consolidated specimen, percent.
f’c = Measured compressive strength mean, psi.
FTC76 = Cumulative number of estimated freeze-thaw cycles at 76 mm below the pavement surface.
The collected data used in the development of equation 17 are presented in figure 78. A plot showing the sensitivity of equation 17 (function of only entrained air content) is presented in figure 79.
|
Figure 78. Predicted versus measured transverse joint spalling using the calibrated "entrained air content only" model. |
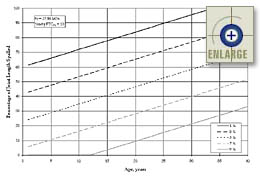 |
Figure 79. Sensitivity of the calibrated "entrained air content only" spalling model (percentage of joint length spalled versus age for different entrained air content percentages). |
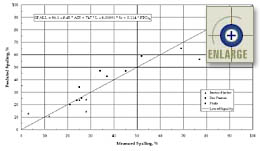
The second calibrated model, giving joint spalling as a function of both entrained air content and void spacing factor, is presented as equation 18.
SPALL = 96.1 – 8.45 * AIR + 747 * L – 0.00991 * f’c + 0.114 * FTC76(18)
where
SPALL = Joint spalling, percent of joint length.
AIR = Measured air content of the fully consolidated specimen, percent.
L = Void spacing factor, 1/in.
f’c = Measured compressive strength mean, psi.
FTC76 = Cumulative number of estimated freeze-thaw cycles at 76 mm below the pavement surface.
The collected data used in the development of equation 18 are presented in figure 80.
|
TFigure 80. Predicted versus measured transverse joint spalling using the calibrated "entrained air content and void spacing factor" model. |
The third calibrated model, estimating joint spalling as a function of void spacing factor and not entrained air content, is presented as equation 19.
SPALL = –7.3 + 3646 * L – 0.00403 * f’c + 0.0963 * FTC76 (19)
where
SPALL = Joint spalling, percent of joint length.
L = Void spacing factor, 1/in.
f’c = Measured compressive strength mean, psi.
FTC76 = Cumulative number of estimated freeze-thaw cycles at 76 mm below the pavement surface.
The collected data used in the development of equation 19 is presented in figure 81.
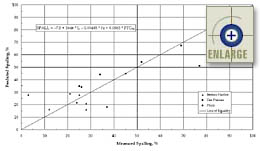 |
TFigure 81. Predicted versus measured transverse joint spalling using the calibrated "void spacing factor only" model. |
The complete procedure making up the current transverse joint spalling model is described in detail in the section titled Summary of Current Distress Indicator Models.
Effect of Percent Consolidation Around Dowels on Transverse Joint Faulting
Introduction
The effects of percent consolidation level around dowels on transverse joint faulting are not well-documented in the literature. The three projects evaluated for the calibration of the spalling prediction model were also evaluated for consolidation level at doweled joints as shown in table 66. Different sections within each project exhibiting a range of distress (faulting or loss of load transfer) were selected for the evaluation of the effect of consolidation level on load transfer across doweled joints. The relationship was integrated into the current faulting prediction model, which is a function of concrete bearing stress (BSTRESS).
Sampling and Testing Procedure
To measure the in situ consolidation level of concrete pavements at doweled joints, density was measured from drilled cores as previously detailed in the consolidation variability study. For each project, several joints exhibiting varying degrees of deterioration were selected as part of the study. Cores were drilled through dowel bars, between dowel bars, and away from the joint to evaluate relative variability. Core densities were measured in a saturated surface-dried condition in accordance with ASTM C 642, Standard Test Method for Specific Gravity, Absorption, and Voids in Hardened Concrete, to evaluate variability in consolidation incorporating the effects of basket assemblies and dowel bars (above and below). The core removed away from a joint with the highest density within a sampled lot was assumed to be 100-percent consolidated. The remaining core densities were compared to the 100-percent consolidated density to determine the relative consolidation levels. This procedure incorporates over-consolidation effects when vibration time is extended over basket assemblies or when vibrators contact dowels for longer-than-normal periods. Load transfer efficiency was directly measured using a falling-weight deflectometer (FWD), and the effective stress transfer efficiency was computed.
Summary of Results
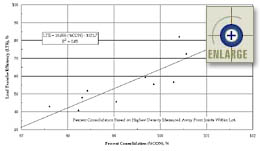
The variation of consolidation level was determined to be fairly minor in the variability portion of this investigation. Therefore, further projects were not evaluated for the collection of additional data. However, based on the data collected for the three projects, a load transfer efficiency (LTE) versus percent consolidation relationship was determined and is presented in equation 20.
LTE = 10.855 * (%CON) – 1021.7 (20)
where
LTE = Load transfer efficiency, %.
%CON = Computed percent consolidation around dowels, %.
The data used to determine this relationship are plotted in figure 82. Also shown on the graph is the derived regression equation for the relationship. This relationship was incorporated into the current joint faulting model (described in the section titled Summary of Current Distress Indicator Models).
|
Figure 82. Plot of load transfer efficiency as a function of percent concrete consolidation. |
Tie Bar Depth Versus Load Transfer Efficiency
To evaluate the feasibility that a model could be developed relating the tie bar depth to joint LTE, an FWD was used to measure longitudinal joint load transfer at the Omaha, Nebraska site as shown in table 66. As discussed in the section on tie bar variability, the tie bars at the Omaha project were consistently placed nearly 76 mm above slab mid-depth. However, as shown in figure 83 (for a consistent tie bar depth), the load transfer varied from as low as 30 percent to about 100 percent. Also shown in the figure are five locations where tie bars were placed significantly lower than average. The LTE was approximately 95 percent for these locations. Therefore, the collection of additional tie bar depth data from other construction sites was aborted after data collected at the Omaha project suggested that a reliable relationship was not likely.
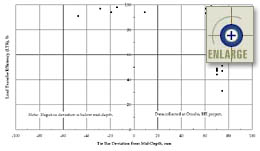 |
Figure 83. Load transfer efficiency versus tie bar deviation from slab mid-depth. |
The current PRS approach expresses JPCP performance in terms of any or all of the following distress indicators:
The best available set of these models was selected and is included in the revised PRS computer software (PaveSpec 2.0). This section includes detailed discussions of each model, including the model source, model form and specific procedures, and some discussion of the model sensitivity. The details of each model are described separately. (Note: Each of these models was originally developed in terms of English units; therefore, they are presented in this section in English units. Metric equivalents are given when appropriate.)
The current transverse slab-cracking model is based on a fatigue-cracking model developed by Smith et al. in 1990.(65) Specifically, the model is based on a fatigue-consumption approach that assumes a concrete pavement has a finite life and can only withstand a maximum allowable number of 80-kN equivalent single-axle loading (ESAL) repetitions (N). The details of the chosen transverse slab-cracking model are discussed below.
Transverse Slab-Cracking Model Characteristics
Model Source—Smith, K.D., A.L. Mueller, M.I. Darter, and D.G. Peshkin, Performance of Jointed Concrete Pavements, Volume II—Evaluation and Modification of Concrete Pavement Design and Analysis Models.(65)
Model Output Units—Percentage of slabs cracked.
Dependency on Other Model Outputs—None.
Transverse Slab-Cracking Model
%CRAKD = 1 / [0.01 + 0.03 * (20–log(n/N))] (21)
where
%CRAKD = Slabs cracked (transverse cracking), %.
n = Actual number of 80-kN ESAL applications at slab edge.
= (0.05 * TotESAL’s) for pavements without widened lanes.
= (0.001 * TotESAL’s) for pavements with widened lanes.
TotESAL’s = Cumulative total number of measured 80-kN ESAL applications.
N = Allowable 80-kN ESAL applications.
= 10[2.13*(1/Ratio)^1.2]
Ratio = The ratio of computed edge stress (sEDGE) to 28-day modulus of rupture (MR28).
sEDGE = Total resultant stress in the longitudinal direction at the bottom of the PCC slab edge when the wheel load is located at the slab edge.
= sTRAFFIC + (R) * sCURLING
sTRAFFIC = Stress at bottom of PCC slab edge when load is located at slab edge (no thermal curling stress). This value is computed using equation 22.
= [P / 18.0 * h2] * [17.35783 + (0.07801 * ES) – (0.05388 * h3 / k) + 7.41722 * log10h3/k)] (22)
sCURLING = Stress at bottom of PCC slab edge caused by curling of slab due to thermal gradient (no traffic load). This value is computed using equation 23.
= [(G * ET) / (5 x 10⁻⁶)] * [(0.06712 * k) + (79.07391 * log10(k)) + (11.72690 * L) – (0.00720 * k * L) – (3.22139 * L * log10(k)) – (0.06883 * L * ES) – (0.59539 * ES * log10(k)) – (204.39477 * h/k) – (38.08854 * L/h) – (8.36842 * h * log10(k)) + (0.07151 * ES * h) + (0.05691 * L * ES * log10(k)) + (0.20845 * L * h * log10(k)) + (0.00058 * L * h * k) – (0.00201 * L * ES * log10(k))] (23)
R = Adjustment factor for sCURLING so that it can be combined with sTRAFFIC to give correct sEDGE. This value is computed using equation 24.
= 0.48039 + (0.01401 * h) – (0.00427 * ES) – (0.27278 * G) – (0.00403 * L) + (0.19508 * log10(k)) + (0.45187 * G * log10(h)) – (0.00532 * G2) + (0.01246 * G * L) – (0.00622 * G * L * log10(k)) + (8.7872 * log10(h3/k)/h2) + (0.00104 * G * ES) – (0.11846 * G * log10(h3/k)) + (0.07001 * log10(ES + 1.0)) – (0.01331 * G * log10(ES + 1.0)) (24)
P = Total applied load, lb (assumed to be 9,000 lb).
hPCC = Slab thickness, in.
ES = Erodability of support along slab edge, in (assumed to be zero).
k = Modulus of subgrade reaction, psi/in.
ET = Thermal coefficient of contraction of PCC (assumed to be 0.0000055).
L = slab length (joint spacing), ft.
MR28 = 28-day modulus of rupture (third-point loading flexural strength), psi.
G = Thermal gradient through slab (estimated from table 68), °F/in.
Table 68. Average daytime thermal gradients (based on slab thickness and climatic zone), °F/in.(65)
|
Slab Thickness, mm |
Wet-Nonfreeze Climatic Zone |
Dry/Wet-Freeze Climatic Zones |
Dry-Nonfreeze Climatic Zone |
|---|---|---|---|
|
203 |
1.40 |
1.13 |
1.41 |
|
229 |
1.30 |
1.05 |
1.31 |
|
254 |
1.21 |
0.96 |
1.21 |
|
279 |
1.11 |
0.87 |
1.10 |
|
305 |
1.01 |
0.79 |
1.00 |
Procedure for Using the Transverse Cracking Model
Transverse fatigue cracking is predicted for both the as-designed and as-constructed pavements using the procedure outlined below. The variables that differ between the as-designed and as-constructed pavements include slab thickness and 28-day flexural strength (28-day modulus of rupture). The 28-day flexural strength may be translated from a 28-day compressive strength using an equation of the form MR = A * (f’c)0.5.
The step-by-step procedure for calculating the cracking (percentage of slabs cracked) for either the as-designed or as-constructed pavement is as follows:
total # cracked slabs per/mile = ([% cracked slabs/mi] / 100) * integer(5280 / [joint spacing]) (25)
where joint spacing is expressed in units of ft.
The translation is required because the PSR model uses "total # cracked slabs per/mile," whereas the IRI model uses "% cracked slabs/mile."
Sensitivity of Transverse Cracking Model
Plots showing the sensitivity of the model to several key pavement design inputs are included in this section. (Note: All of the sensitivity plots are presented in English units.)
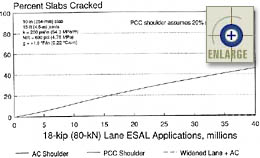
Figure 84 contains a plot showing the effect of shoulder type on transverse slab cracking. For the three different shoulder types investigated, the sections with a tied PCC shoulder and widened outer traffic lane both exhibited very little (if any) transverse cracking over 40 million ESAL applications. The section with only an asphalt shoulder displayed a significant amount of transverse cracking.
|
Figure 84. Sensitivity of transverse cracking model to shoulder type.(65) |
A plot showing the sensitivity of transverse cracking to changes in transverse joint spacing is included in figure 85. This chart clearly shows a positive influence of shorter slabs on reducing transverse cracking. The difference in predicted slab cracking between slabs with lengths of 6.1 m, 4.6 m, and 3.0 m is quite significant.
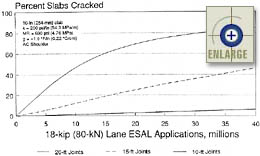 |
Figure 85. Sensitivity of transverse cracking model to transverse joint spacing.(65) |
Figure 86 provides the results of a sensitivity analysis of the transverse cracking model with respect to slab thickness. The plot shows that the 203-mm slab exhibits extensive slab cracking very early in its life. Increasing slab thickness from 203 mm to 254 mm greatly reduces the development of fatigue cracking. Likewise, increasing slab thickness from 254 mm to 305 mm essentially reduces the transverse slab cracking to zero.
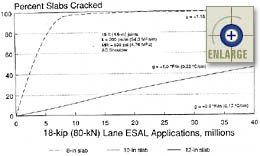 |
Figure 86. Sensitivity of transverse cracking model to slab thickness.(65) |
Two different procedures are used to estimate transverse joint spalling, depending on whether entrained air content is considered (the relationships using void spacing factor are not currently available in PaveSpec). Regardless of the procedure chosen, the base transverse joint spalling model is that developed by Yu et al. in 1997.(66) If entrained air content is not considered, transverse joint spalling is predicted directly using the base model. If entrained air content is considered, the transverse joint spalling (predicted using the base model) is then altered based on a comparison of as-constructed to as-designed mean entrained air content. Both model procedures are presented separately below. (Note: The model outputs and inputs are presented in English units.)
Tranverse Joint Spalling Base Model Characteristics
Model Source—Yu, H.T., K.D. Smith, M.I. Darter, J. Jiang, and L. Khazanovich, Performance of Concrete Pavements, Volume III—Improving Concrete Pavement Performance.(66)
Model Output Units—Percentage of medium- and high-severity spalled joints.
Dependency on Other Model Outputs—None.
Joint Spalling Model (Not Including Entrained Air Content)
%SPALL = AGE2 *10–6 * JTSPACE * [551.6 – 847.3 * (LIQSEAL + PREFSEAL) + (0.936 * (Days90)3 * 10–3) + (364 * DOWELCOR) + (2.783 – 1.40 * LIQSEAL – 2.368 * PREFSEAL – 0.676 * SILSEAL) *FI] (26)
where
%SPALL = Percentage of medium- and high-severity spalled joints where entrained air content is not considered.
AGE = Number of years since original construction.
DOWELCOR = Dowel corrosion (probably always assume = 0).
= 0, if no dowels exist or dowels are protected from corrosion.
= 1, if dowels are not protected from corrosion.
JTSPACE = Mean transverse joint spacing, ft.
LIQSEAL = 1, if liquid sealant exists in joint; otherwise, 0.
PREFSEAL = 1, if preformed sealant exists in joint; otherwise, 0.
SILSEAL = 1, if silicon sealant exists in joint; otherwise, 0.
FI = Mean annual freezing index, degree-days.
Days90 = Number of days with temperature greater than 90 oF.
Joint Spalling Model and Procedure (Including Entrained Air Content)
The procedure for the case where entrained air content is included is a four-phased procedure. The details of each phase are defined below.
Phase 1—Calculate the As-Designed Transverse Joint Spalling
The first step in computing the estimated yearly as-constructed transverse joint spalling is to determine the yearly as-designed transverse joint spalling values. The as-designed transverse joint spalling is assumed to be equal to the spalling computed for the case where entrained air content is not considered (i.e., the spalling computed directly using equation 26).
Phase 2—Calculate the Relative Difference Between the As-Designed and As-Constructed Spalling (due to the effects of air content and compressive strength)
This relative difference is due directly to differences between as-constructed and as-designed entrained air content and concrete strength. This as-constructed to as-designed (AC-AD) ratio is computed based on equations that are functions of entrained air content, compressive strength, freeze-thaw cycles (in the pavement), and age. Different equations are used depending on whether deicing salt is present. Each of these scenarios is described separately below.
Case 1—Salt is Present
If salt is present, an AC-AD ratio is computed based on the relationship calibrated under the current research project and presented as equation 17. This equation is calculated for both the as-constructed and as-designed pavements (using representative as-constructed and as-designed compressive strength and entrained air content means), as shown in equations 27 and 28, respectively.
AC-SPALL = 115 – (9.29 * AIRAS-CON) – (0.0114 * f’cAS-CON) + (0.118 * FTC76) (27)
AD-SPALL = 115 – (9.29 * AIRAS-DES) – (0.0114 * f’cAS-DES) + (0.118 * FTC76) (28)
where
AC-SPALL = As-constructed joint spalling number (function of as-constructed air content and f’c), percentage of joint length.
AD-SPALL = As-designed joint spalling number (function of as-designed air content and f’c), percentage of joint length.
FTC76 = Cumulative number of estimated freeze thaw-cycles at 76 mm below the pavement surface.
AIRAS-CON = Measured as-constructed air content, percent.
AIRAS-DES = As-designed air content, percent.
f’cAS-CON = Measured as-constructed compressive strength, psi.
f’cAS-DES = As-designed compressive strength, psi.
Finally, the AC-AD ratio is computed as a function of AC-SPALL and AD-SPALL using equation 29.
AC-AD ratio = AC-SPALL/AD-SPALL (29)
Case 2—Salt is Not Present
If salt is not present, equation 14 (developed under the previous PRS project) is used.(1,2,3) Without the presence of salt, equation 14 simplifies to be a function of compressive strength only. Therefore, the effects of entrained air content are no longer considered directly, but instead are considered indirectly through compressive strength. The equation is calculated for both the as-constructed and as-designed pavements (using representative as-constructed and as-designed compressive strength means), as shown in equations 30 and 31, respectively.
AC-SPALL = 22.6 – 0.00478 * f’cAS-CON (30)
AD-SPALL = 22.6 – 0.00478 * f’cAS-DES (31)
where
AC-SPALL = As-constructed joint spalling number (function of as-constructed air content and f’c), percentage of joint length.
AD-SPALL = As-designed joint spalling number (function of as-designed air content and f’c), percentage of joint length.
f’cAS-CON = Measured as-constructed compressive strength, psi.
f’cAS-DES = As-designed compressive strength, psi.
Finally, the AC-AD ratio is again computed using equation 29.
Phase 3—Determine the As-Constructed Spalling Values Using the Phase 2 AC-AD Ratio
The phase 3 as-constructed spalling values are calculated by multiplying the phase 1 as-designed spalling values by the computed phase 2 AC-AD yearly ratios.
Phase 4—Adjustment of Phase 3 Spalling Values to the Assumed Boundary Conditions
Finally, the phase 3 as-constructed spalling values are adjusted to the assumed boundary conditions in phase 4. The following general assumptions are used to define the boundary conditions:
The following step-by-step procedures are used to determine the as-constructed spalling curve values required to match the boundary conditions. The values in question are near an age of zero. The procedure differs depending on whether the as-constructed values are greater than or less than the as-designed values. The as-designed and as-constructed values at the end of the analysis period are used to determine which scenario is used. Each scenario is explained in detail below.
Scenario 1: The as-constructed value is less than the as-designed value at the end of the analysis period.
Scenario 1 represents the case where the as-constructed pavement is constructed with better quality than specified for the as-designed pavement. When this occurs, the following procedure is used to ensure boundary conditions:
Scenario 2: The as-constructed value is greater than the as-designed value at the end of the analysis period.
Scenario 2 represents the case where the as-constructed pavement is constructed with poorer quality than that specified for the as-designed pavement. When this occurs, the following procedure is used to ensure boundary conditions:
Sensitivity of Transverse Joint Spalling Base Model
A sensitivity analysis of the transverse joint spalling base model was conducted in the study by Yu et al.(66) The results of this sensitivity analysis are provided in this section. (Note: All of the sensitivity plots are presented in English units.)
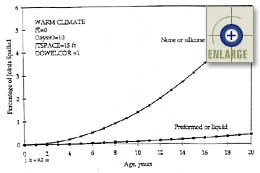
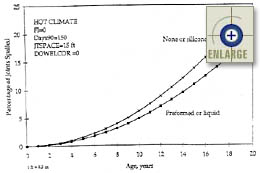
Figures 87 through 90 show the sensitivity of the joint spalling model to age, sealant type, and climatic conditions. These plots were constructed by fixing the climatic variables, Days90 and FI, at constant typical values for cold, warm, and hot regions. It is assumed that no dowel corrosion exists, but similar trends were observed for sections with dowel corrosion. Each of these plots shows that the amount of joint spalling (and the rate of the increase in spalling) always increases with age.
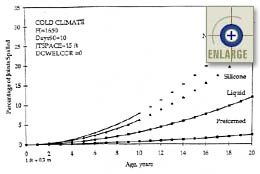
|
Figure 87. Sensitivity of the JPCP transverse joint spalling base model to age, sealant type, and climatic conditions (FI = 1650).(66) |
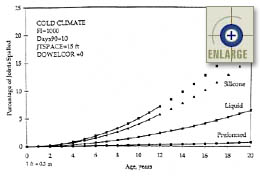 |
Figure 88. Sensitivity of the JPCP transverse joint spalling base model to age, sealant type, and climatic conditions (FI = 1000).(66) |
|
Figure 89. Sensitivity of the JPCP transverse joint spalling base model to age, sealant type, and climatic conditions (FI = 0, Days90 = 10).(66) |
|
Figure 90. Sensitivity of the JPCP transverse joint spalling base model to age, sealant type, and climatic conditions (FI = 0, Days90 = 150).(66) |
Figure 91 shows results of the sensitivity analysis of age and potential dowel corrosion on tranvserse joint spalling. This plot illustrates the effect of dowel corrosion in a cold climate (FI = 500, Days90 = 10). The plot shows that dowel corrosion significantly increases the percentage of spalled joints. Therefore, corrosion protection of dowels is very important.
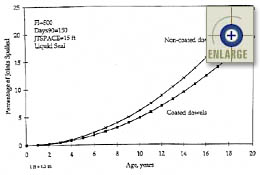 |
Figure 91. Sensitivity of the JPCP transverse joint spalling base model to age and dowel protection.(66) |
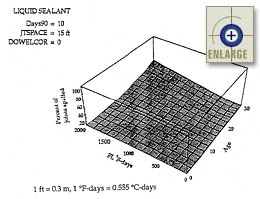
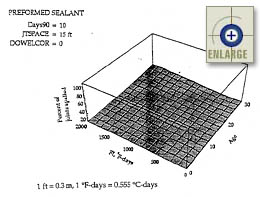
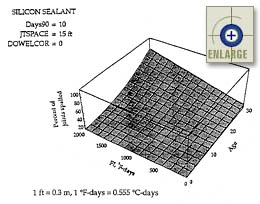
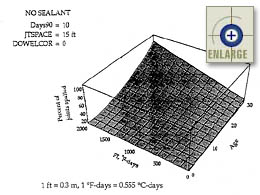
As summarized in the report by Yu et al., the three-dimensional plots in figures 92 through 95 show the effect of the interaction between climate conditions and pavement age on the performance of each type of sealant. The number of days with temperatures above 90 °F (32 °C), Days90, is fixed at 10, and the variation of FI from 0 to 2000 represents variation in climate from mild to cold. The percentage of spalled joints increases with age and freezing index. It is predicted that significant spalling of sealed joints does not begin until about 10 or 15 years after construction, but rapidly increases after that, especially in cold climates. This effect can be explained by the increase in the number of freeze-thaw cycles to which the pavements are exposed.(66)
|
Figure 92. Sensitivity of the JPCP transverse joint spalling base model to age and freezing index (liquid sealant).(66) |
|
Figure 93. Sensitivity of the JPCP transverse joint spalling base model to age and freezing index (preformed sealant).(66) |
|
Figure 94. Sensitivity of the JPCP transverse joint spalling base model to age and freezing index (silicone sealant).(66) |
|
Figure 95. Sensitivity of the JPCP transverse joint spalling base model to age and freezing index (no sealant).(66) |
Based on the results provided by the JPCP joint spalling model, the following conclusions were drawn in the report by Yu et al.:(66)
Two different procedures are used to estimate transverse joint faulting, depending on whether percent consolidation around dowels is considered. Regardless of the procedure chosen, the base transverse joint faulting model is that developed by Yu et al. in 1998.(67) If percent consolidation around dowels is not considered, transverse joint faulting is predicted directly using the base model. If percent consolidation around dowels is considered, the transverse joint faulting values (predicted using the base model) are then altered by adjusting the AGG term of the model. The procedures making up both situations are discussed in detail in the following sections. (Note: The model outputs and inputs are presented in English units.)
Base Transverse Joint Faulting Model Characteristics
Model Source—Yu, H.T., L. Khazanovich, S.P. Rao, M.I. Darter, and H. Von Quintus, Guidelines for Subsurface Drainage Based on Performance, Appendices. (67)
Model Output Units— Mean transverse joint faulting, in.
Dependency on Other Model Outputs—None.
Transverse Joint Faulting (Not Including Percent Consolidation Around Dowels)
FAULT = DAMAGE0.2475 * [0.2405 – 0.00118 * Days90 + 0.001216 * WETDAYS – 0.04336 * BASETYPE – (0.004336 + 0.007059 * (1 – DOWEL)) * LCB] (32)
where
FAULT = Average transverse joint faulting for JPCP, in.
BASE = Base type (0 if nonstabilized or lean concrete base [LCB]; 1 if stabilized with asphalt [ATB] or cement [CTB]).
LCB = Lean concrete base (1 if lean concrete base, 0 otherwise).
WETDAYS = Average number of wet days per year.
Days90 = Number of days per year with the maximum temperature greater than 90 °F (32 °C).
DOWEL = Presence of dowels (0 if no dowels, 1 otherwise).
DAMAGE = nMILLIONS / NMILLIONS
nMILLIONS = Actual number of applied cumulative ESAL’s, millions.
NMILLIONS = Allowable number of applied cumulative ESAL’s, millions.
Intermediate variables include the following:
Log(N) = 0.785983 – 0.92991 * (1 + 0.40 * PERM * (1 – DOWEL)) * Log (DE) (33)
and
AGG* = (AGG/kL) (34)
= 2.3 Exp(1 – 1.987 * JTSPACE / L + 3.48 * DOWELDIA3.56)
where
AGG* = Nondimensional aggregate interlock stiffness.
k = Modulus of subgrade reaction.
L = Slab’s radius of relative stiffness.
JTSPACE = Slab length (joint spacing), ft.
DOWELDIAM = Dowel diameter, in.
PERM = Base permeability (0 = not permeable, 1 = permeable).
Procedure for Using the Transverse Joint Faulting Model (Not Including Percent Consolidation Around Dowels)
To determine the transverse joint faulting if percent consolidation around dowels is not included, the following parameters must be known:
hPCC = Slab thickness, in.
EPCC = PCC modulus of elasticity, psi.
m = PCC Poisson’s ratio (assumed to be equal to 0.15).
k = Modulus of subgrade reaction, psi/in.
DOWELDIAM = Dowel diameter, in.
JTSPACE = Joint spacing (ft), if joint spacing is not greater than 40 ft (12.2 m); 40 otherwise.
BASE = Base type (0 if nonstabilized or lean concrete base [LCB]; 1 if stabilized with asphalt [ATB] or cement [CTB]).
LCB = 1 if lean concrete base, 0 otherwise.
PERM = Base permeability (0 = not permeable, 1 = permeable).
WIDENLANE = Widened lane (0 = not widened, 1 = widened).
Next, the model is executed using the following step-by-step procedure.
L = [(EPCC * hPCC) / (12 * (1 – m2) * k)]0.25 (35)
wfe,0 = (0.0000864 * L2 + 0.002824 * L + 0.2953) * 18000 / kL2 (36)
wfe,914 = (0.0000648 * L2 + 0.003934 * L – 0.02548) * 18000/kL2 (37)
LTEx=0(%) = 1 / [0.01 + 0.012 * (AGG*)-0.849] (38)
LTEx=914(%) = 1 / [0.01 + 0.003483 * (AGG*)-1.13677] (39)
wUL = wUL,0 + (wUL,914 – wUL,0) * x / 914 (42)
This equation interpolates between the unloaded slab deflections at x = 0 and 914 mm, where x is the distance from the wheelpath to the slab corner. The variable "x" is calculated as the additional width provided by the widened lane plus 305 mm (this sum is limited to 914 mm). For example, if the chosen widened lane width is 4.3 m, and the regular lane width is 3.7 m, the added width is 609 mm. The variable "x" is then calculated as 609 mm + 305 mm to give x = 914 mm.
LTE = LTE0 + (LTE914 – LTE0) * x / 914 (43)
This equation interpolates between the LTE’s computed for x = 0 and 914 mm.
wL = wUL / LTE (44)
DE = 0.5 * k * (wL2 – wUL2) (45)
Procedure for Using the Transverse Joint Faulting Model (Including Percent Consolidation Around Dowels)
The only difference between the procedure including percent consolidation and the case without percent consolidation is the change in the value used for the AGG* term. For the case including percent consolidation around dowels, the following procedure is used to alter the AGG* and redefine it as AGG*NEW. (Note: The altered AGG*NEW is then used in all of the subsequent calculation steps.) The following is the updated step-by-step procedure using AGG*NEW.
AGG*NEW = 10[Log(AGG*) + 0.27 * (%CON – 100)] (46)
LTEx=0(%) = 1 / [0.01 + 0.012 * (AGG*NEW)-0.849] (47)
Sensitivity of Transverse Joint Faulting Base Model
A sensitivity analysis of the transverse joint faulting base model was conducted in the study by Yu et al.(67) The results of this sensitivity analysis are provided in this section. Each plot is developed by fixing all other variables at a constant value while varying the selected variables over practical ranges. (Note: All of the sensitivity plots are presented in English units.)
Figure 96 shows the sensitivity of the joint faulting model to cumulative ESAL’s and dowel diameter. The chart shows that dowels decrease faulting and faulting decreases with an increase in dowel diameter. Figures 97 and 98 show that widened lanes decrease faulting for both doweled and nondoweled pavements. Figure 99 shows the effects of traffic and base permeability on the faulting of nondoweled pavements. Figures 100 and 101 show the sensitivity of the faulting model with respect to changes in climatic conditions. Figure 102 shows the sensitivity of the joint faulting model to cumulative ESAL’s and percent consolidation around dowels.
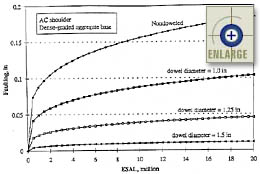 |
Figure 96. Sensitivity of the JPCP transverse joint faulting base model to traffic and dowel diameter.(67) |
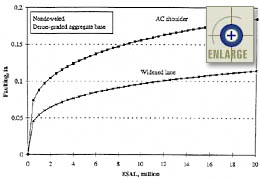 |
Figure 97. Sensitivity of the JPCP transverse joint faulting base model (for nondoweled pavements) to traffic and widened lanes.(67) |
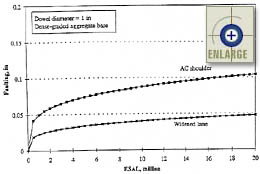 |
Figure 98. Sensitivity of the JPCP transverse joint faulting base model (for doweled joints) to traffic and widened lanes.(67) |
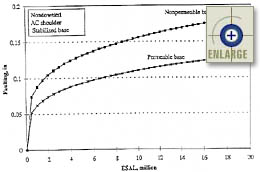 |
Figure 99. Sensitivity of the JPCP transverse joint faulting base model (for nondoweled pavements) to traffic and base permeability.(67) |
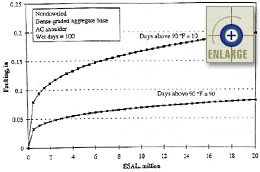 |
Figure 100. Sensitivity of the JPCP transverse joint faulting base model (for nondoweled pavements) to traffic and number of days above 32 °C.(67) |
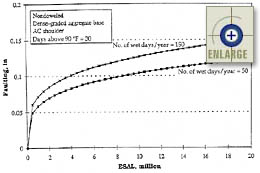 |
Figure 101. Sensitivity of the JPCP transverse joint faulting base model (for nondoweled pavements) to traffic and number of wet days.(67) |
Present Serviceability Rating (PSR)
When developing a PRS, the user may choose to predict smoothness over time in terms of PSR. PSR is predicted using the following model developed by Yu et al. in 1997.(66) (Note: The model outputs and inputs are presented in English units.)
Present Serviceability Rating Model Characteristics
Model Source—Yu, H.T., M.I. Darter, K.D. Smith, J. Jiang, and L. Khazanovich, Performance of Concrete Pavements, Volume III—Improving Concrete Pavement Performance.(66)
Model Output Units—Present serviceability rating (rating between 0 and 5).
Dependency on Other Model Outputs—Function of transverse slab cracking, transverse joint faulting, transverse joint spalling, and longitudinal cracking.
Present Serviceability Rating Model
PSR = 3.95 – 0.010276 * FaultTT – 0.001014 * T-Crack – 0.009421 * Spall – 0.003911 * L-Crack0.5 (49)
where
PSR = Present serviceability rating (rating between 0 and 5).
FaultTT = Total joint faulting per mile, in/mi.
= (FAULT) * Integer(5280 / JTSPACE)
T-Crack = Total number of transverse crack, number/mi.
= (%CRAKD / 100) * Integer(5280 / JTSPACE)
Spall = Percentage of joints spalled.
= %SPALL (used directly)
L-Crack = Longitudinal cracking, ft/mile (assumed to equal zero).
Therefore, the final usable form of this model becomes:
where
PSR = Present serviceability rating (rating between 0 and 5).
INITPSR = Initial present serviceability rating (rating between 0 and 5). Estimated as a function of initial profile index.
FAULT = Average transverse joint faulting for JPCP, in.
JTSPACE = Mean transverse joint spacing, ft.
%CRAKD = Percentage of slabs cracked (transverse cracking).
%SPALL = Percentage of medium- and high-severity spalled joints.
Note that the coefficient of 3.95 (in equation 49) has been replaced with an initial PSR variable "INITPSR." The user must define a correlation between initial PSR and initial profile index (measured using a 5.1-mm blanking band) in the PaveSpec computer software.
Procedure for Using the PSR Model
The PSR is predicted for both the as-designed and as-constructed pavements. The first step in either case is to predict values for all of the other distress indicators at each year. Next, these predicted distress indicator values are used in equation 50 to predict yearly values for PSR. This procedure is repeated using both as-designed and as-constructed pavement characteristics.
Sensitivity of PSR Model
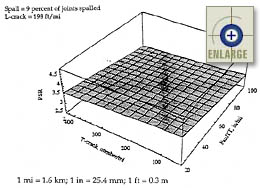
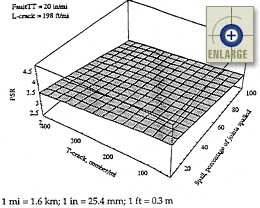
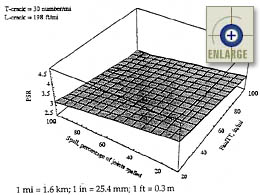
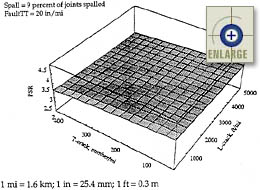
A sensitivity analysis of the PSR model was conducted in the study by Yu et al.(66) Figures 103 through 106 show the sensitivity of the PSR model to changes in the other predicted distress indicators. (Note: All of the sensitivity plots are presented in English units.)
|
Figure 103. Sensitivity of the JPCP PSR model to transverse joint faulting and transverse slab cracking.(66) |
|
Figure 104. Sensitivity of the JPCP PSR model to transverse slab cracking and transverse joint spalling.(66) |
|
Figure 105. Sensitivity of the JPCP PSR model to transverse joint faulting and transverse joint spalling.(66) |
|
Figure 106. Sensitivity of the JPCP PSR model to transverse slab cracking and longitudinal cracking.(66). |
International Roughness Index (IRI)
The current PRS approach allows pavement smoothness to be expressed in terms of IRI. A new IRI prediction regression model was developed under the current research project based on data obtained from the Long Term Pavement Performance (LTPP) performance database. Details of the developed model are provided in the following sections. (Note: The model outputs and inputs are presented in English units.)
International Roughness Index Model Characteristics
Model Source—Developed under the current PRS research project.
Model Output Units—International roughness index, in/mi.
Dependency on Other Model Outputs—Function of transverse slab cracking, transverse joint faulting, transverse joint spalling.
International Roughness Index Model
where
IRI = International roughness indicator, in/mi.
INITIRI = Initial IRI, in/mi.
Age = Number of years since construction, years.
%CRAKD = Percentage slabs cracked.
FAULT = Average joint faulting per joint, in.
%SPALL = Percentage of medium- and high-severity spalled joints.
Procedure for Using the IRI Model
The IRI is predicted for both the as-designed and as-constructed pavements. First, values for all of the other distress indicators are predicted at each year. Next, these predicted distress indicator values are used in equation 51 to predict yearly values for IRI. This procedure is repeated using both as-designed and as-constructed pavement characteristics.
Sensitivity of IRI Model
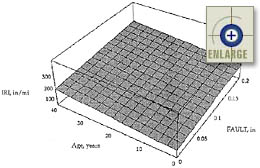
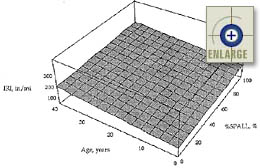
A sensitivity analysis of the IRI model was conducted under the current study. Figures 107 through 109 show the sensitivity of the IRI model to changes in the other predicted distress indicators. (Note: All of the sensitivity plots are presented in English units.)
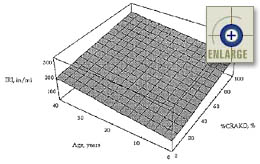 |
Figure 107. Sensitivity of the JPCP IRI model to age and transverse slab cracking. |
|
Figure 108. Sensitivity of the JPCP IRI model to age and transverse joint faulting. |
|
Figure 109. Sensitivity of the JPCP IRI model to age and transverse joint spalling. |