U.S. Department of Transportation
Federal Highway Administration
1200 New Jersey Avenue, SE
Washington, DC 20590
202-366-4000
Federal Highway Administration Research and Technology
Coordinating, Developing, and Delivering Highway Transportation Innovations
 |
| This report is an archived publication and may contain dated technical, contact, and link information |
|
Publication Number: FHWA-HRT-09-048 October 2009 |
In this user manual, guidance is given on how to use the new HIPERPAV® III software program for the analysis of early–age Portland cement concrete pavement (PCCP) behavior. HIPERPAV® III includes several improvements from previous versions (i.e., HIPERPAV® and HIPERPAV® II). This user manual describes the following features in detail:
As in HIPERPAV® II, analysis in HIPERPAV® III begins by entering basic inputs including a description of the project and location. Figure 1 shows a map on which users pinpoint the location of the project. The next step in the analysis process is creating strategies based on structural design, mix design, construction condition, and climate information. Additional details can be found in the accompanying report Computer–Based Guidelines for Concrete Pavements, Volume II: Design and Construction Guidelines and HIPERPAV II User's Manual (FHWA–HRT–04–122).
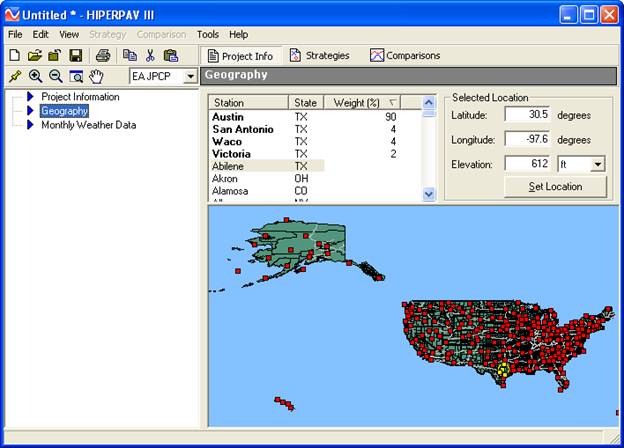
Figure 1. Screenshot. Project location (Austin, TX).
An enhanced moisture model was incorporated into HIPERPAV® to increase the accuracy of early–age behavior predictions. In previous versions of HIPERPAV®, mathematical models used to calculate early–age behavior focused primarily on temperature effects. However, moisture in Portland cement concrete (PCC) and its migration through the concrete's pore structure has a great influence on PCCP early–age behavior, and it needs to be accounted for.
Moisture content in concrete is influenced by factors such as type of base, water–to–cement ratio, type of cement, admixtures, supplementary cementitious material, aggregates, temperature, wind speed, relative humidity of air, and type of curing. Changes in moisture content are the result of drying due to hydration, evaporation, or moisture transport into the base. As the concrete dries, it shrinks. This shrinkage, coupled with temperature gradients, causes axial, curling, and warping movements. These movements create tensile stresses in the concrete and ultimately create the potential for early–age cracking.
The potential for early–age cracking due to moisture content is calculated in HIPERPAV® III by a one–dimensional finite–difference model that relates materials, environmental effects, and curing procedures for PCCP.
A large effect on stresses as a function of the base moisture was identified during the development of the moisture model. As a result, an input to identify the moisture state of the base/subbase was included. Under construction inputs, users are asked whether the subbase is moist or dry (see figure 2).
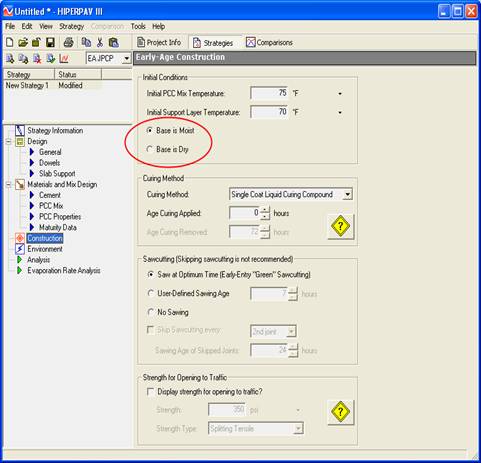
Figure 2 . Screenshot. Construction input screen.
The effect of moisture loss to the base layer depends on the permeability of the base (the effect is more critical for a permeable base). The effect also depends on the slab thickness. For simplicity, the base moisture conditions in HIPERPAV® III represent only the two extremes: critical moisture loss to the base (dry permeable base) and low moisture loss (moist nonpermeable base). Therefore, base moisture content is defaulted as 0.3 and 0.9 at the dry and wet conditions, respectively. Future research is recommended to study this effect in more detail.
Although the selection of base moisture in HIPERPAV® III is rather subjective, if users believe that there is the potential for excess moisture loss from the slab to the base, an analysis for the dry base condition should be run to evaluate the cracking risk. Given the large effect of the base moisture condition, this input is available in both the simple and advanced strategy views.
The new moisture model work focuses on characterizing the effect of moisture on drying shrinkage and warping stresses as well as its effect on strength gain. The evaporation rate analysis in HIPERPAV® III takes into account environmental conditions and concrete temperature to estimate evaporation loss from the surface of the concrete based on Menzel's equation.(1) The new moisture model does not impact the evaporation rate analysis. The goal of this project was not focused on developing the required models to properly characterize this effect; however, future work could be conducted to achieve this goal. The current moisture model would be a good start for that effort.
It should also be noted that other material parameters including the initial diffusivity and surface factor are computed by the HIPERPAV® III software program using the empirical equations.
It has always been a goal for HIPERPAV® III to be as user friendly as possible. However, not all users have the same level of concrete knowledge or expertise. To help less experienced users understand what inputs are required and why, previous versions of HIPERPAV® included a help icon that linked users to more information. It became apparent that a link was not enough to help the most inexperienced users navigate through the software easily or intuitively. Therefore, HIPERPAV® III offers two views to help users: a simple view for the novice users and an advanced view for those with more experience. Users can choose which level best suits their needs by selecting accordingly from the "View" drop–down menu (see figure 3).
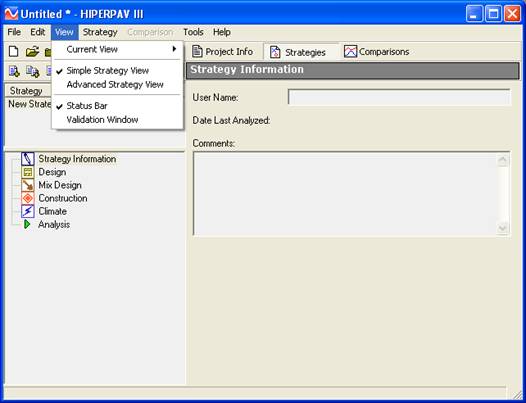
Figure 3 . Screenshot. Simple strategy view.
The simple view requires limited input data and estimates variables that are otherwise inputs for an advanced level user. As a result, users navigate through fewer screens ("Design," "Mix Design," "Construction," and "Climate") arranged in a descending order on the left side of the screen. The analysis screen is the final screen in the list showing the stress and strength development once the analysis is run.
Like the simple view, the advanced view lists screens in a descending view. However, as seen in figure 4, users are required to supply more detailed information for the advanced level HIPERPAV® III interface. Default values are supplied in the advanced view for various inputs, but users are encouraged to supply job–specific information for optimal accuracy.
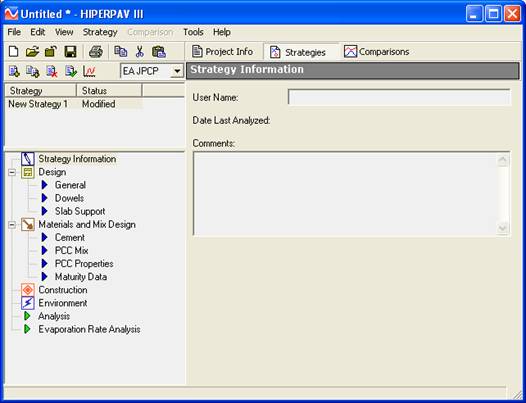
Figure 4 . Screenshot. Advanced strategy view.
Both the simple and advanced views predict early–age behavior of PCCP. The simple strategy view requires fewer inputs and estimates some variables based on built–in default values.However, the advanced strategy view provides more accurate predictions of PCCP early–age behavior as long as some default values are replaced with job–specific values.
For simplicity, both the evaporation rate analysis during the plastic state and the analysis results for tensile stress and strength during the first 72 hours after construction are presented on a single screen in the simple strategy view (see figure 5).
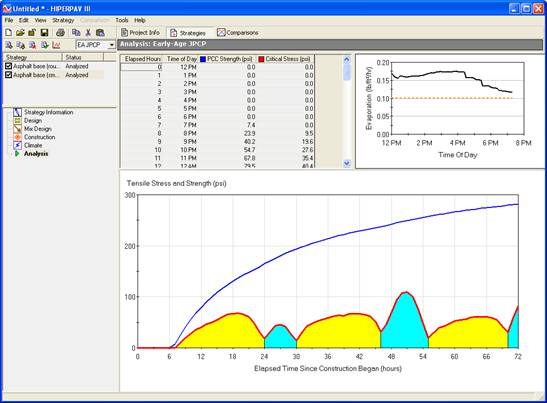
Figure 5 . Screenshot. Simple strategy view analysis results.
The ability to characterize the heat evolution of cement paste from semiadiabatic calorimetry testing improves precision of the HIPERPAV® III's mathematical models in predicting thermal stress and strength development.
Previous versions of HIPERPAV® modeled heat evolution based on linear regression models related to cementitious materials chemistry. Heat of hydration influences thermal gradients and affects tensile stresses in early–age concrete. When available, these values can be entered directly into HIPERPAV® III in the advanced strategy view. Figure 6 shows where the heat evolution data can be entered. Figure 7 shows what information is required to calculate the heat of hydration based on semiadiabatic calorimetric test data.
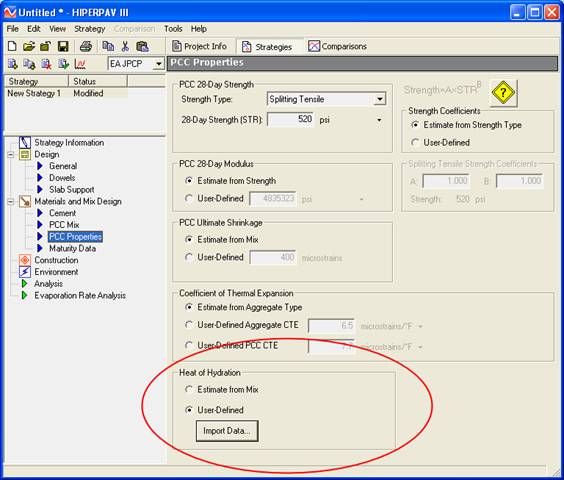
Figure 6 . Screenshot. Heat of hydration input data.

Figure 7 . Screenshot. Semiadiabatic calorimetry input data required for heat of hydration calculations.
A batch mode for analyzing multiple strategies at once has also been included in HIPERPAV® III. If users have multiple strategies that require analysis, all of the strategies can be run at once by selecting "Batch Mode" from the "Strategy" drop–down menu (see figure 8). A check box appears to the left of each strategy to show it has been selected for analysis. Users should check only the strategies to be analyzed. All strategies are automatically analyzed instead of having to run them one by one.
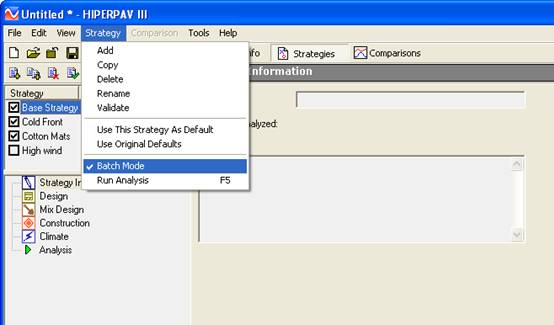
Figure 8 . Screenshot. Batch mode analysis.
New sensitivity analysis tools can be found under the "Comparisons" tab (see figure 9). Two types of comparison analyses are available in HIPERPAV® III: "Quick Compare" and "Sensitivity Comparisons."
The "Quick Compare" screen offers users a chance to quickly discern differences between strategies in terms of design, materials, environmental inputs, and construction inputs as well as the resulting differences in strength gain, stress development, and cracking risk. The differences are presented in a side–by–side comparison. Previous versions of HIPERPAV® did not offer a side–by–side strategy comparison. Instead, users had to toggle back and forth between analysis screens of individual strategies to make comparisons.
One advantage of the "Quick Compare" tool is the ability to compare up to four individual strategies, reviewing how their differences affect concrete properties in a side–by–side comparison for each property. Users check which strategies are of interest (limit of four) and click the "Compare" button. A chart that lists the date and any input differences is generated. Users can toggle between the chart and graphs to provide a visual comparison between strategies and their properties including strength, critical stresses, strength–to–stress differences, and stress–to–strength ratios for each of the chosen strategies.
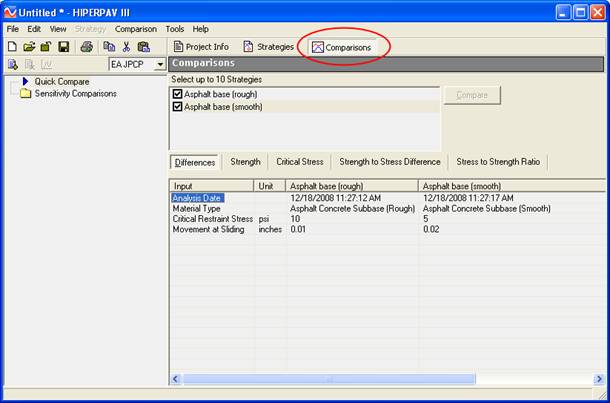
Figure 9 . Screenshot. Quick compare chart of differences.
Similar to the quick compare option, the "Sensitivity Comparisons" tool also generates a chart and graphs through which users can toggle to compare. However, instead of comparing strategies, this tool compares the effects of changing input variables by selecting an existing strategy as a base case scenario. The advantage of the "Sensitivity Comparisons" tool is the ability to evaluate the effect of any input variable on strength and stress development for a single strategy and to see that effect in a side–by–side comparison.
To use this tool, users should click on "Sensitivity Comparisons" and add a comparison with the "Add" button on the upper left corner of the screen (see figure 10). A wizard screen pops up to select the strategy of interest. The input variable to be evaluated is then selected along with a range for that variable (if applicable) and an analysis interval. Figure 10 shows a sensitivity comparison for "Initial Mix Temperature." For this example, a range from 50 to 90 ºF is used. Also, an interval of 10 ºF is selected so that the wizard runs an analysis with an initial mix temperature from 50 to 90 ºF at every 10 ºF for a total of five runs. HIPERPAV® III then calculates the strength, critical stresses, strength–to–stress differences, and stress–to–strength ratios for the range of the input variable.
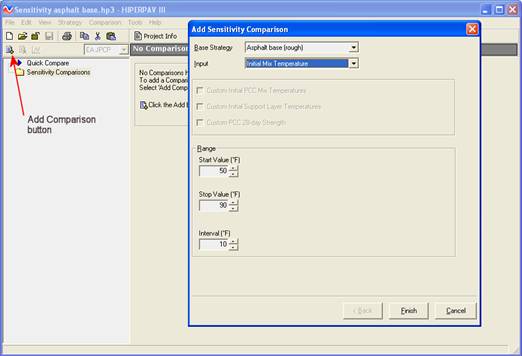
Figure 10 . Screenshot. Sensitivity comparison wizard.
Figure 11 presents the results from this sensitivity analysis in terms of stress–to–strength ratio. A summary tab is also available in this analysis to show the maximum stress–to–strength ratio for each analysis run in a bar graph as seen in figure 12. The bars are plotted in a color gradient from green (low cracking risk) to red (high cracking risk) to show the proximity to the critical stress–to–strength ratio of 100 percent (cracking risk threshold).
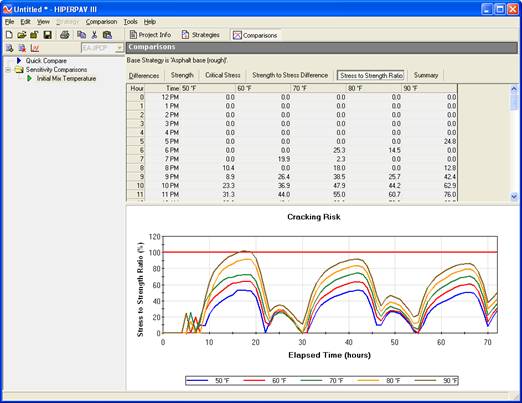
Figure 11 . Screenshot. Stress–to–strength ratio screen.
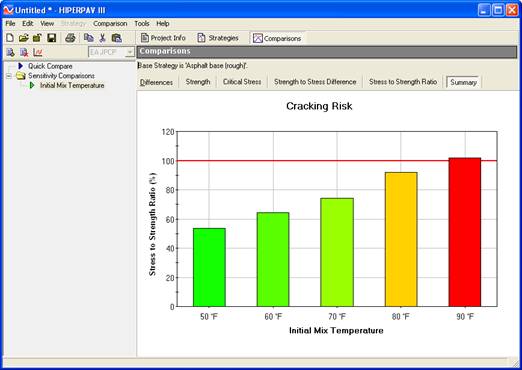
Figure 12 . Screenshot.Sensitivity summary screen for PCC mix temperature.
Most often, users of previous HIPERPAV® versions requested the ability to compare the effect of different times of construction without having to do individual strategies for each interval of time. The "Sensitivity Comparisons" tool gives users that ability users identify a base strategy, select "Construction Time" as the variable to evaluate, and choose a range from 1 to 6 hours.
For this sensitivity analysis, users also have the option to use custom initial PCC mix and support layer temperatures for each analysis interval. If this information is not available, HIPERPAV® III can estimate these temperatures based on current environmental conditions for each construction time. This is done when users leave the check boxes under each of these inputs unchecked.
HIPERPAV® III calculates and generates charts and graphs accordingly. Similar to the previous example, users can see the effect that time of construction has on the stress–to–strength ratio. Figure 13 shows a summary of the stress–to–strength ratio for a time of construction sensitivity analysis. Users can easily see that in some morning hours, there is a higher probability of exceeding the cracking risk line.
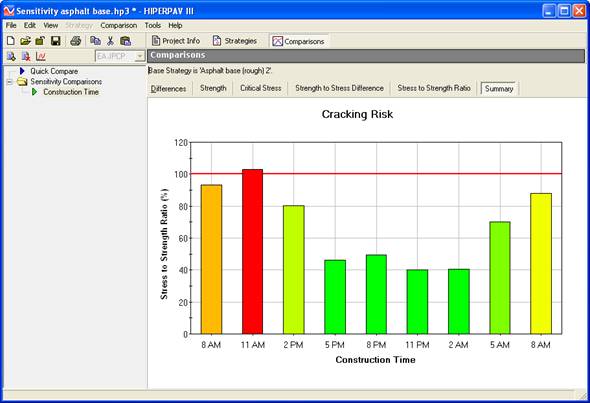
Figure 13 . Screenshot. Sensitivity summary screen for construction time.
This project is sponsored by the Federal Highway Administration (FHWA). The authors would like to express their gratitude to the FHWA for their support.
Special thanks are extended to the technical working group members including Leif Wathne, Robert Rodden, Kevin McMullen, Gary Knight, and Lloyd Welker of the Ohio Department of Transportation.
Additional thanks are extended to FHWA staff including Fred Faridazar, Research and Development and Project Contracting Officer's Technical Representative; Rick Meininger, Research and Development; Jussara Tanesi, Research and Development; Gary Crawford, Office of Pavement Technology; Jim Grove, Office of Pavement Technology; and Jagan Gudimettla, Office of Pavement Technology and Mobile Concrete Lab.

