U.S. Department of Transportation
Federal Highway Administration
1200 New Jersey Avenue, SE
Washington, DC 20590
202-366-4000
Federal Highway Administration Research and Technology
Coordinating, Developing, and Delivering Highway Transportation Innovations
 |
| This report is an archived publication and may contain dated technical, contact, and link information |
|
Federal Highway Administration > Publications > Research > Structures > A Laboratory and Field Study of Composite Piles for Bridge Substructures |
Publication Number: FHWA-HRT-04-043 |
Previous | Table of Contents | Next
The lack of long-term performance and durability data of composite piles is an important concern that must be addressed to permit confidence in the use of these piles for long-term load-bearing applications. Consequently, a durability study was undertaken to assess the rate degradation of mechanical properties (strength and stiffness) of commercially available glass FRP (GFRP) tubes used to fabricate concrete-filled FRP composite piles. The study focused on the degradation effects of moisture absorption and exposure to freeze-thaw cycles.
The durability study was carried out on four FRP tubes supplied by two manufacturers of FRP composite piles. The laboratory degradation study included FRP shell characterization, determination of baseline mechanical properties, measurement of moisture absorption as a function of time, measurement of mechanical properties as a function of moisture absorption, and mechanical properties as a function of exposure to freeze-thaw cycles. The methodology and results of this durability study are presented in this chapter. The durability study did not include the steel-reinforced plastic pile because this pile type was initially not included in the scope of this project, and was only included for field testing after the late withdrawal of one of the FRP composite pile manufacturers.
Some of the factors that contribute to the degradation of the GFRP composites over time include temperature, sunshine (UV rays), moisture absorption, freeze-thaw cycles, and load (Garcia, et al., 1998, Nishizaki and Meiarashi 2002). Among these factors, the influence of moisture absorption and exposure to freeze-thaw cycles are considered to be the most critical factors. Exposure to alkaline environments and UV radiation also affect long-term durability, but to a lesser extent. Furthermore, UV degradation resistance of most composites is being improved by applying protective coats and additives during the manufacturing process. The degradation mechanisms related to moisture absorption and freeze-thaw cycles are discussed below.
Degradation due to moisture absorption may significantly reduce the life of FRP composites. The influence that moisture absorption has on the mechanical properties of GFRP composites is well documented (e.g., Shen and Springer 1976, Garcia, et al., 1998, Prian and Barkatt 1999, Verghese, et al., 1999, Shao and Kouadio 2002, Phifer 2003). Absorbed moisture can cause pronounced changes in modulus, strength, and strain to failure (Springer, et al., 1980). Moisture content of submerged FRP composites increases through diffusion. The absorbed moisture can act as a plasticizer of the composite resin, and can cause matrix cracking, fiber-matrix debonding, and corrosion of glass fibers (stress corrosion) (Garcia, et al., 1998). These effects result in a reduction of strength and stiffness of the FRP composite. For example, Phifer (2003) recorded tensile strength and stiffness reductions on the order of 60 percent and 10 percent, respectively, for E-glass/vinyl ester composites submerged in fresh water for a period of about 2 years. The author projected FRP tensile strength loss of about 80 percent after 50 years' submergence. The implications of such strength reductions on the design of composite piles can be significant.
In addition to submergence time, temperature and stress level also influence the amount of moisture that FRP will absorb while submerged. The moisture absorption increases with increasing water temperature and stress level. Evidence of the existence of damage to FRP composites after submergence in water has been found in SEM images (e.g., figure 9), where fiber damage and crack formation at the fiber-matrix interface were observed (McBagonluri, et al., 2000).
Freeze-thaw cycles can also degrade FRP composite properties. The degradation due to freeze-thaw cycling is primarily related to microcracking caused by the volume increase of the absorbed water in the composite (Verghese, et al., 1999). The mechanical properties of the composite are also affected by cold temperatures and by the cycling process (Karbhari 2002).
The FRP shell will potentially be exposed to chemical agents as a result of the alkaline pore water from the concrete inside the FRP shell. Karbahari, et al. (2002), studied the effect of concrete-based alkali solutions on the durability of vinylester GFRP composites. The authors found evidence of significant degradation and strength loss due not only to moisture absorption but also to the exposure to the high pH levels and characteristic solution chemistry of concrete pore fluid. The experimental durability program carried out for this study did not include investigation of possible degradation effects due to exposure to concrete pore fluid solutions.
A concrete-filled FRP composite pile installed in tidal and marine environments would be exposed to salt water. However, McBagonluri, et al. (2000), found that the rate of strength loss was not significantly affected by salt content, but rather by absorption of moisture. Therefore, the durability experiments carried out for this study were performed using fresh water.
The general approach used in this study was to track moisture diffusion into the material and to evaluate the degradation of the mechanical properties of the different FRP shells as a function of submergence time and moisture absorption. The loss of material strength and stiffness is then related to the long-term structural capacity of the pile using conventional structural models for FRP composite piles available in the literature (e.g. Fam and Rizkalla 2000, Mirmiran 1999), as summarized in chapter 2. The study described herein does not include effects of creep or chemical attack as a result of the presence of the concrete infill in the composite pile. Changes in the concrete properties with time (e.g., possible increases or decreases in strength and/or stiffness) were not included in this study.
Commercially available FRP tubes from two manufacturers that specialize in concrete-filled FRP composite piles were used for the durability experimental program. Tubes with 0.305-m (12-inch) and 0.610-m (24-inch) nominal diameter were tested. The results presented here are based on tests carried out on their standard FRP tube designs. It should be noted, however, that both pile manufacturers have the flexibility to modify the FRP composite shell laminate architecture (including number of layers, fiber orientation, and resin and fiber types) to better suit the load demands of a specific project.
The following subsections provide detailed descriptions of the tubes from each manufacturer, including dimensions, material, number of layers, laminate structure, fiber volume fraction, and manufacturing technique.
The two sizes of tubes supplied by Lancaster Composites, Inc. were fabricated by Ameron International Corporation. The FRP tubes were manufactured using the filament-winding technique, in which E-Glass continuous fiber rovings are impregnated with resin (epoxy or polyester) and wound over a rotating steel mandrel, following a predetermined winding pattern.
Characterization of the FRP tubes was based on visual inspection, information supplied by the manufacturers, and burnoff tests on coupon samples. The burnoff tests were performed in general accordance with ASTM Standard D2584. The burnoff test results and other characterization information are provided in tables 17 and 18 for the 12- and 24-inch (0.31- and 0.61-m) diameter tubes, respectively.
|
Manufacturer pile designation |
CP40 12-inch |
|---|---|
|
Nominal diameter |
305 mm (12 in) |
|
Measured outside diameter |
324.7 ± 1.9 mm (1) |
|
Total wall thickness |
6.05 ± 0.14 mm (1) |
|
Liner thickness |
0.59 ± 0.05 mm (1) |
|
Liner material |
Epoxy resin sandwiched between industrial paper |
|
Unit weight of tube |
17.45 kN/m3 |
|
Fiber type |
Owen Corning Type 30 113 Yield E-glass |
|
Matrix resin type |
Epoxy anhydrite hardener/Dow Der 331 (83/100 ratio) |
|
Fiber layup angles |
[-88o/+8 o /-88 o /+8 o /-88/+8 o /-88 o/+8 o /-88]T (2) |
|
Fiber layer average thicknesses |
[0.54/0.69/0.54/0.69/0.54/0.69/0.54/0.69/0.54] (mm) |
|
Total resin fraction by weight |
38.6% |
|
Total fiber fraction by volume |
45.8 ± 1.0% (1), (3) |
|
Fiber volume fraction 88o layers |
38.4 ± 1.0% (1) |
|
Fiber volume fraction 8o layers |
55.8 ± 0.3% (1) |
|
Percentage of fiber at 88o |
40.1 ± 0.6% (1) (by weight) |
|
Percentage of fiber at 8o |
59.9 ± 0.6% (1) (by weight) |
Notes: (1) Mean standard deviation. 1 mm = 0.039 inch
(2) Angles are measured with respect to pile longitudinal axis.
Subscript T indicates orientation for the layers of the total
laminate are presented within the brackets.
(3) Based on volume of FRP laminate only; liner is excluded from
volume.
|
Manufacturer pile designation |
CP40 24-inch |
|---|---|
|
Nominal diameter |
610 mm (24 in) |
|
Measured outside diameter |
625 ± 1.8 mm (1) |
|
Total wall thickness |
7.35 ± 0.23 mm (1) |
|
Liner thickness |
1.68 ± 0.09 mm (1) |
|
Liner material |
C-veil, a chopped fiber mat and resin |
|
Unit weight of tube |
17.36 kN/m3 |
|
Fiber type |
Owen Corning Type 30 113 Yield E-glass |
|
Matrix resin type |
Ashland Chemical Apropol 7241 isophtalic acid polyester resin |
|
Fiber layup angles |
[+35o/-35 o /+85 o /+35 o /-35 o]T (2) |
|
Fiber layer average thicknesses |
[1.13/1.13/1.13/1.13/1.13] (mm) |
|
Total resin fraction by weight |
39.3% |
|
Total fiber fraction by volume |
51.2 ± 2.4% (1), (3) |
|
Fiber volume fraction ± 35o layers |
52.7 ± 2.9% (1) |
|
Fiber volume fraction 85o layers |
45.5 ± 1.0% (1) |
Notes: (1) Mean ± standard deviation. 1 mm = 0.039 inch
(2) Angles are measured with respect to pile longitudinal axis.
Subscript T indicates orientation for the layers of the total
laminate are presented within the brackets.
(3) Based on volume of FRP laminate only; liner is excluded from
volume.
The 0.305-m (12-inch) nominal diameter tube has an outer diameter of 325 mm (12.8 inches) and an average total wall thickness of 6.05 mm (0.238 inches). The tube has a 0.59-mm (0.023-inch) thick liner at the inner surface, which results in a net structural wall thickness of 5.46 mm (0.215 inches). The wall structure of the tube consists of nine layers of fibers oriented at -88 degrees and +8 degrees with respect to the longitudinal axis of the tube. The stacking sequence of the layers is [-88o/+8o /-88o /+8o /-88o/+8o / -88o/+8o /-88o]T (subscript T indicates the stacking sequence for the total FRP laminate is presented within the brackets). The layers with fibers oriented at -88 degrees with respect to the longitudinal axis are 0.54-mm (0.021-inch) thick, and the layers with fibers oriented at +8 degrees with the respect to the longitudinal axis are 0.69 mm (0.027 inches). The FRP tube liner is composed of overlapped industrial paper impregnated with epoxy resin, and is about 0.59 mm (0.023 inches) thick. The average overall fiber volume fraction of this tube is 45.8 percent. The matrix resin for this FRP tube consisted of Dow D.E.R. 331 epoxy mixed with anhydrite hardener. The fiber type was Owens Corning Type 30 113 Yield E-Glass rovings.
The 0.610-m (24-inch) nominal diameter tube has an outer diameter of 625 mm (24.6 inches) and an average total wall thickness of 7.35 mm (0.289 inches). The tube has a 1.68-mm (0.066-inch) thick liner at the inner surface, which results in a net structural wall thickness of 5.67 mm (0.223 inches). The wall structure of the tube consists of five layers of fibers oriented at [+35o/-35o/+85o/+35o/-35 o]T, measured with respect to the longitudinal axis of the tube. The fiber layers are about 1.13 mm (0.044 inches) thick. The FRP tube liner is composed of C-veil and a mat of chopped fiber impregnated with resin, and is about 1.68 mm (0.066 inches) thick. The average overall fiber volume fraction of this tube is 51.2 percent. The matrix resin for the 0.610-m (24-inch) FRP shell was isophthalic acid polyester resin (Ashland Chemical Apropol 7241). The fiber type was Owens Corning Type 30 113 Yield E-Glass rovings.
Two FRP tube sizes were supplied by Hardcore Composites. The tubes had 12-inch and 24-inch (0.31-m and 0.61-m) nominal diameters and were fabricated at its manufacturing plant in New Castle, DE. Both FRP tubes sizes were fabricated using a vacuum assisted resin transfer molding (VARTM) process. The matrix resin used in the tubes is Dow vinyl ester Derakane resin, and the fiber reinforcing consists of plies of stitch-bonded multiaxis glass fiber fabric. Each ply includes four layers of fibers oriented at 0, +45, -45, and 90 degrees with respect to the longitudinal axis of the tube.
Characterization of the FRP tubes was based on visual inspection, information supplied from the manufacturer, and burnoff tests performed on coupon samples. The burnoff tests were carried out in general accordance with ASTM Standard D2584. Characterization information, including burnoff test results, are provided in tables 19 and 20 for the 12- and 24-inch (0.31- and 0.61-m) diameter tubes, respectively.
|
Manufacturer pile designation |
12-3 |
|---|---|
|
Nominal diameter |
305 mm (12 in) |
|
Measured outside diameter |
321.7 ± 3.8 mm (1) |
|
Total wall thickness |
5.66 ± 0.28 mm (1) |
|
Liner thickness |
0.68 ± 0.11 mm (1) |
|
Liner material |
Screen |
|
Unit weight of tube |
18.6 kN/m3 |
|
Fiber type |
E-glass multiaxis fabric type Quad Q-9100. 4 stitched layers oriented at [0o/+45o/-45o/90o] (2) |
|
Matrix resin type |
Dow vinyl ester Derakane resin |
|
Number of multiaxis plies |
3 x [0o/+45o/ -45o/90o] (2) |
|
Multi-axis fiber layer thicknesses |
1.66 ± 0.11 mm (1) |
|
Total resin fraction by weight |
28.2% |
|
Total fiber fraction by volume |
52.8 ± 0.1% (1), (3) |
|
Fiber volume fraction 0o layers |
60.6 ± 2.6% (1) |
|
Fiber volume fraction ±45o layers |
41.7 ± 6.7% (1) |
|
Fiber volume fraction 90o layers |
34.2 ± 8.3% (1) |
|
Percentage of fiber at 0o |
56.1 ± 1.4% (1) (by weight) |
|
Percentage of fiber at ±45o |
37.1 ± 1.1 % (1) (by weight) |
|
Percentage of fiber at 90o |
6.8 ± 0.3 % (1) (by weight) |
Notes: (1) Mean ± standard deviation.
(2) Angles are measured with respect to pile longitudinal
axis.
(3) Based on volume of FRP laminate only; liner is excluded from
volume. 1 mm = 0.039 inch
|
Manufacturer pile designation |
24-4 |
|---|---|
|
Nominal diameter |
610 mm (24 in) outside |
|
Measured outside diameter |
622 ± 1.6 mm (1) |
|
Total wall thickness |
8.86 ± 0.68 mm (1) |
|
Liner thickness |
0.68 ± 0.15 mm (1) |
|
Liner material |
Screen |
|
Unit weight of tube |
18.67 kN/m3 |
|
Fiber type |
E-glass multiaxis fabric type Quad Q-9100. 4 stitched layers oriented at [0o/+45o/-45o/90o] (2) |
|
Matrix resin type |
Dow vinyl ester Derakane resin |
|
Number of multi-axis plies |
4 x [0o/+45o/ -45o/90o] (2) |
|
Multiaxis fiber layer thicknesses |
2.05 ± 0.14 mm (1) (mm) |
|
Total resin fraction by weight |
28.6% |
|
Total fiber fraction by volume |
52.1 ± 0.5% (1), (3) |
|
Fiber volume fraction 0o layers |
61.2 ± 1.4% (1) |
|
Fiber volume fraction ±45o layers |
45.2 ± 0.6% (1) |
|
Fiber volume fraction 90o layers |
40.7 ± 1.1% (1) |
|
Percentage of fiber at 0o |
53.9 ± 0.7% (1) (by weight) |
|
Percentage of fiber at ±45o |
38.9 ± 0.8% (1) (by weight) |
|
Percentage of fiber at 90o |
7.3 ± 0.1% (1) (by weight) |
Notes: (1) Mean ± standard deviation.
(2) Angles are measured with respect to pile longitudinal
axis.
(3) Based on volume of FRP laminate only; liner is excluded from
volume. 1 mm = 0.039 inch
The 305-mm (12-inch) nominal diameter tube has an outer diameter of 322 mm (12.7 inches) and a total wall thickness of 5.66 mm (0.223 inches). The tube has a 0.68-mm (0.027-inch) thick liner at the inner surface, which results in a net structural wall thickness of 4.98 mm (0.196 inches). The wall structure of the tube consists of three layers of multiaxis fabric. Each fabric layer consists of four layers of fibers oriented at [0o/90o /+45o/-45o]. The symbol typically used to designate this fiber lay-up is [0o/90o /+45o/-45o]3T (where the subscript 3T indicates the FRP laminate is composed of three plies each with four layers oriented at 0o/90o /+45o/-45o). The average thickness of the multiaxis fabric layers is 1.66 mm (0.065 inches). The average thicknesses of the layers with fibers oriented at ± 45, 0, and 90 degrees with respect to the longitudinal axis of the tube are 0.74 mm (0.029 inches), 0.76 mm (0.030 inches), and 0.16 mm (0.006 inches), respectively. The FRP tube liner is composed of a plastic screen material used to facilitate the injection of resin during the manufacturing process. The average overall fiber volume fraction of these tubes was measured to be 52.8 percent.
The 610-mm (24-inch) nominal diameter tube has an outer diameter of 622 mm (24.5 inches) and a total wall thickness of 8.86 mm (0.349 inches). The tube has a 0.68-mm (0.027-inch) thick liner at the inner surface, which results in a net structural wall thickness of 8.18 mm (0.322 inches). The wall structure of the tube consists of four layers of multiaxis fabric. Each fabric layer consists of four layers of fibers oriented at [0o/90o /+45o/-45o]. The symbol typically used to designate this type of fiber layup is [0o/90o /+45o/-45o]4T (where the subscript 4T indicates the FRP laminate is composed of four plies each with four layers oriented at 0o/90o /+45o/-45o). The average thickness of the multiaxis fabric layers is 2.05 mm (0.081 inches). The average thicknesses of the layers with fibers oriented at ±45, 0, and 90 degrees with respect to the longitudinal axis of the tube are 0.92 mm (0.036 inches), 0.94 mm (0.037 inches), and 0.19 mm (0.007 inches), respectively. The average overall fiber volume fraction of these tubes was measured to be 52.1 percent.
The test procedures and apparatus used in this durability study are described in this subsection.
As indicated earlier, coupons from the different FRP tubes investigated were subjected to burnoff tests to determine information such as fiber volume content, resin content, the number of fiber layers, and orientations. The tests were carried out in general accordance with ASTM Standard D2584. The tests consist of heating coupon samples from the FRP tubes in a furnace oven to a temperature of about 550 oC (1022 oF). The heat from the oven is used to burn the resin matrix, leaving the fiber layers exposed. The oven used for burnoff testing is shown in figure 39a. An FRP coupon sample after resin burnoff is shown in figure 39b. The number of fiber layers and orientation can be determined from this test, as shown in figure 39b.
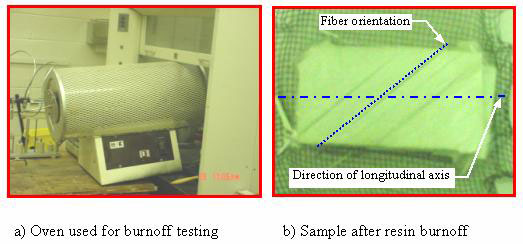
Figure 39. Photos. Burnoff testing.
Axial tensile properties were evaluated using tensile tests performed on FRP samples in accordance with ASTM Test Method for Tensile Properties of Polymer Matrix Composite Materials (D3039). Test specimen strips were cut in the longitudinal direction using a water-cooled saw. The average test specimen dimension was 25 mm by 200 mm (0.98 inch by 7.8 inch). The tests were carried out using an INSTRON® test frame operated at a constant rate of displacement of 1.27 mm/min (0.05 inches/min). Axial strain was measured primarily with the use of extensometers; however, selected samples were also instrumented with strain gages. A typical tension test setup is shown in figure 40.
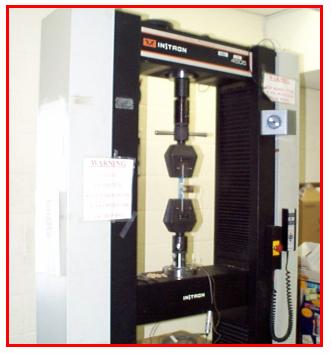
Figure 40. Photo. Typical tension test setup.
Tensile properties in the hoop direction were evaluated using the split disk test method. The split disk fixtures were custom made to fit the two FRP tube diameter sizes investigated in this study. The split disk tests were performed in accordance with ASTM Test Method for Apparent Hoop Tensile Strength of Plastic or Reinforced Plastic Pipe by Split Disk Method (D2290). Split disk specimens were precision cut from the FRP shells with a nominal width of 40 mm (1.6 inches). The tests were carried out using a 534 kN Tinius-Olsen machine and an INSTRON test frame at a constant rate of displacement of 2.5 mm/min (0.1 inches/min). The typical split disk test setup is shown in figure 41.
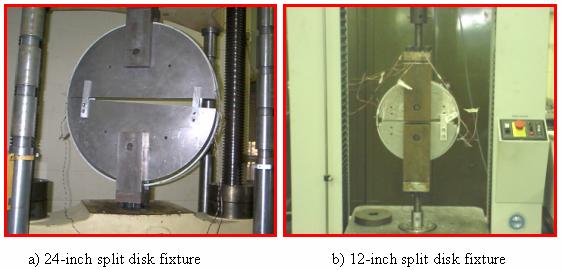
Figure 41. Photos. Typical split disk test
setup.
Saturated FRP specimens were subjected to freeze-thaw cycles using a programmable freeze-thaw chamber shown in figure 42.
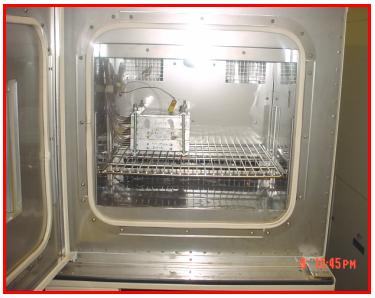
Figure 42. Photo. Freeze-thaw chamber.
The FRP specimens were fitted into special freeze-thaw fixtures that loaded the specimens in four-point bending. This arrangement was chosen to approximate the bending moment present in piles near the pile cap. The fixture used is shown in figure 43. Use of this fixture resulted in tensile strains in the outer extreme fiber of the 24-inch diameter tube specimens ranging from 2,800 to 5,500 microstrains. The specimens from the 12-inch tubes were subjected to freeze-thaw cycles in an unloaded state, i.e., unstrained. The chamber was programmed to produce approximately 10 freeze-thaw cycles per day. A typical freeze-thaw cycle is shown in figure 44. Specimens were subjected to 100, 300, and 500 freeze-thaw cycles. As a point of interest, Southwest Virginia experiences about 50 freeze-thaw cycles per year (i.e., 500 freeze-thaw cycles in about 10 years).
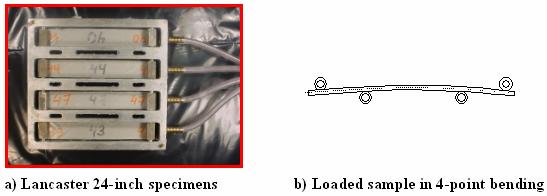
Figure 43. Photo and Illustration. Freeze-thaw
fixture.
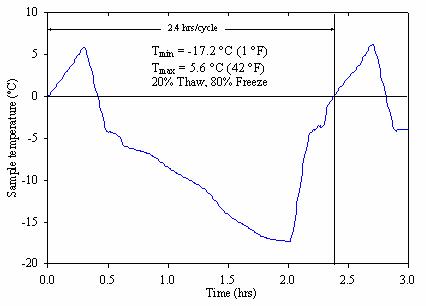
Figure 44. Graph. Average freeze-thaw cycle undergone by
FRP samples.
More details on the freeze-thaw study are presented later in this chapter.
To study the durability and long-term performance of FRP composite piles, it was necessary to first evaluate the baseline mechanical properties of the FRP shell in the longitudinal (axial) and hoop directions.
The baseline properties of each pile type were obtained from a series of longitudinal tension tests, and the results are summarized in table 21. Typical stress-strain curves obtained from these tests for each FRP type are shown in figure 45.
|
Property |
Lancaster FRP |
Hardcore FRP tube |
|||
|---|---|---|---|---|---|
|
24-inch |
12-inch |
24-inch |
12-inch |
||
|
Tensile strength (MPa) (1) |
Mean |
113.1 |
249.3 |
432.2 |
494.3 |
|
SD (3) |
7.3 |
17.7 |
46.9 |
60.6 |
|
|
Peak strain (%) |
Mean |
1.02 |
1.70 |
1.86 |
1.78 |
|
SD |
0.1 |
0.25 |
0.27 |
0.12 |
|
|
Initial modulus (Gpa) (2) |
Mean |
14.8 |
23.2 |
27.3 |
29.6 |
|
SD |
1.9 |
2.1 |
3.15 |
0.9 |
|
|
Number of specimens |
N |
29 |
9 |
9 |
5 |
Notes: (1) Strength calculated using total thickness of FRP tube
(includes liner).
(2) Initial modulus calculated between 0 and 4,000
microstrains.
(3) SD = Standard deviation
(4) 1 inch = 25.4 mm; 1 MPa = 145 lbf/inch2; 1 GPa =
145,000 lbf/inch2
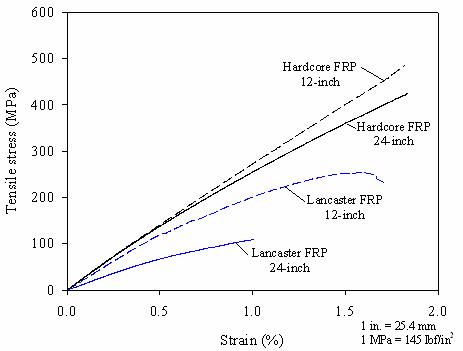
Figure 45. Graph. Representative baseline longitudinal
tension stress-strain curves.
The baseline hoop tensile properties for the composite piles are summarized in table 22. Typical stress-strain curves obtained from split disks tests are shown in figure 46.
Table 22. As-received hoop tensile properties.
|
Property |
Lancaster FRP |
Hardcore FRP |
||
|---|---|---|---|---|
|
24-inch |
12-inch |
12-inch |
||
|
Tensile strength (MPa) (1) |
Mean |
121.4 |
195.2 (2) |
93.5 |
|
SD (5) |
5.9 |
15.9 |
7.9 |
|
|
Peak strain (%) |
Mean |
1.26 (3) |
1.28 |
1.45 |
|
SD |
0.34 |
0.10 |
0.40 |
|
|
Initial modulus (Gpa) (4) |
Mean |
19.1 |
16.5 |
11.9 |
|
SD |
2.3 |
2.2 |
3.1 |
|
|
Number of specimens |
N |
5 |
11 |
5 |
Notes: (1) Strength calculated using total thickness of FRP tube
(includes liner).
(2) The strain and modulus values are based only on the second
batch of tests that used inner and outer strain gages (5
tests).
(3) No inner gages were used for this test batch; hence strain
values are from outer gages only.
(4) Initial modulus calculated between 0 and 4,000
microstrain.
(5) SD = Standard deviation.
(6) 1 inch = 25.4 mm; 1 MPa = 145 lbf/inch2; 1 GPa =
145,000 lbf/inch2
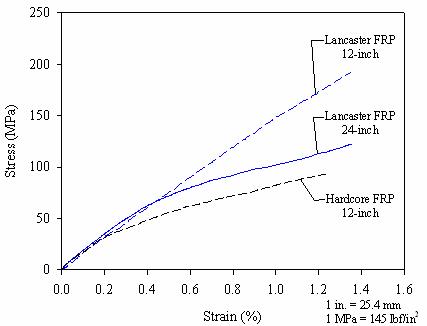
Figure 46. Graph. Representative baseline hoop tension
stress-strain curves.
It was not possible to perform split disk tests on the 24-inch (0.61 m) Hardcore FRP shell specimens due to the noncircular shape of the inside of these shell. Hardcore shells have several resin transfer tubes attached to the inner wall (running longitudinally) that are used to inject the resin into the composite during manufacturing of the FRP shell, and at the end of the process, the tubes are left in place filled with resin. The size and number of these tubes made it impractical to test these specimens, as the internal clearance is not circular.
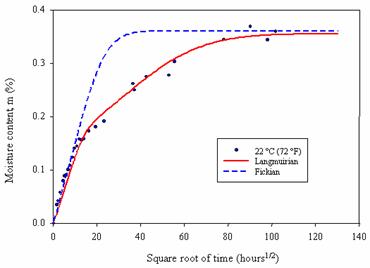
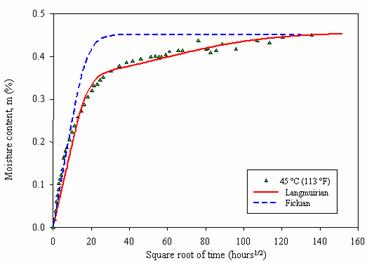
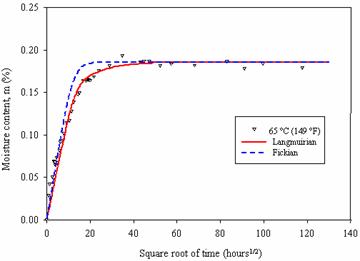
Moisture absorption isothermal curves were obtained by immersing samples in fresh water tanks at the following temperatures: 22 oC (72 oF), 35 oC (95 oF), 45 oC (113 oF), 55 oC (131 oF), 65 oC (149 oF), and 80 oC (176 oF). The submerged FRP coupons were about 100 mm (3.9 inches) long and 25 mm (0.98 inch) wide, with their edges epoxy-coated to promote one-dimension diffusion. Plots of moisture absorption versus time for the 12-inch and 24-inch (0.31-m and 0.61-m) diameter Lancaster FRP shells are shown in figures 47 and 48, respectively. Moisture absorption plots for the 12-inch and 24-inch (0.31-m and 0.61-m) diameter Hardcore FRP shells are shown in figures 49 and 50, respectively. The moisture content shown in these figures corresponds to the percentage of weight gain with respect to the initial weight of the samples before submergence.
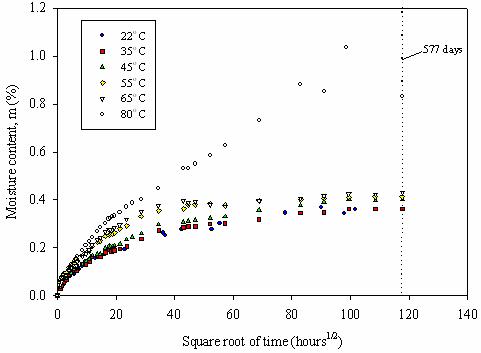
Figure 47. Graph. Absorption curves for Lancaster 12-inch
FRP tube.
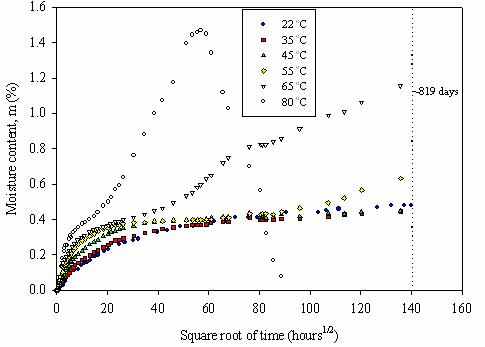
Figure 48. Graph. Absorption curves for Lancaster 24-inch
FRP tube.
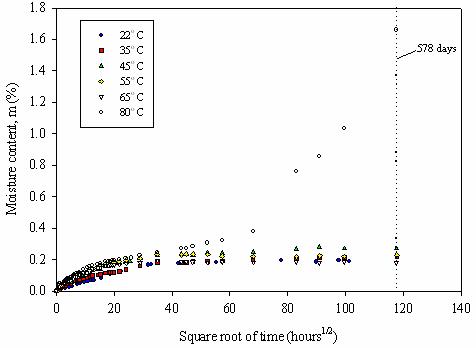
Figure 49. Graph. Absorption curves for Hardcore 12-inch
FRP tube.
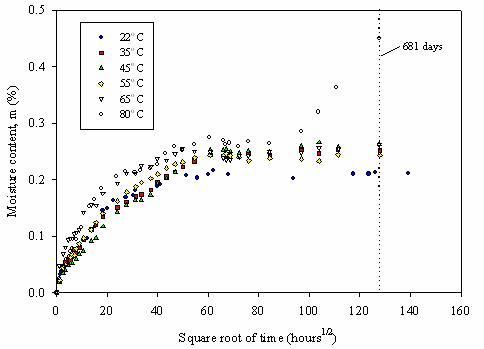
Figure 50. Graph. Absorption curves for Hardcore 24-inch
FRP tube.
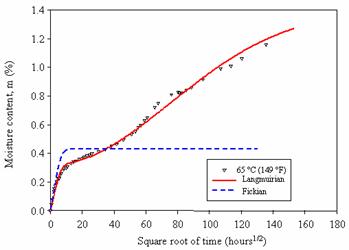
All moisture absorption tests showed a rapid gain of weight at the start of the experiments, with the rate of increase being the greatest at the highest temperature (80 oC (176 oF)). With time, most of the tests below 65 oC (149 oF) stabilized, reaching a saturation or equilibrium moisture content. For the tests at 80 oC (176 oF), the weights either continued to increase gradually, or in some cases like the Lancaster 24-inch (0.61-m) at 80 oC (176 oF), the samples started to decrease sharply in weight after reaching a peak. Nishizaki and Meiarashi (2002) reported similar decreases in moisture content for samples submerged at high temperatures. The authors attributed this behavior to loss of material from the composite matrix. The Lancaster 24-inch (0.61-m) samples with water temperatures between 55 and 65 oC (131 and 149 oF) seem to have a non-Fickian or two-stage absorption behavior. Phifer (2003) found that, in some cases, Langmuirian diffusion predicts the behavior of E-glass vinyl ester composites better than Fickian diffusion. Diffusion analyses using Fickian and Langmuirian models are presented in the following subsection.
Two types of diffusion models were used to fit the experimental absorption data: Fickian and Langmuirian. These models are described briefly below.
The Fickian diffusion model is commonly used to predict moisture absorption of composite materials. This model has the convenience of being simple. The model assumes a constant diffusivity, D, and a saturation moisture, M8, to which the sample tends to as the submergence time increases. The expression for Fickian diffusion of a thin plate of thickness, h, is given by the following expression (Shen and Springer 1976):
 (7)
(7)
where
Gurtin and Yatomi (1979) proposed using a Langmuirian diffusion model for FRP composites exhibiting non-Fickian absorption behavior. The following expression is given to track the moisture content of specimens following Langmuirian diffusion:
 (8)
(8)
where
The similarity of this model to the Fickian is evident from comparing equations 7 and 8. The first non-unity term in equation 8 is indicative of a two-stage diffusion process. More details on the Langmuirian model can be found in Gurtin and Yatomi (1979).
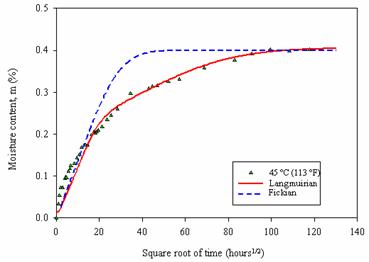
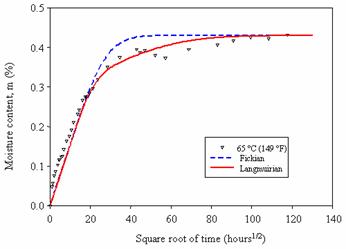
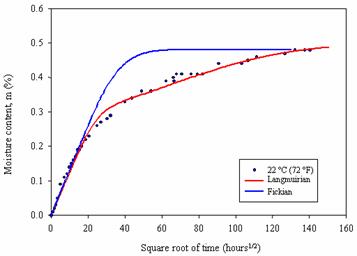
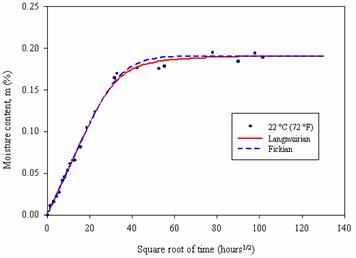
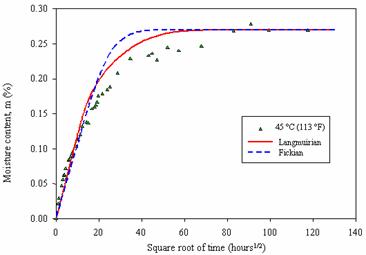
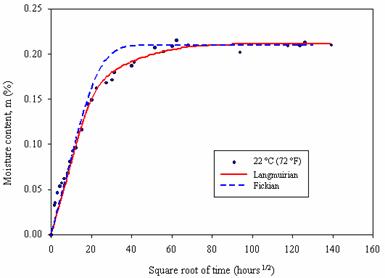
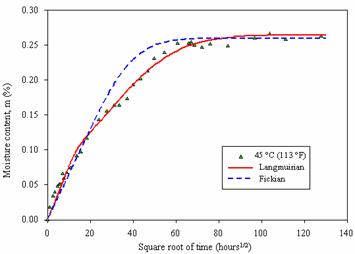
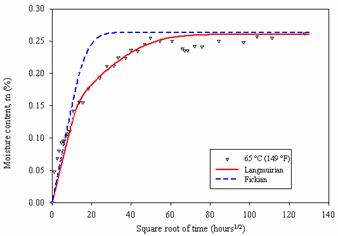
Curve fits using the Fickian and Langmuirian models were performed on the experimental moisture absorption data gathered for the different FRP shells evaluated in this study. The curve fits for water temperatures 22 oC (72 oF), 45 oC (113 oF), and 65 oC (149 oF) are shown in figures 51 and 52 for the 12-inch and 24-inch (0.31-m and 0.61-m) diameter Lancaster FRP shells, respectively. Fits for these same water temperatures for the 12-inch and 24-inch (0.31-m and 0.61-m) diameter Hardcore FRP shells are shown in figures 53 and 54, respectively.
|
(a) Water at 22 oC |
|
(b) Water at 45 oC |
|
(c) Water at 65 oC |
Figure 51. Graphs. Selected diffusion analyses for Lancaster 12-inch FRP samples.
|
(a) Water at 22 oC |
|
(b) Water at 45 oC |
|
(c) Water at 65 oC |
Figure 52. Graphs. Selected diffusion analyses for Lancaster 24-inch FRP samples.
|
(a) Water at 22 oC |
|
(b) Water at 45 oC |
|
(c) Water at 65 oC |
Figure 53. Graphs. Selected diffusion analyses for Hardcore 12-inch FRP samples.
|
(a) Water at 22 oC |
|
(b) Water at 45 oC |
|
(c) Water at 65 oC |
Figure 54. Graphs. Selected diffusion analyses for Hardcore 24-inch FRP samples.
These figures indicate that Langmuirian diffusion, which has
four curve-fitting parameters (D, M8, ![]() ,
, ![]() ), is better able to
track the measured moisture absorption than the Fickian diffusion,
which has two curve-fitting parameters (D, M8), for
samples submerged at temperatures between 55 and 80 oC
(131 and 176 oF).
), is better able to
track the measured moisture absorption than the Fickian diffusion,
which has two curve-fitting parameters (D, M8), for
samples submerged at temperatures between 55 and 80 oC
(131 and 176 oF).
The diffusivity (or diffusion coefficient D) and the saturation moisture content (M8) obtained from Fickian diffusion analyses are summarized in tables 23 through 26 for the Lancaster 12-inch (0.31-m), Lancaster 24-inch (0.61-m), Hardcore 12-inch (0.31-m), and Hardcore 24-inch (0.61-m) samples, respectively. Although there is much scatter in the values, it can be seen in the tables that the diffusivity and the saturation moisture tend to increase with temperature. Even though Langmuirian diffusion provided a better fit to the data, the Fickian model and parameter values are used for predicting the long-term composite pile strength, as described later in this chapter, because of the simplicity of the Fickian model.
|
Water Temperature (oC) |
Diffusivity, D (cm2/hr) |
Saturation Moisture, M 8 (%) |
|---|---|---|
|
22 |
1.25 E-4 |
0.36 |
|
35 |
1.53 E-4 |
0.36 |
|
45 |
8.57 E-5 |
0.40 |
|
55 |
1.21 E-4 |
0.42 |
|
65 |
9.22 E-5 |
0.43 |
|
80 |
3.38 E-5 |
0.87 (1) |
Note: (1) Did not stabilize at the end of test; value is only
used for curve fitting Fickian curves to data.
(2) 1 cm2 = 0.15 inch2
|
Water Temperature (oC) |
Diffusivity, D (cm2/hr) |
Saturation Moisture, M8 (%) |
|---|---|---|
|
22 |
1.23 E-5 |
0.48 |
|
35 |
2.04 E-5 |
0.45 |
|
45 |
4.89 E-4 |
0.45 |
|
55 |
1.48 E-4 |
0.40 (1) |
|
65 |
3.08 E-4 |
0.43 (1) |
|
80 |
4.59 E-4 |
0.45 (1) |
Note: (1) Did not stabilize at the end of test; value is only
used for curve fitting Fickian curves to data.
(2) 1 cm2 = 0.15 inch2
|
Water Temperature (o C) |
Diffusivity, D (cm2/hr) |
Saturation Moisture, M 8 (%) |
|---|---|---|
|
22 |
8.17 E-6 |
>0.19 |
|
35 |
1.99 E-5 |
>0.19 |
|
45 |
1.52 E-5 |
>0.27 |
|
55 |
4.81 E-5 |
>0.22 |
|
65 |
6.08 E-5 |
>0.18 |
|
80 |
1.17 E-5 |
>0.50 (1) |
Note: (1) Did not stabilize at the end of test; value is only
used for curve fitting Fickian curves to data.
(2) 1 cm2 = 0.15 inch2
Table 26. Fickian diffusion parameters for the Hardcore 24-inch FRP.
|
Water Temperature (oC) |
Diffusivity, D (cm2/hr) |
Saturation Moisture, M 8 (%) |
|---|---|---|
|
22 |
1.16 E-4 |
>0.21 |
|
35 |
7.85 E-5 |
>0.26 |
|
45 |
4.42 E-5 |
>0.26 |
|
55 |
9.54 E-5 |
>0.24 |
|
65 |
2.30 E-4 |
>0.26 |
|
80 |
1.70 E-4 |
>0.26 (1) |
Note: (1) Did not stabilize at the end of test, value is only
used for curve fitting Fickian curves to data.
(2) 1 cm2 = 0.15 inch2
The effect of time of submergence and moisture on the mechanical properties of the FRP tubes was evaluated by performing longitudinal and hoop tension tests on specimens aged in 22 oC (72 oF) water for submergence times ranging between 4 and 787 days. Typically, five or more specimens were tested at each submergence period. The tests were carried out using the same procedure used to determine the baseline properties.
Variations of the mechanical properties of the aged FRP samples are presented in the following subsections. The results presented are normalized with respect to the baseline property values.
Variations of the longitudinal and hoop properties versus submergence time for this FRP shell are shown in figures 55 and 56, respectively. The error bars shown in these figures correspond to ± one standard deviation. Longitudinal tensile test results on this particular FRP composite shell showed no evidence of significant degradation of property values. This is likely related in part to the fiber orientation of this composite (±35o/85o/±35o)T, which makes it a matrix-dominated composite in the longitudinal direction, and also possibly due to a gain of ductility of the matrix upon immersion in water. Tensile properties in the hoop direction showed some degradation, but it was not very significant. The hoop tensile strength decreased by about 8 percent. The error bars shown in these figures indicate considerable scatter.
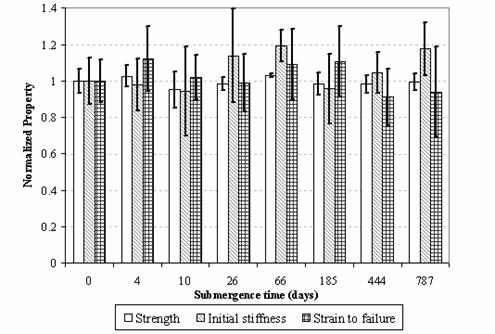
Figure 55. Graph. Longitudinal tensile properties versus
submergence time for Lancaster 24-inch FRP tube.
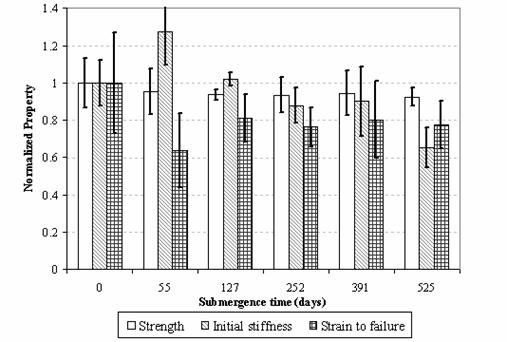
Figure 56. Graph. Hoop tensile properties versus
submergence time for Lancaster 24-inch FRP tube.
The longitudinal and hoop properties versus submergence time for this FRP shell are shown in figures 57 and 58, respectively.
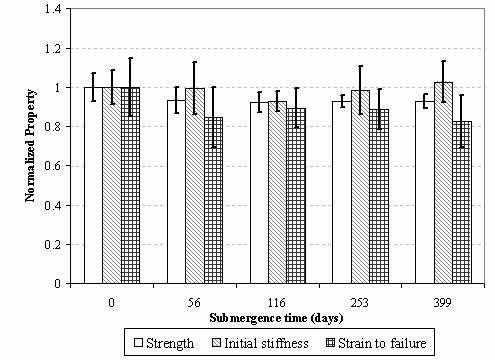
Figure 57. Graph. Longitudinal tensile properties versus
submergence time for Lancaster 12-inch FRP tube.
Figure 57 shows that after approximately 400 days of submergence in fresh water at 22 oC (72 oF), the longitudinal tensile strength and strain to failure decreased about 9 and 18 percent, respectively. The initial stiffness (in the 0 to 4,000 microstrains range) remained almost constant.
Figure 58. Graph. Hoop tensile properties versus
submergence time for Lancaster 12-inch FRP tube.
Figure 58 shows that the hoop tensile strength and initial stiffness decreased about 17 percent and 18 percent, respectively. Degradation levels for strength and stiffness are more significant for the 12-inch (0.31-m) sample compared to the 24-inch (0.61-m) sample, because the fiber layup of the 12-inch (0.31-m) composite is more fiber dominated. However, the strain to failure did not change much.
Strength and stiffness versus percentage of moisture absorption are shown in figures 59 and 60 for the longitudinal and hoop directions, respectively. Both figures show tensile strength decreases with increasing moisture content, but the strength values tend to stabilize at higher moisture contents. The hoop tensile stiffness displayed a similar behavior, as shown in figure 60b. These plots are useful for predicting mechanical properties versus time, as shown later in this chapter.
Figure 59. Charts. Longitudinal tensile properties versus
moisture content for Lancaster 12-inch tube.
Figure 60. Charts. Hoop tensile properties versus moisture
content for Lancaster 12-inch FRP tube.
The longitudinal properties versus submergence time for this FRP shell are shown in figure 61.
Figure 61. Graph. Longitudinal tensile properties versus
submergence time for Hardcore 24-inch FRP tube.
Figure 61 shows that after approximately 636 days of submergence in fresh water at 22 oC (72 oF), the longitudinal tensile strength decreased about 13 percent. The strain to failure decreased by about 20 percent. The initial stiffness values (0 to 4,000 microstrains) did not show a clear trend with respect to the baseline values. The error bars shown indicate that the strain and stiffness values had considerable scatter.
The variation of the longitudinal tensile strength and stiffness versus percentage of moisture absorption are shown in figure 62. This figure shows a tensile strength loss of about 16 percent at the highest moisture content value of 0.33 percent. The initial stiffness values show considerable scatter, and no clear trend can be determined.
Figure 62. Charts. Longitudinal tensile properties versus
moisture content for Hardcore 24-inch FRP tube.
The longitudinal and hoop tensile properties versus submergence time for this FRP shell are shown in figures 63 and 64, respectively.
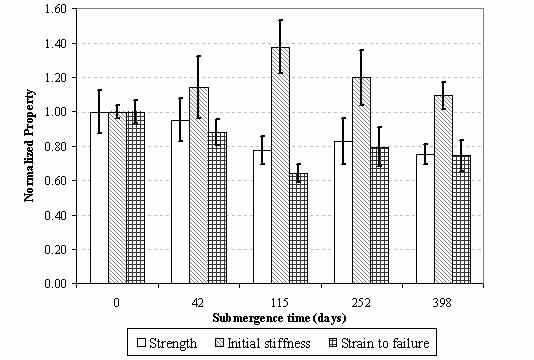
Figure 63. Graph. Longitudinal tensile properties versus
submergence time for Hardcore 12-inch FRP tube.
Figure 63 shows that after approximately 398 days of submergence in fresh water at 22 oC (72 oF), the longitudinal tensile strength and strain to failure decreased by about 24 percent and 25 percent, respectively. The initial stiffness increased by about 10 percent.
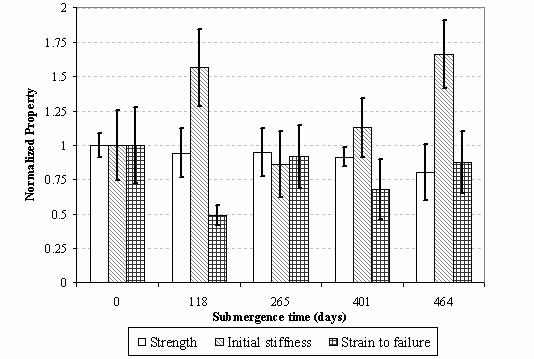
Figure 64. Graph. Hoop tensile properties versus
submergence time for Hardcore 12-inch FRP tube.
Figure 64 shows that after approximately 464 days of submergence in fresh water at 22 oC (72 oF), the hoop tensile strength decreased by about 20 percent. The stiffness and strain-to-failure values showed very high scatter. This could be related to material variability. Another possible reason could be related to the infusion tubes used to inject the resin during manufacturing of the FRP tubes. These tubes were removed prior to hoop split disk testing; however, at these locations the FRP shell wall thickness increased and decreased sharply within a small distance. It is possible that high stress concentrations occurred at these locations and affected the results.
The variation of tensile strength and stiffness versus percentage of moisture absorption for the longitudinal and hoop directions are shown in figures 65 and 66, respectively.
Figure 65. Charts. Longitudinal tensile properties versus
moisture content for Hardcore 12-inch FRP tube.
As shown in figure 65a, the longitudinal tensile strength decreases with increasing moisture content. The maximum tensile strength degradation was about 25 percent at a moisture content of about 0.25 percent. No clear trend was observed between longitudinal tensile modulus and moisture content.
Figure 66. Charts. Hoop tensile properties versus moisture
content for Hardcore 12-inch FRP tube.
Figure 66 shows very high scatter for hoop tensile strength and stiffness, hence no clear relationship was observed with moisture content. As mentioned before, the high scatter in the hoop tensile properties for the 12-inch (0.31-m) Hardcore shell could be related to material variability, and the sharp variations of FRP shell wall thickness near the location of the resin infusion tubes may have created high stress concentrations and affected the results.
Longitudinal tensile tests were performed on saturated coupon samples after 0, 100, 300, and 500 freeze-thaw cycles. The saturated coupons refer to specimens that were soaked in 22 oC (72 oF) water until they reached moisture content at saturation, that is, M8 (see figures 47 through 50 for the time of soaking required to reach M8). Three or more samples were tested at each stage. The typical temperature cycle undergone by the specimens is shown in figure 44. The specimens were cycled between -17 oC (1.4 oF) and +6 oC (43 oF), and the duration of each cycle was about 2.4 hours. The test setup is described in section 4.3.2.4.
The results are presented in figures 67 through 70. These figures are normalized with respect to the properties obtained from samples submerged in 22 oC (72 oF) water at or near the saturation moisture content (M8).
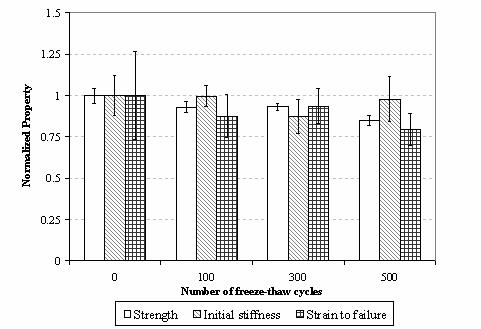
Figure 67. Graph. Influence of freeze-thaw cycling on the
longitudinal tensile properties for the Lancaster 24-inch FRP
tube.
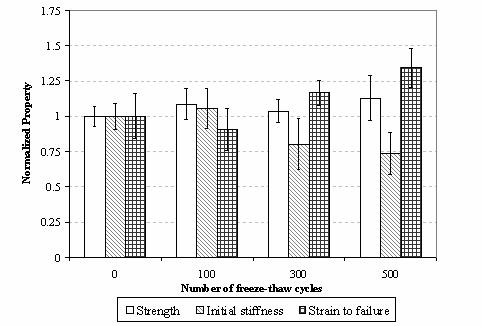
Figure 68. Graph. Influence of freeze-thaw cycling on the
longitudinal tensile properties for the Lancaster 12-inch FRP
tube.
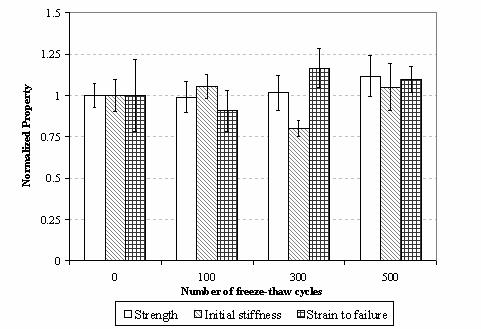
Figure 69. Graph. Influence of freeze-thaw cycling on the
longitudinal tensile properties for the Hardcore 24-inch FRP
tube.
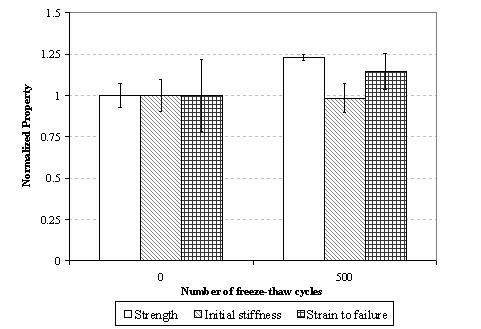
Figure 70. Graph. Influence of freeze-thaw cycling on the
longitudinal tensile properties for the Hardcore 12-inch FRP
tube.
The freeze-thaw data indicates little change in the longitudinal tensile properties of the FRP tubes except for the Lancaster 24-inch (0.61-m), where a strength decrease of about 20 percent was recorded after exposure to 500 freeze-thaw cycles.
Scanning electron microscopy was used to investigate the damage mechanisms for the FRP composite tubes. The SEM images allowed examination of the state of the fibers and the surrounding matrix at different exposure conditions used in the experimental program. For each FRP tube type, SEM micrographs were obtained for the following conditions: as-received, at the end of moisture absorption in 22 oC (72 oF) water (i.e., saturation), and after freeze-thaw cycling. SEM images for the four types of FRP tubes investigated are shown in figures 71 through 74.
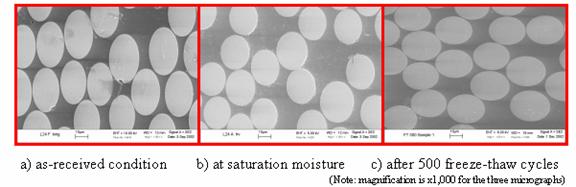
Figure 71. Photo. SEM images of Lancaster 24-inch FRP
tube.
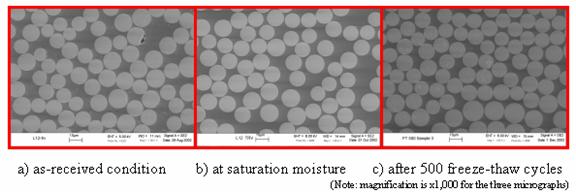
Figure 72. Photo. SEM images of Lancaster 12-inch FRP
tube.
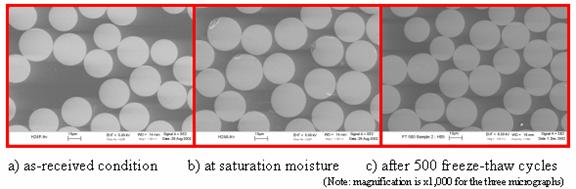
Figure 73. Photo. SEM images of Hardcore 24-inch FRP
tube.
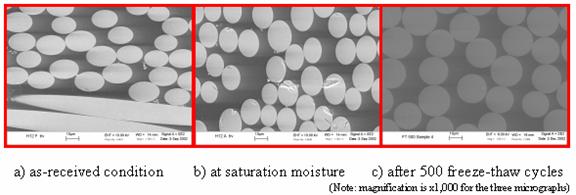
Figure 74. Photo. SEM images of Hardcore 12-inch FRP
tube.
Some damage was noticed in the SEM images taken at the saturation moisture state. The signs of degradation included damage at the fiber and at the interface between the fiber and matrix.
The durability experimental program described above was based on testing FRP coupons submerged in 22 oC (72 oF) water with their edges coated to approximate 1-D diffusion conditions. For a concrete-filled FRP pile, the diffusion will be predominantly in the radial direction. Furthermore, the boundary conditions on the inner and outer surfaces of the FRP shell of the pile will be different from the boundary conditions of the experimental program. A more realistic estimation of the FRP strength as a function of time can be modeled by calculating the average moisture content of the FRP shell using the approach described in Appendix B and in Pando, et al. (2001). This approach involves calculating the moisture content of the FRP shell of the pile versus time, using a radial moisture diffusion model and incorporating more appropriate boundary conditions. Once the relationship between the FRP shell moisture content and time is computed, one can calculate the FRP strength-versus-time relationships using the experimental data presented in section 4.3. Although relationships of FRP properties versus time are useful, for the purpose of estimating the long-term capacity we only need the residual values for the FRP mechanical properties (i.e., the estimated long-term FRP properties).
This section presents a simplified example, intended for illustrative purposes only, to demonstrate the importance of considering evaluation of moisture aging effects on the FRP strength and stiffness (especially for bending capacity). The long-term structural capacity of concrete-filled FRP piles can be estimated using the short-term models for axial and flexural structural behavior by Fam and Rizkalla (2001a and b, 2002), coupled with the long-term mechanical properties of the FRP tube after degradation has occurred. The long-term mechanical properties of the FRP tube can be estimated using experimental relationships between FRP properties and moisture content, such as those presented earlier in this chapter. The moisture content used to estimate the long-term FRP properties should correspond to the long-term average moisture concentration expected in the field for the FRP tube in the pile. A procedure to estimate the long-term moisture content for a cylindrical FRP is described in Appendix B and in Pando, et al. (2002b).
As an example, the long-term axial capacity for the 12-inch (0.31-m) Lancaster pile is estimated. With the FRP dimensions and as-received properties presented in Section 4.3.3, and using the model of Fam and Rizkalla (2001a and b), we obtain the axial load-strain response curve shown as a solid line in figure 75. If we now assume a 25 percent and 40 percent long-term reduction for the FRP hoop stiffness and strength, respectively, we obtain the long-term load-strain curve shown as the dashed line in this same figure (note these degradation values are higher than the measured degradation levels in this study). This represents approximately a 5 percent ultimate (structural) axial capacity reduction.
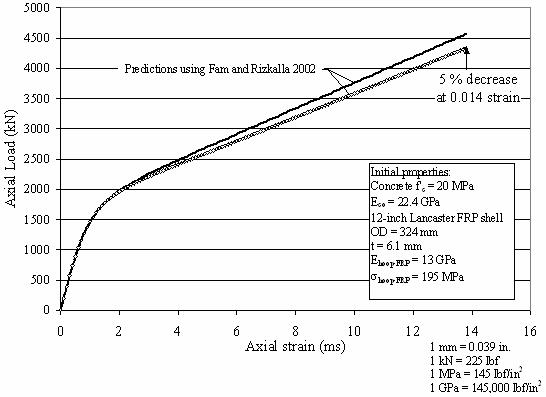
Figure 75. Graph. Estimated long-term axial capacity of the
12-inch Lancaster pile.
As shown in figure 75, the impact of degradation of the FRP mechanical properties on the long-term axial structural capacity of concrete-filled FRP composite piles is small due to the fact that the majority of the capacity contribution is from the concrete infill.
Similarly, the long-term flexural capacity (structural) for the same Lancaster pile can be predicted using the model proposed by Fam and Rizkalla (2002). The short-term moment-curvature response is shown as the solid line in figure 76. Assuming similar stiffness and strength reduction levels as before, but in the longitudinal direction, we obtain the dashed moment-curvature line shown in figure 76. This represents a 24 percent reduction in the long-term structural flexural capacity.
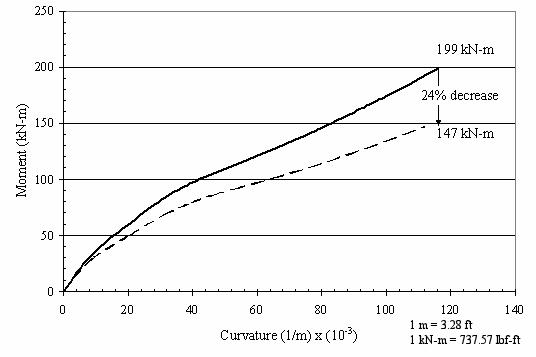
Figure 76. Graph. Estimated long-term flexural capacity of
the 12-inch Lancaster pile.
Figure 76 shows that the impact of FRP degradation is more significant for the flexural capacity because the FRP shell provides most of the capacity contribution on the tension side of the pile in flexion.
The structural ultimate limit state for axially loaded concrete-filled FRP columns or piles occurs at axial strain levels that exceed the normal range of ultimate strains typically used for normal unconfined concrete (e.g., 0.001 to 0.003). As shown in chapter 2, and as reported by Fam and Rizkalla (2002) and others, the presence of the FRP shell allows this type of structural element to undergo much larger axial strains (e.g., to about 0.009 to 0.013). It is important to compare these strain levels to the strain levels that can be allowed to develop in a pile before serviceability limits are exceeded.
The strain distribution along the pile depends on the soil conditions. A pile that develops all or most of its resistance from end bearing, such as piles with their tips founded on hard soil or rock, have almost a constant axial strain distribution with depth. For piles that develop their resistance from side friction, the strain decreases with depth at a rate dependent on the side friction distribution along the pile length. The maximum strain in a pile will occur within the portion of the pile above the ground surface. The maximum axial strains in an axially loaded pile will be influenced by the allowable pile settlement determined from serviceability requirements. Typically the allowable settlement is between 25 and 50 mm (0.975 and 1.95 inches). For the case of an end-bearing pile with an allowable settlement of 37 mm (1.44 inches), the length of the pile would have to be less than 12 m (39 ft) to develop axial strains in the pile above 0.003. For piles carrying their load purely in side friction, and with an allowable settlement of 37 mm (1.44 inches), the length of the pile would have to be less than 24 m (79 ft) to start developing axial strains above 0.003. The pile lengths would have to be shorter if the allowable pile settlement is below 37 mm (1.44 inches). This simple example illustrates how the additional strength and ductility provided by the FRP shell may not be utilized in the field for piles with serviceability requirements, as described above. Thus, serviceability may control design of FRP piles in many practical applications.
A laboratory testing program was completed to study the long-term performance of FRP composite pipe piles. This durability study, which addressed the FRP shells of Lancaster and Hardcore composite piles, included FRP shell characterization, determination of baseline mechanical properties, measurement of moisture absorption as a function of time and temperature, measurement of mechanical properties as a function of moisture absorption, and measurement of mechanical properties as a function of freeze-thaw cycles.
From the results of the durability study, the following conclusions and observations were made.