U.S. Department of Transportation
Federal Highway Administration
1200 New Jersey Avenue, SE
Washington, DC 20590
202-366-4000
Federal Highway Administration Research and Technology
Coordinating, Developing, and Delivering Highway Transportation Innovations
 |
| This report is an archived publication and may contain dated technical, contact, and link information |
|
Federal Highway Administration > Publications > Research > Structures > A Laboratory and Field Study of Composite Piles for Bridge Substructures |
Publication Number: FHWA-HRT-04-043 |
Previous | Table of Contents | Next
This appendix contains the results of all the interface tests performed for the interface study described in chapter 3.
|
Pile/Material |
Density Sand (1) |
Model Sand (2) |
|---|---|---|
|
Lancaster composite FRP shell (CP40) |
Figure 221 |
Figure 228 |
|
Hardcore composite FRP shell (24-4) |
Figure 222 |
Figure 229 |
|
Hardcore FRP plate-untreated surface |
Figure 223 |
Figure 230 |
|
Hardcore FRP plate-treated surface |
Figure 224 |
Figure 231 |
|
PPI plastic pile |
Figure 225 |
Figure 232 |
|
Prestressed concrete pile |
Figure 226 |
Figure 233 |
|
Steel sheet pile |
Figure 227 |
Figure 234 |
Notes: (1) See table 10, chapter 3, for a summary of interface shear test results on Density sand.
(2) See table 11, chapter 3, for a summary of interface shear test results on Model sand.
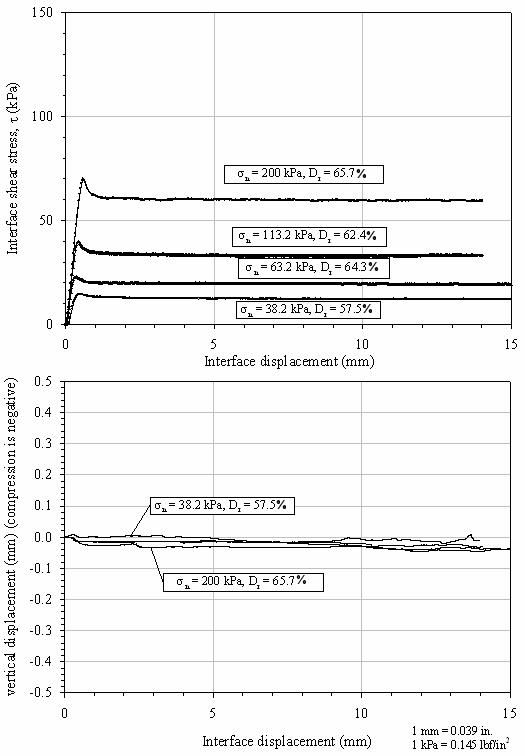
Figure 221. Graphs. Interface shear test results, Density
sand-to-Lancaster FRP shell interface.
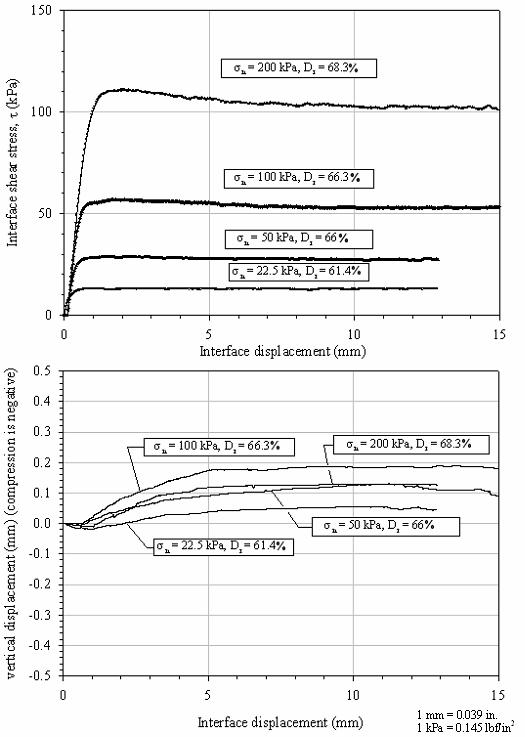
Figure 222. Graphs. Interface shear test results, Density
sand-to-Hardcore FRP shell interface.
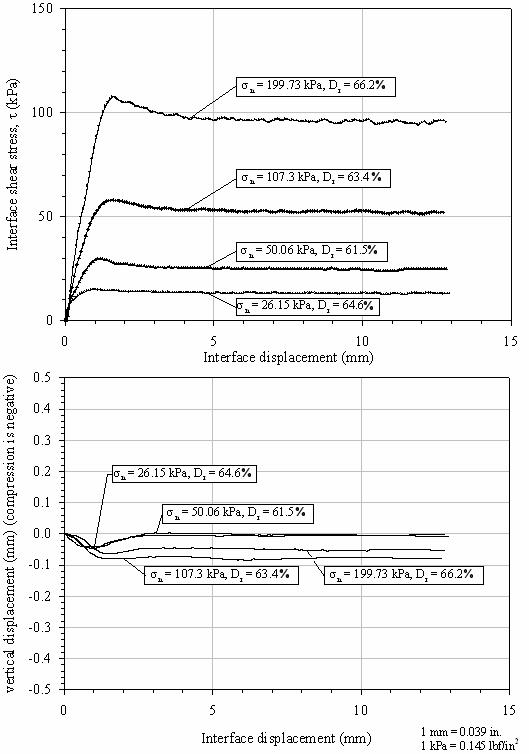
Figure 223. Graphs. Interface shear test results, Density
sand-to-Hardcore FRP plate (untreated) interface.
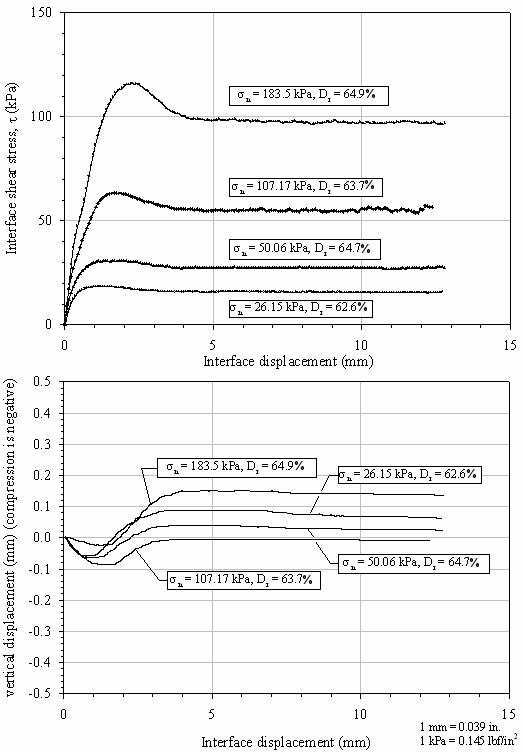
Figure 224. Graphs. Interface shear test results, Density
sand-to-treated Hardcore FRP plate interface.
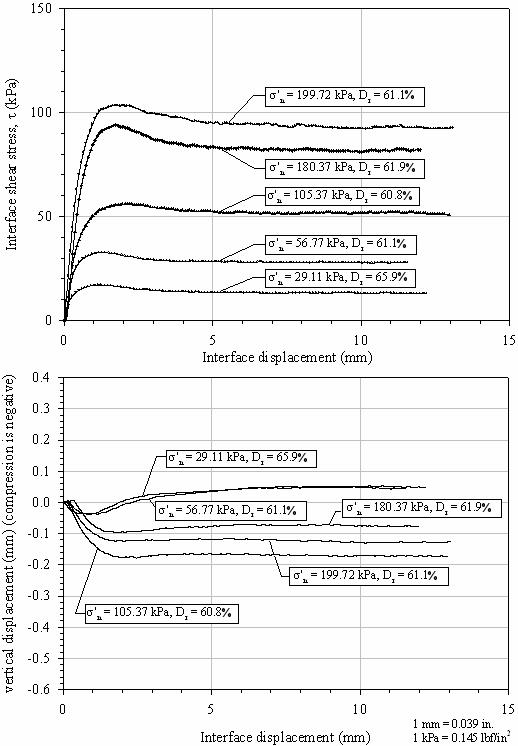
Figure 225. Graphs. Interface shear test results, Density
sand-to-plastic interface.
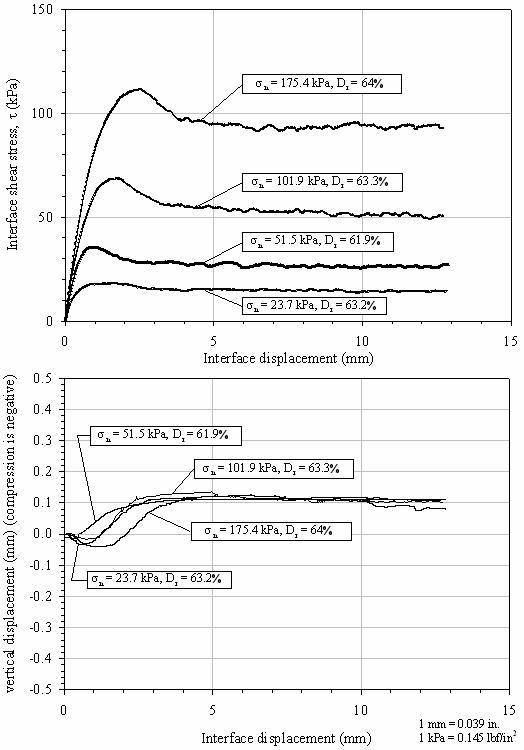
Figure 226. Graphs. Interface shear test results, Density
sand-to-concrete interface.
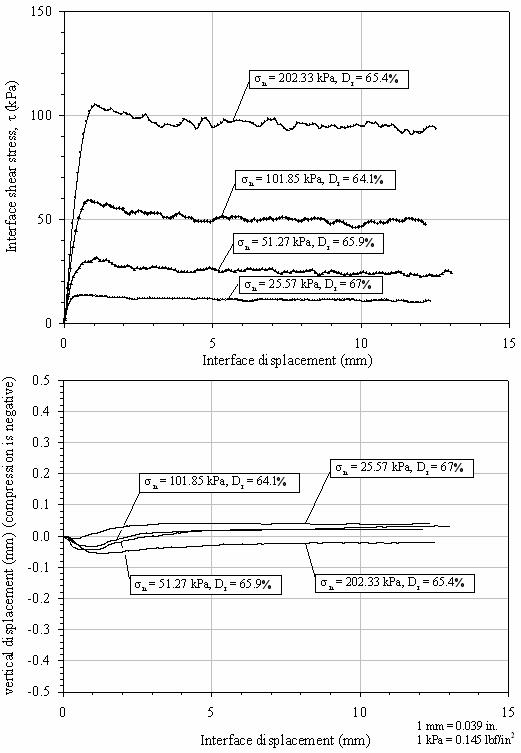
Figure 227. Graphs. Interface shear test results, Density
sand-to-steel interface.
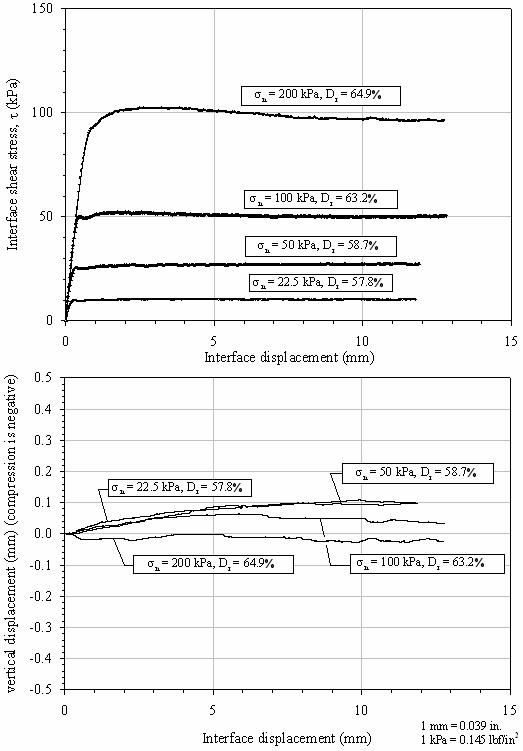
Figure 228. Graphs. Interface shear test results, Model
sand-to-Lancaster FRP shell interface.
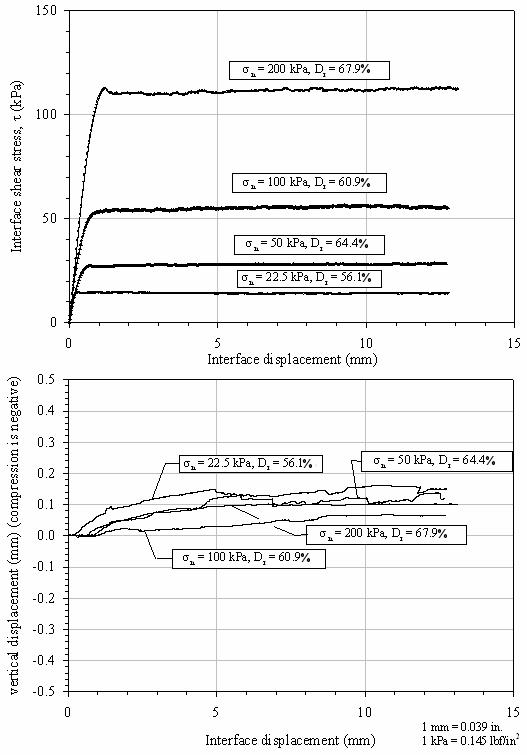
Figure 229. Graphs. Interface shear test results, Model
sand-to-Hardcore FRP shell interface.
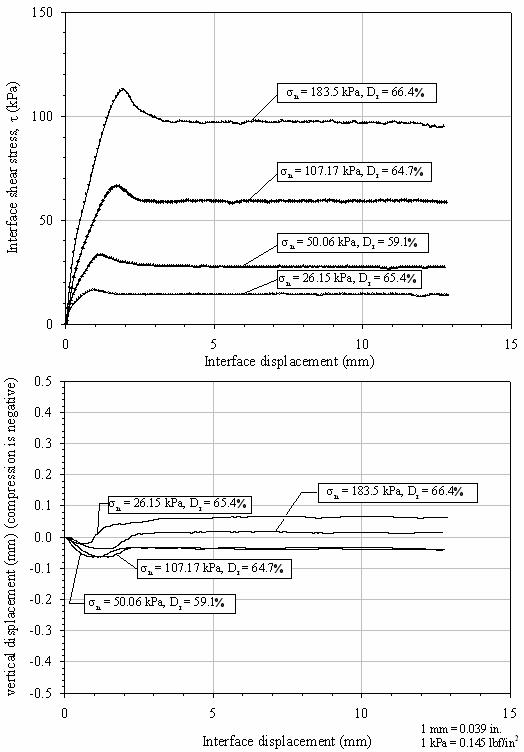
Figure 230. Graphs. Interface shear test results, Model
sand-to-Hardcore FRP plate (untreated) interface.
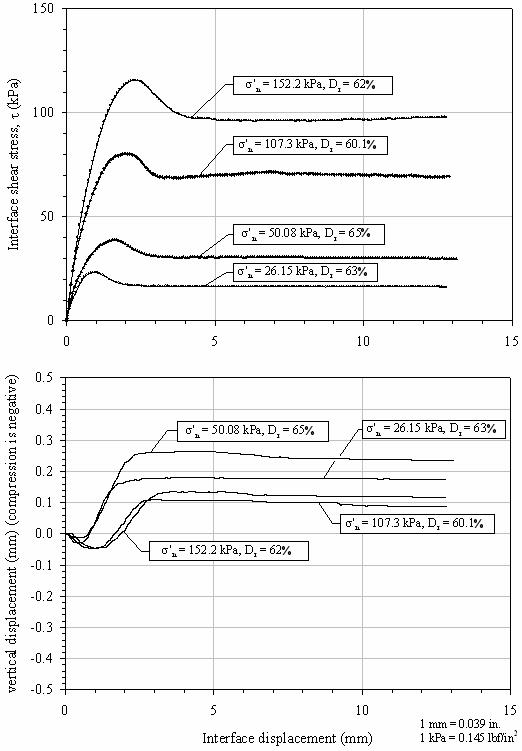
Figure 231. Graphs. Interface shear test results, Model
sand-to-treated Hardcore FRP plate interface.
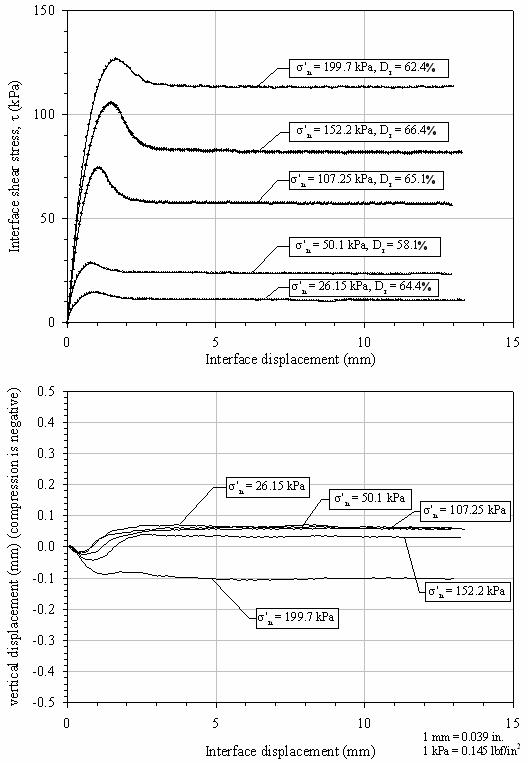
Figure 232. Graphs. Interface shear test results, Model
sand-to-plastic interface.
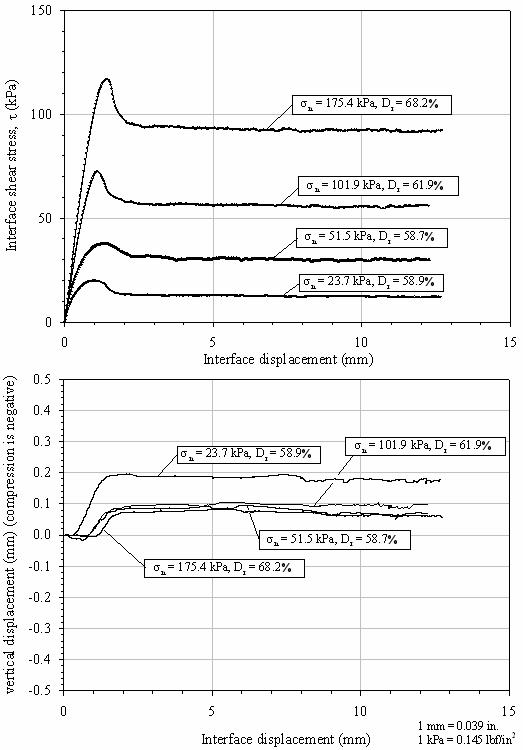
Figure 233. Graphs. Interface shear test results, Model
sand-to-concrete interface.
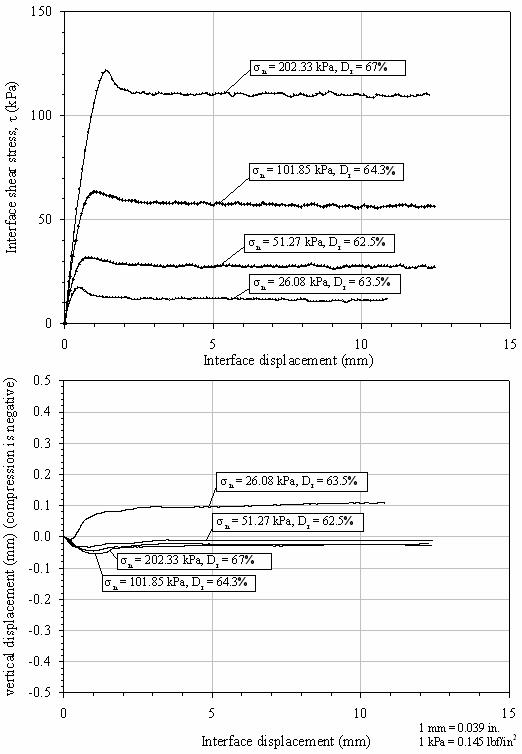
Figure 234. Graphs. Interface shear test results, Model
sand-to-steel interface.

