U.S. Department of Transportation
Federal Highway Administration
1200 New Jersey Avenue, SE
Washington, DC 20590
202-366-4000
Federal Highway Administration Research and Technology
Coordinating, Developing, and Delivering Highway Transportation Innovations
 |
| This report is an archived publication and may contain dated technical, contact, and link information |
|
Federal Highway Administration > Publications > Research > Structures > Covered Bridge Manual |
Publication Number: FHWA-HRT-04-098 |
Previous | Table of Contents | Next
Covered bridges are exposed to load issues unique to their form and material of construction. This chapter focuses on loads as they relate to evaluating and rehabilitating existing bridges, but also includes some guidance relevant to designing new covered bridges.
In simple terms, the loads are categorized as dead (nontransient, often primarily based on the bridge's self-weight) and live (transient, such as snow, and moving, such as vehicular and pedestrian). Combinations of loads involving snow are especially important to covered bridges, due to the lack of guidance in conventional bridge specifications.
In most short- to mid-span concrete or steel bridges, the stresses induced by the weight of the design vehicle represent a large portion of the total stress in the primary components. Stresses from the weight of these bridges, while not small, are usually much smaller than those caused by the design vehicle.
Covered timber bridges, however, are unusual in that the stresses from their own weight represent a significant part of the total stresses. The chord forces due to dead load commonly are equal to, or even exceed, those caused by vehicular loads. This is due, in part, to the weight of the roof and siding that conventional bridges do not have. The heavy timber trusses also have relatively high weight-to-strength ratios, compared with the efficient beam cross sections used in steel and concrete. This means that it is very important to predict a timber-covered bridge's self-weight as accurately as possible.
The AASHTO bridge specifications suggest using 800 kg/m3 (50 pcf) for the density of wood when determining dead load for a timber bridge. This value is conservatively high and prudent for most common (i.e., uncovered) bridges and with most (but not all) timber species. (For comparison, many building designs use a density of 560 kg/m3 (35 pcf) as a default density.) The 800 kg/m3 (50 pcf) value was established when the specifications were first published in 1935. It is strongly influenced by open timber structures, which are prone to high moisture content. In addition, creosote wood preservative commonly was used, which could add as much as an additional 160 kg/m3 (10 pcf) to the weight of the wood.
Therefore, a prudent first step in analyzing a covered bridge is to use 800 kg/m3 (50 pcf) for the assumed weight of the wood, based on the AASHTO guidance. If the results of that assumption are acceptable, as evidenced by a calculated satisfactory live load capacity, then no further estimate regarding the weight of wood is necessary.
However, if the results of the analysis indicate an unacceptably low capacity for live load, then further investigation in determining the weight of wood may be warranted. The following discussion provides guidance on those next steps.
Wood density is strongly influenced by its moisture content, which can vary widely with environmental conditions. AASHTO's suggested density recognizes the potential for higher moisture contents (and densities) when timber components are exposed to direct wetting from rain. Covered bridge timbers, however, have lower timber moisture contents (this is the very purpose of the bridge covers) and associated reduced timber densities. The bridges inspected in the statewide Vermont study (Chapter 1) contained timbers with moisture contents much lower than 19-20 percent (a commonly cited upper limit of dry wood in the timber industry.) The aged and protected air-dried softwood timber found in most covered bridges typically has unit weights ranging from 417-609 kg/m3 (26-38 pcf).
This issue is extremely important to accurately evaluate covered bridge capacities. Analyses prepared using the standard 800 kg/m3 (50 pcf) density commonly would indicate the need to rehabilitate the bridge to replace existing elements with high strength grade timber, unusually large timber components, or even nontimber components. In some instances, to provide the necessary factor of safety, the bridge would be unable to support any design live load. However, use of site-specific wood densities usually leads to a substantial reduction (as much as 30-40 percent) in the dead load forces and stresses.
This discussion of design wood density is intended to encourage use of site-specific unit weights for the evaluating and rehabilitating of historic covered bridges. The selection of unit weights should be based on standard timber references, such as:
The selection of an appropriate unit weight for components requires that a wood scientist or other qualified evaluator examine the in situ bridge or small samples removed for such purposes to determine the species of the various elements; these also must be determined for allowable stress purposes. If some components (e.g., the floor planking) are made of dense species, then unit weights appropriate to the component should be used, resulting in an overall weight of the bridge as a summary of the individual components.
Further, the site-specific unit weight should be based on a reasonable estimate of moisture content. A moisture meter can be used to determine the actual moisture content of representative elements of the bridge. Those elements below the surface of the deck may have higher values, especially if the bridge is relatively close to water. As an alternative, actual samples of the wood from the bridge can be obtained and tested in a laboratory to determine the actual moisture content. As noted above, it is common to find moisture contents below the 19-20 percent threshold; this threshold often is cited as the difference between dry and wet wood.
The 800 kg/m3 (50 pcf) density may be used safely in lieu of site-specific densities, if that is desirable.
A related topic involves installing dry, versus green, new timber components during rehabilitation of historic bridges or for the design of new covered bridges. Conventional practice requires installing only dried primary structural components that would have unit weights as discussed above. However, the relatively nonstructural components (siding, roof boards, and some of the bracing) might reasonably be installed using green timber components. Although this could represent a heavier load than that assumed by the designer, many believe this option is acceptable, because those components will dry quite rapidly and will soon reach the reduced unit weight, in most cases before the bridge is opened to traffic. If green timber is to be used for bigger, primary components, then the conscientious designer will make appropriate modifications to the unit weight, because the larger members will take longer to dry. Another minor wood density consideration relates to the extra weight associated with most modern pressure-applied preservative treatments. Although usually quite small, common treatments could add another 16 or 32 kg/m3 (1 or 2 pcf), with the exception of creosote, which adds substantially more, as noted above.
When working with any traffic-carrying bridge, a primary design issue is the selection of the design vehicle. This initial subsection is not directly relevant to many covered bridges, but it is presented here as appropriate background information.
The AASHTO Standard Specifications for Highway Bridges identifies three types of design vehicle loads. The first two represent categories of individual vehicles and are routinely referred to as the H or HS truck. The H truck configuration includes only two theoretical axles and represents dump truck vehicles. The AASHTO specifications present information related to two sizes of H-type vehicles: the standard 20-ton (18-metric ton (MT)) (i.e., H20 (M18) truck, as in figure 82) or a smaller 15-ton (13.5-MT) vehicle (the H15 (M13.5)).
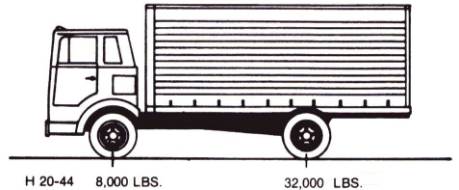
Figure 82. H20 design truck vehicle (after AASHTO standard specifications) [8,000 lbs = 3,632 kg; 32,000 lbs = 14,528 kg].
AASHTO identifies the conventional semi- or tractor-trailer vehicle as an HS truck configuration. It is identical to the H truck, but with an extra 32,000-pound (14,528-kg) axle representing the rear axle of the trailer. The standard HS20 vehicle weighs 36 tons (32.7 MT), and the smaller HS15 weighs 27 tons (24.5 MT) (see figure 83).
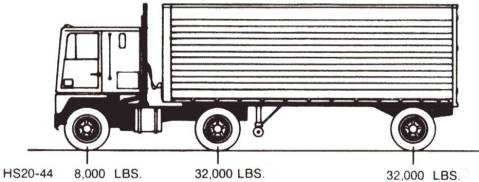
Figure 83. HS20 design truck vehicle (after AASHTO standard specifications) [8,000 lbs = 3,632 kg; 32,000 lbs = 14,528 kg].
The third type of design-vehicular load is what AASHTO terms lane load. This uniform load scheme represents a string of closely spaced H15 single trucks (with 9.15 m (30 ft) between the rear axle of one vehicle and the front axle of the following vehicle), with a heavier H20 truck in the middle of the string. This type of vehicular load is important for long-span structures, where slow traffic can lead to a bunching effect, with heavier loads than those generated by higher speed traffic and traveling with more space between vehicles (see figure 84).
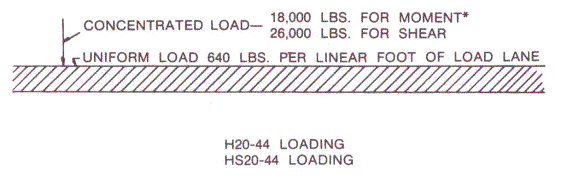
Figure 84. Lane load configuration (after AASHTO standard specifications) [18,000 lbs = 8,182 kg; 11,818 kg, 640 lbs/ft = 954 kg/m].
These three vehicular load types evolved from the initial AASHTO specifications, published in 1935. While each load type is a simplified representation of the diverse vehicle configurations and weights that actually travel the roadways, this trio of AASHTO loads is acceptably accurate for the purposes of designing most bridge components. Consistent design load, unless it is completely unrealistic or radical, serves the structural design profession well.
As the trucking industry has consistently managed to obtain permission from regulatory agencies for bigger and heavier trucks, there has been commensurate pressure to increase the design vehicle used for bridge design. Several years ago, States began addressing this issue by adopting a scaled-up version of the HS20 vehicle, the HS25. Since then, this has become a common design vehicle, albeit incompatible with the typical types of vehicles traveling through a covered bridge. AASHTO also has an LRFD specification, in which an HL93 loading is used. The HL93 is an HS20 truck with the lane load added. These very heavy rigs do not travel very often on the secondary roadways where most covered bridges are located.
Bridges built in the 19th century were not designed for these modern vehicular loads. Horses and wagons crossed these bridges, along with whatever load that could be pulled through the bridge's openings. A load of loose hay was not very heavy, but skids of logs moved on icy winter roadways could be quite heavy. The commonly anticipated maximum vehicle load at the time when the original covered bridges were built would have been significantly lower than the single vehicle H15 load described above. The relatively high proportion of dead load to total load in covered bridges has worked in these bridges' favor as live loads have increased over their functional lives.
Most original covered bridges have been upgraded to safely support less weight than the standard live loads. Planning for more community vehicles is appropriate in many instances (e.g., oil trucks, loaded snowplows, school buses, and emergency equipment). Design load H15 often is selected to simulate such vehicles. When fewer heavy vehicles use the bridge, the design vehicle can be scaled back to H10 or less.
Selecting the design vehicle for use in rehabilitating an historic covered bridge is vital to minimize the effect on the required work. The design vehicle should represent the absolute lowest vehicle weight practical for the site-this cannot be overemphasized.
The selection of the live load design vehicle usually depends on the site of the covered bridge. A covered bridge that provides sole access to a dead-end road must be able to support a more diverse and complete set of vehicles than a covered bridge that travelers can bypass easily. Likewise, vehicles of any weight will use a covered bridge immediately adjacent to a heavily traveled roadway network more than they would a bridge in a remote location.
Most covered bridges intentionally have been posted with a lower weight restriction than the bridges could (and often do) support, to limit the number of heavy vehicles using the bridge. This helps reduce bridge deterioration from overweight vehicles and extends the time between required rehabilitations. In many cases, load restrictions support community planning objectives. Regardless of the reason, select the smallest possible design vehicle to minimize the potential abuse associated with heavy vehicles, even if these heavy loads might cross the bridge safely.
Because few covered bridges can support the heaviest legal vehicles safely, a warning sign that identifies the maximum weight vehicle allowed often is posted on these bridges. FHWA suggests that the lowest weight restriction be 2.7 metric tons (MT) (3 tons). If a bridge cannot safely support this minimal live load, closing the bridge to traffic may be the best option.
There are likely to be more weight restriction violations over bridges in remote areas, so bridge designers and owners in these areas must carefully weigh whether to rely on a load posting or to close or rehabilitate the bridge.
Few means effectively prevent overweight vehicles from crossing a covered bridge. One common method is to install a horizontal bar over the roadway at the entrance of the bridge, positioned in a way to provide a restricted vertical clearance. A restricted clearance (for example, one at 2.4 m (8 ft)) prevents larger vehicles from crossing the bridge. Another method is to introduce a restricted horizontal clearance by squeezing the approach guide railing. At a minimum, this forces traffic to cross the bridge slowly and prevents some larger vehicles from crossing the bridge.
Some covered bridges do not support vehicular loads. In those cases, other live loads, including pedestrian load, bicycles, carriages, and lighter weight recreation vehicles, may have to be considered and investigated. AASHTO published Guide Specifications for Design of Pedestrian Bridges in 1997.[12] This publication restates the provisions of the AASHTO standard specifications regarding live load allowances, although it provides a slight reduction for certain circumstances. The allowance for pedestrian loads can be quite small in most covered bridges, unless the bridge hosts large gatherings for some sort of event, in which case the weight of a large crowd can be substantial. However, because large live loads are usually vehicular, this section focuses on vehicular loads.
Impact load is another issue. A conventional bridge would be subjected to a combination of live load and an impact allowance proportioned to the live load. However, bridges built of timber do not require a consideration of impact load directly, because of wood's unique ability to absorb normal impact load without distress. This issue is discussed in more depth later in this chapter in "Load Combinations and Load Duration."
Most newer, conventional, deck-type bridges are not designed for the weight of snow, because standard practice involves removing snow from the bridge with plows. Typically, it is assumed that the bridge does not have to carry both heavy snow and heavy vehicles at the same time.
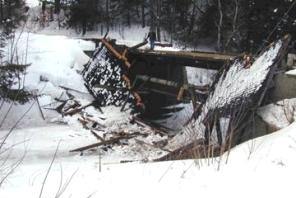
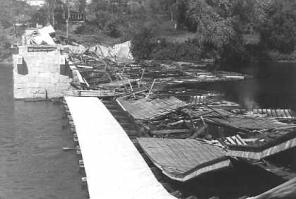
In contrast, covered bridges might have snow on the roof at the same time that vehicles pass through it. The bridge would therefore have to support both snow and vehicular loads. In northern States, design snow loads can become quite heavy 2.4 KPa (50 psf) or more. In some of those States, covered bridges carry snow load on the deck level; snow is deliberately plowed onto the deck to allow snowmobiles to pass. This thin layer represents a light load, which reasonable analysts might neglect. The melting snow, however, may cause some decay in deck level timber components, so regular inspections are important. Figure 85 shows an example of the significance and consequences of snow load on covered bridges-this one collapsed from snow without vehicle load, March 8, 2001. A replica bridge has since been erected.
However, because the AASHTO bridge specifications do not address this issue, it is up to the covered bridge design engineer to select a prudent snow load and live load combination. Many engineers who have experience with covered bridges believe that assuming a covered bridge must support both a full weight design vehicle and full weight snow load simultaneously is too conservative. If a covered bridge has a common 6:12 pitch or steeper roof, the vibrations from vehicles that travel across it cause heavy accumulations of snow to slide off the roof. For bridges with fairly flat roofs, however, designing for both loads could be prudent. Most building design codes differentiate between flat roof and sloped roofs (in which the latter has a slope of more than 5-30 degrees, depending on the specification) in determining design snow loads.
A bridge's tendency to shed snow load is also a function of the roofing material. A metal roof sheds snow load much more readily than does a roof with wood shingles. Bridges in heavy snow areas, therefore, may benefit from a metal roof. In addition, metal roofing systems are lighter than other types of roofing systems.
If the bridge is closed to vehicular traffic, then full snow load should be anticipated and evaluated. The snow can become quite heavy and can represent a significant load on the structure-in some cases much more than the weight of the design vehicle.
The design snow load magnitude is addressed in many specifications, but one quite commonly cited is the ANSI/ASCE 7, Minimum Design Loads for Buildings and Other Structures.[8] Many State governments have special snow load maps to provide additional guidance on appropriate snow load designs; most of these target building design but are appropriate for covered bridges. As noted above, the designer of any work on a specific covered bridge should select the appropriate combination of snow load and group load factors.
Considering uniform snow load is important; however, understanding asymmetrical snow load is perhaps more important, and often controls the analysis of this type of load. Asymmetrical loading may occur from wind-drifted snow or when the snow on one side of the roof slides off before the other side. It is important to address both uniform and asymmetrical snow loads.
Wind load is important to covered bridge design because the wind's relatively large projected areas can develop substantial forces in the bridge. The AASHTO standard specifications do not provide sufficient guidance for developing design wind loads that address the sloped roofs found on most covered bridges. ANSI/ASCE 7[8] provides more specific guidance regarding wind load; it contains provisions for wind pressure coefficients against the sides and roof-both windward and leeward sides.
Wind load is important for the design of several components in covered bridges:
Before it was destroyed, the bridge in figure 86 had served successfully for more than 110 years. The bridge was destroyed shortly after a rehabilitation that made two significant structural modifications. First, the siding was extended closer to the eaves of the bridge, thereby increasing the area exposed to wind forces and concurrently reducing the ventilation strip that could have allowed some of the wind pressure to pass through the bridge. Second, the two-span Burr arch truss bridge was augmented with arches that had been seated in pockets cast into the abutments and pier. The rehabilitation had eliminated the pockets by filling them with concrete to reduce opportunities for rot due to trapped water. The arches were then butted against a flat surface. Eliminating the pockets removed the lateral support of the arches, thereby decreasing the bridge's ability to withstand the lateral forces from wind loads. Although the exact cause of the bridge's failure cannot be established, these two structural modifications may have contributed to its demise.
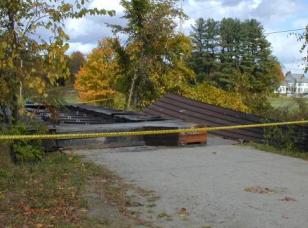
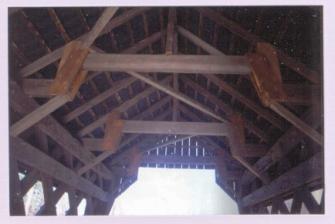
A second example of bridge failure caused by wind is shown in figure 87. Figure 88 shows alterations to the overhead bracing system in this bridge; these were made shortly before its collapse. The bracing reconnections in figure 88 were quite unusual; given these, it was likely that problems would occur.
(photograph by Jim Smedley)
Figure 87. Another example of collapse by wind-Smith Bridge at Brownsville, VT.
(photograph by Ed Barna)
Figure 88. The Smith Bridge before collapse.
These bridge failures demonstrate the importance of considering the ramifications of proposed structural modifications during rehabilitation projects.
Other load conditions that might reasonably be considered for covered bridges under some special situations include seismic events (earthquakes), thermal differentials, erection conditions, longitudinal and centrifugal traffic loads, and loads associated with flowing streams and ice. Of these loads, only those related to stream flow (including debris loads during floods) and/or ice forces have much relevance to most covered bridges.
In most instances, covered bridges that have survived for many decades have lasted only because they are not exposed to such water-related forces. In some cases, bridges have been able to withstand the forces related to occasional loads imposed by streams or ice floes.
As design conditions, these forces generally are not relevant to sizing members in a covered bridge. However, these rare but heavy loads do mean that consideration should be given to potential details to help strengthen a bridge in ways that counteract the rare instances of these unusual loads; these are primarily aimed at bracing or support connection details. These issues are discussed in relevant sections of this manual.
As with any structure, erection conditions for rehabilitation of covered bridges warrant careful evaluation. Timber trusses often are lifted individually to facilitate the work; in some instances, the entire bridge is lifted. Bracing the compression elements remains vital during such lifting operations. Appendix B demonstrates a truss skeleton failure due to an erection overstress during a relocation operation.
Designing steel or concrete structures involves considering combinations of load; therefore, most structural engineers are quite familiar with assessing the probability of various load combinations. As an example, it is unlikely that any bridge will need to resist full design vehicle load, design wind load, and the structure's self-weight simultaneously. Hence, design specifications provide for a load reduction factor that depends on the load combination. The precise load combination reduction factor varies among design specifications; therefore, designers must be familiar with the specification governing the project in question. In most cases involving covered bridges, the design is based on the AASHTO specifications; hence, various combinations of dead, live, snow, and wind are usually involved. Accordingly, load combination factors from a low of 1.25 to a high of 1.4 are possible. However, combinations of wind load only rarely control primary load-bearing timber truss components in covered bridges. The controlling load combination is almost always dead load plus live load, which, according to the AASHTO specifications, has no load combination reduction factor for single-lane (or even two-lane) structures. As mentioned in the earlier discussion about snow load, AASHTO does not directly address this issue, leaving it to the designer to select an appropriate combination of dead, live, and snow loads, and a corresponding load combination factor.
To clarify, the following depicts the differences in load combinations by the two commonly cited specifications used in work on covered bridges: AASHTO's Standard Specifications for Highway Bridges[2] and ANSI/ASCE 7[8]. Those combinations relevant to the review of the covered bridge superstructure are based on service load (also known as allowable stress) design philosophy. The following load combinations were extracted from Table 3.22.1A in AASHTO's Standard Specifications for Highway Bridges:
ANSI/ASCE 7[8] (ASCE 7-98 Section 2.4) provides the following "Combining Nominal Loads Using Allowable Stress Design":
Timber components can absorb loads applied over a short time without apparent distress a characteristic not true of steel or concrete. In fact, timber components can often accept twice as much load as steel or concrete, if the load is applied suddenly. This material behavior specific to timber is addressed through a load duration factor, which may range up to 2.0, as provided in the NDS. Because this load duration concept does not apply when designing with steel or concrete, it is not familiar to most engineers and can be very difficult to understand.
A common misconception about load duration factors relates to the concurrent application of both a load combination factor and a load duration factor. Designers should understand that the duration of load factor relates to the behavior of timber as a material, while load combination factors relate to the probabilities of concurrent design loads. Nonetheless, the topic is confusing because the applicable load duration factor depends on the combination of individual loads being considered. A good discussion of this topic is presented in the Commentary on the National Design Specifications for Wood Construction.[13] NDS focuses on timber and thoroughly addresses load duration, while only referencing the pertinent design specification for load combination factors (for covered bridges, this is usually provided in the AASHTO specifications).
The following example is provided to demonstrate how the controlling load combination is determined. Note that this examination is required for each component in the bridge, and different combinations of load and duration of load factor may control the design of different elements.
Consider the following two load scenarios for a timber structure:
A. A live load (LL) of 100 PSF and a dead load (DL) of 60 PSF
B. A live load of 20 PSF and a dead load of 80 PSF
The controlling load combination will either be LL + DL or DL alone, and it is determined by dividing the load combination by the duration factor (CD) of the least-duration loading in each combination.
For scenario A, the two combinations are:
LL + DL => 100 PSF + 60 PSF = 160 PSF (1)
For this combination, the CD for LL is 1.15 and for DL is 0.9. The least-duration CD is 1.15. Therefore, the combination is divided by the CD, which yields:
160 PSF / 1.15 = 139 PSF
DL=> 60 PSF (2)
For this combination, the only CD is that for dead load, which is 0.9. Thus, the following division is performed:
60 PSF / 0.9 = 67 PSF (3)
One then compares the two results, and the larger quotient indicates the controlling load. In this case, the quotient for the LL + DL combination is the larger, thus the timber structure would be designed for a load combination of 160 PSF. (It is important to note that the quotient of 139 PSF is not used for design or any other purposes, only to determine the controlling load combination.) In this instance, the stresses caused by the load of 160 PSF would be compared against the basic allowable stress multiplied by the load duration factor of 1.15.
Although it may seem obvious that a structure should be designed for the higher total load combination (as it would for steel or concrete), a review of scenario B indicates how such an assumption is misleading. Performing the same computations, but with the values indicated for B, shows that, again, the two combinations are:
LL + DL => 20 PSF + 80 PSF = 100 PSF (4)
For this combination, the CD for LL is again 1.15 and for DL is again 0.9. The least-duration CD is 1.15. Therefore, the combination is divided by the CD, which yields:
100 PSF / 1.15 = 87 PSF
DL => 80 PSF (5)
For this combination, the only CD is that for dead load, which is 0.9. Thus, the following division is performed:
80 PSF / 0.9 = 89 PSF (6)
By comparing the two results and remembering that the larger quotient indicates the controlling load, one finds that the load combination of dead load alone governs in scenario B. Accordingly, the entire design would be dictated by using a total governing load of 80 PSF (from just dead load), not the higher combined live plus dead load of 100 PSF. The stresses caused by the load of 80 PSF would be compared against the basic allowable stress multiplied by the load duration factor of 0.9.
In most cases in covered bridges, the combination of live plus dead is the controlling load combination. However, this always must be checked, and it is especially important when (1) the dead load to live load ratio is high, or (2) when any of the load duration factors are significantly above 1.0.
Because the issue of snow load in combination with vehicular load is not directly addressed in any nationally recognized design specification, the following guidance, which has been used by several engineers when confronted with this issue, may be worth considering:
Proposed load combination: Dead load plus live load (vehicular), plus snow (either uniform or drifted/unbalanced)-use a group load reduction factor of 1.33 (representing a probability of occurrence).
This is based on the ASCE 7 discussion of load combinations. This proposal is somewhat more liberal than a strict review of the AASHTO bridge specifications; these can be interpreted to proscribe only a 1.25 factor. Proposed load duration factor for this load combination comes directly from the NDS specifications:
For the combination of dead, live, and snow loads, the load duration factor would be 1.15.
The AASHTO bridge specifications use 1.15 for a two-month duration, which AASHTO also parenthetically identifies for vehicle live load. NDS has traditionally associated the two-month duration with snow load on timber structures.
However, some engineers believe this load combination and load duration factor is still overly conservative when reviewing extant covered bridges, because the results of an analytical investigation using this combination often indicate major weaknesses in structures that have successfully supported loads for a long time.

