U.S. Department of Transportation
Federal Highway Administration
1200 New Jersey Avenue, SE
Washington, DC 20590
202-366-4000
Federal Highway Administration Research and Technology
Coordinating, Developing, and Delivering Highway Transportation Innovations
 |
| This report is an archived publication and may contain dated technical, contact, and link information |
|
Publication Number: FHWA-HRT-05-058
Date: October 2006 |
||||||||||||||||||||||||||||||||||||||||||||||||||||||||||||||||||||||||||||||||||||||||||||||||||||||||||||||||||||||||||||||||||||||||||||||||||||||||||||||||||||||||||||||||||||||||||||||||||||||||||||||||||||||||||||||||||||||||||||||||||||||||||||||||||||||||||||||||||||||||||||||||||||||||||||||||||||||||||||||||||||||||||||||||||||||||||||||||||||||||||||||||||||||||||||||||||||||||||||||||||||||||||||||||||||||||||||||||||||||||||||||||||||||||||||||||||||||||||||||||||||||||||||||||||||||||||||||||||||||||||||||||
Optimized Sections for High-Strength Concrete Bridge Girders--Effect of Deck Concrete StrengthCHAPTER 4. TASK 3: ANALYSES OF PRESTRESS LOSSES AND LONG-TERM DEFLECTIONSRESEARCH APPROACHAnalyses to determine the effect of high-performance concrete on prestress losses and long-term deflections were performed using a computer program known as PBEAM. (29) The program PBEAM is capable of analyzing composite prestressed concrete structures of any cross sectional shape having one axis of symmetry. The program accounts for the effects of nonlinearity of stress-strain response of materials and their variations of strength, stiffness, creep, and shrinkage of concrete, and relaxation of steel with time. A step-by-step method is used in the time-dependent analysis, and a tangent stiffness method is implemented for solving nonlinear response. Precast, prestressed bridge girders with composite cast-in-place decks are modeled using a discrete element method. Element deformations and forces are estimated by analyzing stress-strain relationships of a series of rectangular fibers distributed over the depth of a cross section. Strain in each fiber is assumed to be constant at the centroidal axis of the fiber, and strain distribution varies linearly through the depth of a section. For each time step, the equilibrium at each element is maintained by determining the time-dependent stress corresponding to the level of strain in each fiber. The stress multiplied by area is summed over all fibers and force equilibrium is checked. If necessary, the strain distribution is adjusted and the process is repeated until all forces balance. A more detailed description of the program PBEAM and its verification against experimental data are given in references 29 and 30. The following assumptions were utilized in the program PBEAM:
Analyses were performed for the following variables:
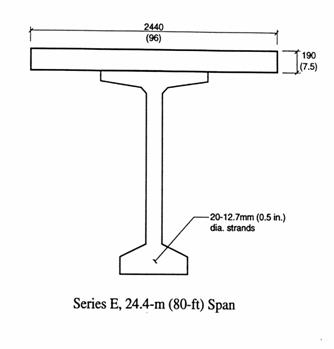
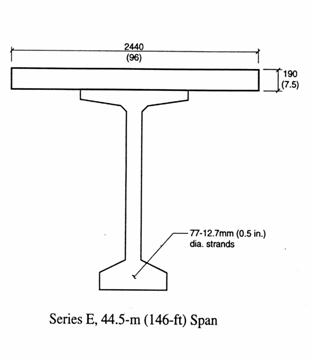
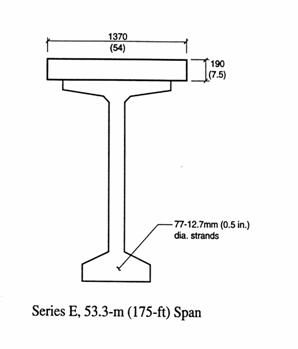
The combination of variables are defined in tables 16 and 17. Cross sections of the girders are shown in Figure 23. Series A through D represent a complete parametric study of girder concrete strength and deck concrete strength for constant cross section and span length. Series E is an investigation of span lengths for a constant concrete strength. Design of the cross sections for series A and E were based on the analyses performed in task 1.
* For consistency between tasks, the odd number of strands calculated by the program BRIDGE in task 1 were retained in task 3.
* For consistency between tasks, the odd number of strands calculated by the program BRIDGE in task 1 were retained in task 3. To satisfy design stress conditions at the ends of the girders, every strand within the width of the web was draped upwards at the ends. The drape started at a distance of 30 percent of the span from the end of the girders. The center 40 percent of the span length had the strands at maximum and constant eccentricity. MATERIAL PROPERTIESThe computer program PBEAM allows for a variety of inputs for material properties and also contains default values. Because the properties of high-performance concrete may be different from those used as the basis for the default properties, a study was made to select the most appropriate material properties for analysis. This study involved selecting appropriate properties for modulus of elasticity, shrinkage, and creep, and their variation with time. Modulus of Elasticity In task 2, complete stress-strain curves for various strengths of concrete were established. The slope of the ascending portion of the stress-strain curve is the modulus of elasticity. The following equations were utilized for calculation of the modulus: For f'c of 28 and 41 MPa (4,000 and 6,000 psi, respectively):
For f'c of 55, 69, and 83 MPa (8,000, 10,000, and 12,000 psi):
For the girder concrete, the variation of compressive strength with time was determined from the following equation:
where (f'c)t = compressive strength at a concrete age of t days The above relationship was based on the recommendations of ACI 209 and corresponds to a compressive strength at 1 day equal to 75 percent of the compressive strength at 28 days. (31)
For the deck concrete, the variation of compressive strength was assumed to be in accordance with ACI 209 as follows: (31)
Equation 17 reflects a slower strength gain for moist, cured concrete compared with equation 16 which applies to rapid strength development. Consequently, for a specified 28-day compressive strength, the compressive strength at any other age may be calculated. Using this value of compressive strength, the corresponding modulus of elasticity for the concrete can be determined. In this manner, the variation of modulus of elasticity with time can be calculated. Shrinkage Most research has indicated that the final shrinkage of high-strength concretes is of the same order of magnitude as that for lower strength concretes. (1) Consequently, the values proposed by ACI 209 were utilized in the program PBEAM analysis. ACI 209 recommends that, in the absence of specific creep and shrinkage data for local aggregates and conditions, an average value of 780 millionths be utilized for the shrinkage of a 153- by 305-mm (6- by 12-inch) cylinder exposed to drying at 40 percent relative humidity. (31) This value was then corrected for the effects of girder size and relative humidity in accordance with the procedures of ACI 209. An average mean annual relative humidity of 70 percent was taken as representing a large portion of the United States. Consequently, a relative humidity correction factor of 0.7 was applied. A size correction factor of 0.837 was also applied as representing a volume-to-surface-area ratio of 3.0 for a BT-72. These two correction factors resulted in a final shrinkage strain for the girder of 457 millionths. The shrinkage strain of the girder concrete was assumed to vary with time according to the following equation: (31)
where ( For the concrete in the deck, a relative humidity correction factor of 0.7 was applied along with a size correction for a 190-mm (7.5-inch) thick deck of 0.77, resulting in a final shrinkage of 420 millionths. The deck shrinkage was assumed to vary with time according to the following equation: (31)
It is possible that, with the higher-strength concretes and the use of fly ash or silica fume to obtain the strengths, the concrete may take longer to dry out than the lower strength concretes. Consequently, the assumed variation of shrinkage with time may not truly reflect actual behavior. However, a lack of data for steam-cured, high-strength concretes precluded the determination of an alternative equation. Creep of Girder Concrete Creep of concrete can be expressed in terms of creep coefficients or specific creep. The creep coefficient is the ratio of creep strain to the initial strain at loading. For most concretes, the values vary between 1.30 and 4.15. Specific creep is defined as creep strain per unit stress and varies between 15 and 220 millionths/MPa (0.1 and 1.5 millionths per psi). The relationship between creep coefficient and specific creep is as follows: Creep coefficient = specific creep x modulus of elasticity at age of loading The computer program PBEAM allows the input of creep as a creep coefficient. However, for purposes of selecting appropriate creep values for use in the analyses, the following discussion is based on specific creep. Specific creep data for 153- by 305-mm (6- by 12-inch) cylinders published by several authors are shown in Figure 24. These data have been obtained for a variety of concrete constituent materials, cured under different conditions, loaded at different ages, and maintained under constant load for different lengths of time. To partially eliminate the variable associated with the length of time under load, the published data were corrected to final values based on variations of creep with time following the equations listed above. A plot of the same data including this correction factor is shown in Figure 25. All of the data are for cylinders maintained at 50 percent relative humidity while under load. A comparison with the predicted values according to ACI 209 for 50 percent relative humidity is also included in Figure 25. This curve is very close to the best fit for all data. The solid symbols shown in Figure 25 are for concrete specimens obtained by steam curing.(14, 30, 32) Since it is anticipated that high-strength concrete prestressed girders will either be produced by steam curing or will achieve relative high temperatures from heat of hydration, the effects of curing temperatures on the properties of concrete are important. Hanson indicated that the effect of atmospheric steam curing was to reduce the creep of concrete cylinders containing type I cement by 20–30 percent and that of concretes containing type III cements by 30–40 percent below that of the same concretes moist cured for 6 days (32) It is also apparent from Figure 25 that the reduction in specific creep as compressive strength increases is more rapid with the steam-cured concretes than with the moist-cured concretes. Figure 25 shows a best-fit curve to the data for steam-cured concretes alone. This curve indicates a very rapid change in the specific creep as the concrete compressive strength increases. However, no data are available for concrete compressive strengths above 69 MPa (10,000 psi), so the validity of the extrapolation beyond 69 MPa (10,000 psi) is questionable. Consequently, in the PBEAM analyses, a variation of specific creep with concrete compressive strength was selected that lay between the ACI 209 values and that for steam cured concrete alone. This line is labeled in Figure 25 as PBEAM. Since most of the data in Figure 25 represent concrete loaded at 28 days, this age was selected as the age for which the specific creep values would be selected. Values of specific creep and creep coefficient for 28-day age of loading at 50 percent relative humidity and a volume-to-surface ratio of 1.5 are listed in table 21. These data were then corrected using the procedures of ACI 209 for a relative humidity of 70 percent, a volume-to-surface ratio of 3.0 corresponding to a BT-72, and a loading age of 1 day. The corrected calculated creep coefficients for each concrete strength are tabulated in table 18. These values were used in the PBEAM analyses.
Figure 24. Variation of specific creep with compressive strength as published.
Figure 25. Variation of ultimate specific creep with compressive strength.
The variation of creep with time was assumed to be in accordance with the following equation by ACI 209:
where
The effect of age of loading was also assumed to be in accordance with ACI 209 as follows:
where
The resulting relationship between specific creep and age for different strength concretes and two ages of loading are shown in Figure 26. Creep of Deck Concrete Since the equations utilized by ACI for creep coefficient represented a good fit for the data shown in Figure 25, it was decided to use the ACI 209 values for the creep properties of the concrete used in the deck. The calculated creep coefficient for a deck with a thickness of 190 m (7.5 inches) was 1.44. Steel Relaxation Since steel relaxation was not a primary parameter in the evaluation, the default values contained within PBEAM were utilized. These are based on the PCI recommendations. (39)
Figure 26. Variation of specific creep with age. PRESTRESS LOSSESThe variation of prestressing strand stress with time for the bottom layer of strands for two BT‑72 girders with concrete compressive strengths of 41 and 83 MPa (6,000 and 12,000 psi, respectively) and a span of 44.5 m (146 ft) is shown in Figure 27. Each curve consists of four stages. The first stage comprises the initial elastic shortening caused by release of the prestressing. In PBEAM, this is accomplished by applying the prestressing force in a series of stages corresponding to the addition of the girder dead load. The force is applied in increments to prevent cracking of the concrete. The second stage of the curves consists of prestress losses between the time of release and the time when the deck is cast on the girder. The third stage is the elastic change in stress caused by application of the dead load of the deck concrete to the girder cross section. The fourth and final stage of the curve consists of losses in strand stresses as the composite girder is loaded by the dead load of the deck and girder. For this analysis, no additional dead load was assumed after the deck was added. The general shape of the curve was the same for all span lengths and concrete strengths analyzed. At each level of girder concrete compressive strength, the variation of deck concrete compressive strength did not have any effect on prestress losses. This occurs because the deck does not become an effective part of the composite section until the fourth stage of each curve. At the beginning of the fourth stage, the compressive stress in the deck is zero. The only increase in compressive stress occurs as the concrete girder shortens and tries to shorten the deck with a corresponding force transferred into the deck. However, at the same time, the deck is also shrinking and this shrinkage is of the same order of magnitude as the shortening of the top flange of the girder. Consequently, there is very little transfer of force between the girder and the deck, and the deck does not have a significant impact on the prestress losses. It should be noted that all the analyses in this investigation were based on a composite section becoming effective at 90 days. It is possible that the effect of the deck concrete compressive strength may be greater for earlier ages of loading. The variation of strand stress with time for the three girders containing 83-MPa (12,000-psi) concrete compressive strength and varying span lengths is shown in Figure 28. It can be seen that the prestress losses varied with span length, the 44.5-m (146-ft) length having the largest total loss. This is consistent with the magnitude of stress at the level of the bottom layer of strands following release. For the girder with the span length of 44.5 m (146 ft), the concrete compressive stress at release was the highest of the three girders. Consequently, the elastic shortening and the creep shortening were also higher.
Figure 27. Prestressing strand stress versus time for varying girder concrete strength,
Figure 28. Prestressing strand stress versus time for 83-MPa girder concrete strength, The prestress losses determined for each level of girder concrete compressive strength are tabulated in tables 19 and 20. The tabulated losses are the calculated losses for the lower layer of prestressing strand in the girder cross section. The total losses are those determined from the program PBEAM at an age of 25 years starting with an initial stress of 1.30 GPa (189,000 psi) in the prestressing strand. The shrinkage stresses were calculated from the assumed shrinkage strain based on a modulus of elasticity of the prestressing strand of 193 GPa (28,000,000 psi). The elastic shortening at release corresponds to the prestress loss determined from the program PBEAM during application of the prestressing force. Because of the manner in which the analyses are performed, a small amount of relaxation is included in these stresses. The creep and relaxation losses represent the net difference between the total losses and the shrinkage and elastic losses. Because of the manner in which the program PBEAM calculates the interactive stresses from creep and relaxation, it is not possible to separate the two effects in the analysis. Consequently, they are listed together in tables 19 and 20. From the analyses, it can be seen that the direct substitution of a higher-strength concrete for one of lower strength reduces the prestress losses, part of the reduction being caused by the lower elastic losses and part by the lower creep losses. It may also be concluded from tables 19 and 20 that the magnitude of the total prestress losses will not be greater through the use of high-strength concrete in the girders and are likely to be less. Prestress losses calculated according to AASHTO standard specifications are also shown in tables 19 and 20 for comparison with the losses calculated according to PBEAM. (16) In the current specifications, the creep losses are calculated based on the concrete stresses at the center of gravity of the prestressing steel. For purposes of comparison, the AASHTO losses shown in tables 19 and 20 were calculated using the procedure detailed in AASHTO specifications, but the stresses were calculated at the level of the bottom layer of prestressing steel. For the shorter span lengths, the AASHTO calculations show reasonable agreement with the PBEAM calculations. However, for the higher-strength concretes at the longer span lengths considerable deviation exists. For all calculations, the elastic losses compare favorably. However, AASHTO underestimates the losses caused by shrinkage and overestimates considerably the losses caused by creep. These data indicate that a revision of the AASHTO specification to take into account the different creep properties of the high-strength concretes is needed.
LONG-TERM DEFLECTIONSThe variation of midspan deflection with time for four girders of varying girder concrete compressive strength and at a constant deck concrete strength of 28 MPa (4,000 psi) is shown in Figure 29. These curves consist of four stages. The initial stage corresponds to an upward deflection at release of prestressing and includes the effects of prestressing and dead load of the girder. The second stage consists of continued upward deflection as a result of creep in the concrete. The third stage consists of a downward deflection caused by the dead load of the deck at the time the concrete deck is placed at 83 days. The fourth stage consists of further downward deflection as a result of creep and shrinkage followed by a period in which the deflections essentially level off. By age 1,000 days, the maximum net deflection was +6 mm (0.25 inch). These analyses indicate that very little change occurs after 180 days, consistent with results obtained by Bruce. (14) The effect of deck concrete compressive strength on midspan deflection is shown in Figure 30. This figure shows the concrete compressive strength of the deck had very little effect on the midspan deflections (which was true for all girder strength levels). The variation of midspan deflection with time for the 83-MPa (12,000 psi) concrete girders with varying span lengths is shown in Figure 31. The deflections of the 24.4-m (80-ft) girder are relatively small compared with the deflections of the girder for other span lengths. This results partly from the shorter span length but also from the relatively low number of strands (only 20). The initial camber of the 44.5-m (146-ft) girder is similar to the camber of the girders shown in Figure 29 for the same span length. A slight difference in camber occurs because of the different number of strands: 77 for the girder in Figure 31 compared with 41 for the girders in Figure 29. The downward deflection caused by casting the deck and the subsequent creep and shrinkage are larger for the girder shown in Figure 31 compared with that in Figure 29 because of the larger girder spacing. The net result for the girder shown in Figure 31 is a downward deflection of approximately 20 mm (0.8 inch).
Figure 29. Midspan deflection versus time for varying The 53.3-m (175-ft) span girder shows a deflection pattern after release that is different from the other girders. For a short time, the girder creeps upwards but it then reverses direction. Following release of the prestress, the stress distribution across the depth of the girder is nearly constant. This is different from the other girders where the compressive stress in the bottom flange is always greater than the stress in the top flange. Following a small amount of prestress loss, the compressive stress in the top flange exceeds the stress in the bottom flange and the girder begins to creep downwards. A large deflection occurs when the deck is cast because of the long span. The final result is a downward deflection of approximately 90 mm (3.5 inches). This deflection is small compared with the span length (1 in 600) and could be compensated for by cambering the deck formwork. However, it indicates that there may be deflection considerations that could limit the span length for which high-strength concrete girders can be used. TASK 3 CONCLUSIONSBased on the task 3 analyses, the following conclusions are made:
Figure 30. Midspan deflection versus time for 41-MPa girder concrete strength,
Figure 31. Midspan deflection versus time for 83-MPa girder concrete strength,
|
||||||||||||||||||||||||||||||||||||||||||||||||||||||||||||||||||||||||||||||||||||||||||||||||||||||||||||||||||||||||||||||||||||||||||||||||||||||||||||||||||||||||||||||||||||||||||||||||||||||||||||||||||||||||||||||||||||||||||||||||||||||||||||||||||||||||||||||||||||||||||||||||||||||||||||||||||||||||||||||||||||||||||||||||||||||||||||||||||||||||||||||||||||||||||||||||||||||||||||||||||||||||||||||||||||||||||||||||||||||||||||||||||||||||||||||||||||||||||||||||||||||||||||||||||||||||||||||||||||||||||||||||