U.S. Department of Transportation
Federal Highway Administration
1200 New Jersey Avenue, SE
Washington, DC 20590
202-366-4000
Federal Highway Administration Research and Technology
Coordinating, Developing, and Delivering Highway Transportation Innovations
 |
| This report is an archived publication and may contain dated technical, contact, and link information |
|
Publication Number: FHWA-HRT-05-063
Date: May 2007 |
Evaluation of LS-DYNA Concrete Material Model 159PDF Version (6.84 MB)
PDF files can be viewed with the Acrobat® Reader® Chapter 3. Single Material Cylinder SimulationsSimulations of plain concrete allow us to evaluate the behavior of the concrete model without the complicating effects of the steel reinforcement. One such set of simulations performed were quasi-static loading of plain concrete cylinders in tension and compression. These simulations demonstrate that the concrete model simulates the basic damage modes observed in tests. These are splitting of the cylinder in tension, and diagonal failure in compression, as shown in Figure 10.
Figure 10. Realistic damage modes are simulated in concrete cylinders loaded in tension and compression. Cylinder Geometry and Loading ConditionsThe cylinder analyzed is 304.8 mm (12 inches) long and 152.4 mm (6 inches) in diameter. Loading conditions are direct pull (uniaxial tensile stress) and unconfined compression (uniaxial compression stress). These are achieved by applying a uniform constant velocity to the nodes at one end of the cylinder (tension) or to the end caps (compression). Velocity is used to represent displacement control, rather than pressure or force conditions, in order to model softening following peak strength. Steel end caps, with slight friction between the cap and cylinder, are modeled in compression in order to simulate the diagonal failure observed in compression tests conducted as part of the bogie vehicle impact tests. Idealized end conditions in compression (applied nodal velocities without lateral constraint or friction) produce wedge-type failure, rather than diagonal failure. Laterally constrained ends produce two diagonal bands of damage (damage in an X-shape), as discussed in subsequent paragraphs. The fringes shown in all deformed configuration plots of this paper range from 0 to 1 and indicate the level of damage calculated by the concrete model. A fringe value of 0 indicates no damage, so concrete strength and stiffness are those originally specified as input values. A fringe value of 1 indicates maximum damage, in which the concrete strength and stiffness are reduced to zero. Elements ERODE (are removed from the calculation and figure) when damage exceeds 0.99 and the maximum principal strain exceeds a user-specified value (typically between 0 and 0.10). An example fringe scale is given in Figure 10, which relates damage level to color. Alternatively, for those with difficulty distinguishing color, lighter fringes indicate higher levels of damage. Commentary is added to figures, where needed, to identify fringes of high damage. Cylinder Tension ResponseOne boundary condition is analyzed for direct pull of the cylinders. The boundary condition is no lateral constraint on the ends of the cylinder so the cylinder is free to expand or contract laterally along its entire length. This idealized condition produces a realistic damage mode (breaking of the cylinder along one band of elements), as shown in Figure 11.
Figure 11. Two bands of damage initiate symmetrically about the axial midplane, then one band of damage rapidly dominates. Initially, at very low damage levels, two bands of damage form, as shown at 13.598 milliseconds (msec). These bands are symmetrically located relative to the axial midplane of the cylinder. The location of the damage bands is thought to be dependent upon wave propagation within the cylinder, because the applied nodal velocities and damage bands are symmetric about the midplane. However, following initial formation, one of these bands becomes more dominant than the other band. Such asymmetric behavior probably results from numerical roundoff during brittle softening. This calculation demonstrates that a realistic damage mode is simulated by the concrete model in tension. Cylinder Compression ResponseDamage Modes Observed in TestsThe damage mode observed in cylinder compression tests depends upon the end conditions of the test, as schematically shown in Figure 12. These figures are reproduced from a text by Bazant and Planas.(9) Cylinders with fixed ends exhibit two diagonal bands of damage. Cylinders with one fixed end and one sliding end (with negligible friction) exhibit a single diagonal band of damage. Small cylinders tested with two sliding ends with negligible friction (well lubricated platens or brushes) may split axially. Supposedly, these end conditions do not resist axial splitting. In practice, an axial split is difficult to achieve during testing.
Figure 12. Damage modes observed in cylinder compression tests as a function of end conditions. Source: CRC Press.(9) Fixed End ConditionsCylinders with fixed ends (laterally constrained ends) were analyzed at three different mesh refinements, and all produced two diagonal bands of damage, consistent with schematic test results shown in Figure 12. Damage fringes from one refined mesh simulation are shown in Figure 13 at various simulation times and rotations. Note that the X-shaped damage bands appear as O-shaped bands when the cylinder is rotated 90 degrees along its axis. The calculation was run for 1.5 sec, during which time the 304.8-mm (12-inch) cylinder was compressed 3.81 mm (0.15 inches). Some views show damage on a slice through the midplane of the cylinder. Other views show damage on the outside of the cylinder.
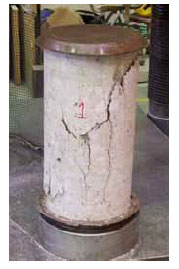
Figure 13. The damage mode calculated for compression cylinders with fixed ends agrees with the X-shaped damage bands observed in tests. Capped End ConditionsCylinders with steel end caps were also analyzed to determine the effect of frictional lateral end constraint on cylinder response. These calculations were performed because it is standard practice to cap cylinders during testing. Capping provides some lateral constraint. An example test cylinder, for the 46 MPa (6,672 lbf/inch2) concrete used in the beams impacted by bogie vehicles, is shown Figure 14. Each idealized end cap is 165.1 mm (6.5 inches) in diameter (12.7 mm (0.5 inches) larger than the cylinders) and 12.7 mm (0.5 inches) in height. A contact surface is modeled between each end cap and the concrete cylinder using frictional coefficients ranging from 0.1 to 0.3. The contact surface type selected was *contact_constraint_nodes_to_surface using the soft contact option. The cylinder was loaded in compression by applying a constant axial velocity to the layer of nodes along the top of the top end cap. The bottom end cap was restrained from axial motion along the bottom layer of end cap nodes. A few sample calculations were performed to determine that compressing from one end of the capped cylinder gives approximately the same results as compressing from both ends.
Figure 14. Concrete cylinder tested as part of the bogie vehicle impact test series. Five variations in boundary conditions were considered. They are:
Damage fringes from these five calculations are given in Figures 15-19. They indicate that the calculated damage mode depends on how the boundary conditions are modeled. The first calculation without nodal constraints gives a distinct band of diagonal damage, as shown in Figure 15. However, further observation indicates that the capped cylinder is rotating about its longitudinal axis. To the eye, the rotation of the top cap is in sync with the rotation of the bottom cap (no relative rotation between the top and bottom caps). The top cap also slides laterally relative to the bottom cap. The second calculation was conducted by laterally constraining some nodes of the bottom cap to prevent the bottom cap from rotating. This constraint also prevents the bottom end cap from sliding laterally. No nodal constraints were applied to the top cap, so it is free to slide and rotate relative to the bottom cap. Results of this calculation are shown in Figure 16. This calculation also gives a distinct band of diagonal damage. The diagonal band of damage forms prior to noticeable sliding of the top cap. Relative sliding of the top and bottom caps becomes apparent as the calculation progresses, as shown. Rotation of the top cap relative to the bottom cap is not apparent. These end constraints produce damage similar to that shown in Figure 12 for one frictionless end, because the frictionless end if free to slide relative to the fixed end.
Figure 15. A diagonal band of damage is calculated with frictional end constraints if both end caps are allowed to rotate and slide (no end cap constraints).
Figure 16. A diagonal band of damage is calculated with frictional end constraints if one end cap is allowed to rotate and slide relative to the other (bottom cap constrained from rotating and sliding). The third calculation was conducted by preventing both the bottom and top end caps from rotating and sliding. This means that there is no relative rotation or relative sliding. This was accomplished by laterally constraining a few select nodes on each cap. Results of this calculation are shown in Figure 17. The damage mode calculated is initially two diagonal bands of damage, similar to the fixed end condition results. The difference between this calculation and the fixed end calculation is that this calculation allows for frictionally restricted lateral expansion at the cylinder ends, whereas the fixed end calculation allows no lateral expansion at the cylinder ends.
Figure 17. A double diagonal band of damage is initially calculated if both end caps are prevented from rotating and sliding (bottom and top caps constrained from rotating and sliding). The fourth calculation was conducted by constraining the bottom cap from rotating and sliding laterally and the top cap from sliding laterally. The top cap is free to rotate relative to the bottom cap. Damage fringes from this calculation are shown in Figure 18. Again, two diagonal bands of damage form initially. Although the bands of damage are evident on an axial slice through the midplane, they are less distinct when viewed from the outside of the cylinder.
Figure 18. A double diagonal band of damage is initially calculated if one end cap is free to rotate (bottom cap restrained from rotating and sliding, top cap restrained from sliding). The fifth calculation was conducted by constraining the bottom and top caps from sliding relative to one another, while allowing them to rotate. Initially, two diagonal bands of damage form, with one more prominent than the other, as shown in Figure 19. The calculations just discussed indicate that one diagonal band of damage forms if the end caps are allowed to slide relative to one another, whether or not relative rotation of the end caps occurs. Otherwise, double bands of damage form initially, followed by severe bulging and damage towards the cylinder midheight. These calculations demonstrate that the concrete model accurately predicts a diagonal damage mode when the end conditions are modeled appropriately. They also indicate that slight variations in the boundary conditions affect the damage mode predicted. The end caps calculations just discussed were all conducted with a 0.3 coefficient of friction (static and dynamic). Additional calculations conducted with a 0.1 coefficient of friction give similar results. Calculations conducted with a 0.01 coefficient of friction are discussed in the next section that reviews free or frictionless end conditions.
Figure 19. A single diagonal band of damage initiates, but is not retained, if the cylinder is over-constrained (bottom and top caps restrained from sliding). Contact Surface TypeUse of additional contact surface types is discussed here to make users aware of issues surrounding the use of contact surfaces. Many of the previously discussed calculations with end caps were conducted with the *contact_constraint_nodes_to_surface interface. The constraint option doesn't allow separation between the concrete cylinder and end caps. A few calculations were also conducted with the *contact_nodes_to_surface and *contact_surface_to_surface interfaces. These options allow separation between the concrete cylinder and end caps. The reason the *contact_constraint_nodes_to_surface interface was used in many calculations is because it did not result in any penetration between the concrete cylinder and end caps. Hence the axial displacement histories of the nodes on the end of the cylinder are the same as those on the caps. This makes post-processing easy, because the displacement history is readily calculated by scaling time by the applied nodal velocity. On the other hand, with most other contact surfaces and options selected, some penetration occurred between the cylinder and end caps, at least initially. Consider two calculations conducted with the *contact_surface_to_surface interface. surface_to_surface interfaces commonly are used because it is easier to call out a surface than to list all the nodes that define the surface. This particular interface also allows the concrete to separate from the end caps, as needed. Boundary conditions are one bottom end cap that is constrained from rotation and sliding, and a top end cap that is free to rotate and slide. In one calculation, default scale factors with a value of 1 were used for the slave and master surfaces (SFS = 1). In the other calculation, the slave surface scale factor was increased from 1 to 10 (SFS = 10). The diagonal damage band calculated with either of these scale factors (Figure 20) is the similar to that calculated with the *contact_constraint interface (previously shown as Figure 16). Although the damage modes are similar, the stress-histories calculated with the surface_ to_surface interface are different than that calculated with the constraint option (Figure 21). One reason these stress-histories are different is because the end cap penetrates the concrete with the surface_to_surface interface, but not with the constraint interface, as shown in Figures 22 and 23. Nodes 1 and 8001 give the displacement histories at each end of the concrete cylinder. Nodes 9001 and 9501 give the displacement histories of the steel cap at the interface with the concrete cylinder. Nodes 18001 and 18501 give the displacement histories of the cap on the top and bottom free surfaces. The difference between the concrete displacements and end cap displacements is the amount of penetration present. Therefore, at a given time, the axial strain in the cylinder with penetration is less than that without penetration. The result is that the initial slopes of the stress histories are different, as previously shown in Figure 21. End cap penetration also occurs when the concrete material model is replaced with an elastic material model (Mat 1) of equivalent modulus (not shown).
Figure 20. Diagonal damage bands are calculated using the *contact_automatic_surface_to_surface option, although the diagonal band location varies with scale factor.
psi = 145.05 MPa Figure 21. Differences in initial slope are primarily due to differing amounts of contact surface penetration between the concrete cylinder and end caps.
mm = 0.039 inch Figure 22. End cap versus concrete displacement with penetration (SFS = 1).
mm = 0.039 inch Figure 23. End cap versus concrete displacement with little penetration (SFS = 10). Stress versus displacement is obtained from a cross plot of the concrete stress history with the concrete displacement history. One must take special care in extracting the correct displacement history. If penetration occurs, use of the end cap displacement histories would overestimate the compression of the concrete. The result is that the concrete elastic modulus would appear to be lower than the user-supplied input value. This is easily corrected by using nodal displacement histories at the ends of the concrete cylinder, rather than on the end caps, as shown in Figure 24. The relative displacement plotted is the difference between the nodal displacements at the ends of the concrete cylinder. Note that at any given time, the relative displacement calculated with the surface_to_surface interface with SFS = 1 is less than that calculated with the constraint interface. The corresponding stress versus displacement histories are shown in Figure 25. Note that with use of the correct concrete displacement history, two of the calculations are in good agreement. The exception is the calculation conducted with SFS = 10. The reason it is different is due to the presence of early time tensile damage, as discussed in the following paragraph. Different options are available to relieve penetration. One is the soft constraint option. This option is recommended for use when the materials on each side of the interface have different stiffness, like steel and concrete. This option relieves some, but not all, of the penetration. Another option is to increase the scale factor of the concrete (slave) surface by a factor of 10. This option successfully prevents penetration of the end caps into the concrete (Figure 23). As desired, a diagonal damage band forms. The only concern is that slight tensile damage initiates near the contact surface very early in time at 20 msec, before the time of peak strength at 400 to 500 msec, as shown in Figure 26. This tensile damage is triggered by axial extension of the concrete in the vicinity of the contact surface. Such tensile damage has also been observed in some, but not all, of the calculations conducted with the *contact_constraint option. The early-time tensile damage lowers the stiffness of the concrete relative to that observed in calculations without early-time tensile damage, as previously shown in Figure 25. In summary, the contact surface parameters and interface type affect damage initiation in these cylinder compression calculations. This effect appears to be due to the presence of early time tensile damage in the vicinity of the contact surface. In some calculations, this early time damage results in an accumulation of damage near one end of the cylinder. In other calculations, single and double bands of damage form, as desired. When creating stress-displacement curves, the displacement at the ends of the cylinder should be used to get the right modulus, if penetration between the end caps and concrete cylinder occurs.
mm = 0.039 inch Figure 24. The relative displacement between the ends of the concrete cylinder depends on the amount of interface penetration present.
psi = 145.05 MPa, mm = 0.039 inch Figure 25. The stress-displacement histories are in reasonable agreement if the relative displacement of the cylinder is used.
Figure 26. Early time tensile damage occurs in some compressive cylinder calculations in the vicinity of the contact surface interface. |