U.S. Department of Transportation
Federal Highway Administration
1200 New Jersey Avenue, SE
Washington, DC 20590
202-366-4000
Federal Highway Administration Research and Technology
Coordinating, Developing, and Delivering Highway Transportation Innovations
 |
| This report is an archived publication and may contain dated technical, contact, and link information |
|
Publication Number: FHWA-HRT-06-103
Date: August 2006 |
|||||||||||||||||||||||||||||||||||||||||||||||||||||||||||||||||||||||||||||||||||||||||||||||||||||||||||||||||||||||||||||||||||||||||||||||||||||||||||||||||||||||||||||||||||||||||||||||||||||||||||||||||||||||||||||||||||||||||||||||||||||||||||||||||||||||||||||||||||||||||||||||||||||||||||||||||||||||||||||||||||||||||||||||||||||||||||||||||||||||||||||||||||||||||||||||||||||||||||||||||||||||||||||||||||||||||||||||||||||||||||||||||||||||||||||||||||||||||||||||||||||||||||||||||||||||||||||||||||||||||||||||||||||||||||||||||||||||||||||||||||||||||||||||||||||||||||||||||||||||||||||||||||||||||||||||||||||||||||||||||||||||||||||||||||||||||||||||||||||||||||||||||||||||||||||||||||||||||||||||||||||||||||||||||||||||||||||||||||||||||||||||||||||||||||||||||||||||||||||||||||||||||||||||||||||||||||||||||||||||||||||||||||||||||||||||||||||||||||||||||||||||||||||||||||||||||||||||||||||||||||||||||
Material Property Characterization of Ultra-High Performance ConcreteCHAPTER 3. UHPC MATERIAL CHARACTERIZATION (Continued)3.3.5 Demolding Age Effect on Compressive StrengthThroughout this test program, control cylinder compressive strengths were sometimes below the anticipated value. As previously mentioned, the mix design, constituent materials, and mixing procedure were always the same. For this reason, the deviations in strength were troubling. Two observations were made during the early stages of the test program: (1) the set time of the UHPC sometimes varied and (2) in general, the older the premix, the longer the set time. Regardless of these observations, the cylinders were nearly always demolded at approximately 24 hours after casting. This delayed setting sometimes resulted in the cylinders barely having enough strength to remain intact throughout the demolding process. After the bulk of the test program was complete, an additional batch was added to the test program. This batch included two sets of 76-mm (3-inch) diameter cylinders that were demoldedat various ages after casting. One of the sets was then steam treated while the other was untreated. The earliest that any cylinders could be stripped was determined to be 28 hours after casting because of the advanced age of the premix by this point in the test program. The other cylinders were stripped at 47 and 55 hours after casting. Otherwise, the cylinders in each set were treated identically up through compression testing at 28 days.
1 MPa = 145 psi Table 13 presents the results from this set of compression tests. These results clearly indicate that the age of the UHPC at stripping has a major impact on the compressive strength. The cylinders that were stripped as soon as their integrity allowed had a 25 to 30 percent lower compressive strength at 28 days compared with the cylinders that were stripped approximately 20 hours later. Once the cylinder has gained sufficient integrity to support itself, the primary role of the cylinder mold is to retain moisture within the cylinder. The loss of that moisture barrier clearly resulted in a decrease in the moisture that was available for hydration and a resulting decrease in compressive strength.
1 MPa = 145 psi 3.3.6 Long-Term Delayed Steam Effect on Compressive StrengthAlthough the delayed steam-curing regime was designed to mimic the postponed steam curing of UHPC, it is anticipated that longer delays prior to steam treatment could occur. For this reason, two batches of UHPC were cast to focus on the compressive strength level that UHPC can attain if the steam treatment is significantly delayed. Each of these batches included 36 cylinders, half of which were untreated and half of which had a steam treatment applied at a time distant from casting. The steam treatment was the same as the standard steam treatment except for the start date. The steam treatment always started 6 days before the date of the compression testing. Table 14 presents the results of these tests. The first batch, L21, was tested at 8, 12, and 16 weeks after casting. The second batch, L22, was tested at 8, 20, and 32 weeks after casting. In both cases, the untreated cylinders and the cylinders that underwent the long-term, delayed steam treatment showed consistent compressive strengths over the months of testing. The diminishing impact of the steam treatment, delayed from 1 day to 2 weeks after casting, does not seem to continue indefinitely. By 2 months, the impact seems to have leveled off such that steaming at this time is as effective as steaming at up to 32 weeks after casting. Additionally, it is important to note that the application of the steam treatment increased the compressive strength by 30 percent, regardless of when it was applied. 3.3.7 Fiber Effect on Compression FailureThe steel fiber reinforcement included in UHPC provides a number of advantages, most notably in terms of tensile structural behavior. Normally, a compression test on high-strength concrete would result in a very brittle, dramatic failure. As noted earlier in the discussion of UHPC ompression behavior, the UHPC that is reinforced with steel fibers does not exhibit explosive failures during compression tests. Recalling figure 6, a compression test on steam-treated UHPC would likely result in a rapid load drop, but the cylinder would remain intact.
1 MPa = 145 psi A few UHPC cylinders were cast according to the normal mix design and procedures except that the steel fiber reinforcement was not added. Thus, the high compressive strength abilities of the UHPC matrix are present, but the restraining and confining effects of the fibers are absent. The est results from these cylinders indicated a dramatic change in the compression failure behavior. Figure 25 shows four still pictures of the failure of one of these cylinders. These pictures were captured from a digital video recording. The video was captured at a rate of 30 frames per second, thus the smallest increment of time over which to observe changes in behavior is 1/30 second. The failure of this cylinder occurred when small chips of UHPC began to fly off the top and bottom of the cylinder at its intersection with the platens. This chipping continued for a few seconds until a larger chip exited the top of the cylinder just 1/6 second before failure. The cylinder then rapidly and dramatically failed: Over the course of 1/30 second, the intact cylinder shattered into many small pieces of UHPC. Although this experiment was not controlled with fiber-reinforced and nonreinforced UHPC tested in parallel, the compressive strength results are still of interest. The cylinders tested averaged 200 MPa (29 ksi), with the cylinder shown in the video reaching 214 MPa (31 ksi). Note that these strengths correspond to loads of approximately 890 kN (200 kips); therefore, the Forney 4,450-kN (1,000-kip) capacity testing machine was only at 20 percent of its capacity and would not have held an inordinately high level of strain energy before failure. Figure 25. Photos. Compression failure of a steam-treated UHPC cylinder containing no fiber reinforcement (a) 1/6 second before failure, (b) 1/30 second before failure, (c) at failure, and (d) 1/10 second after failure. 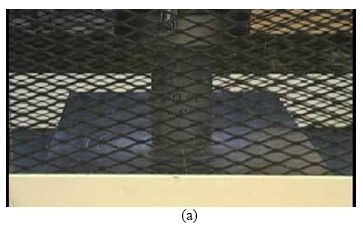 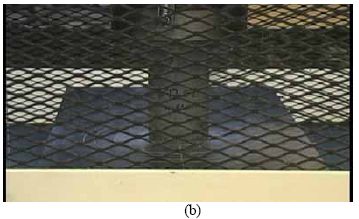 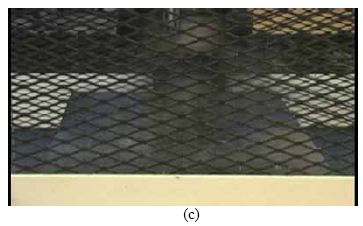 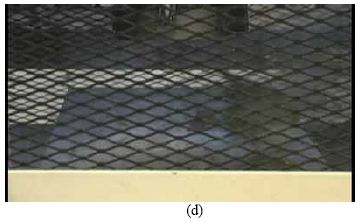 3.3.8 Load Rate Effect on Compression Testing ResultsThe compression testing discussed so far in section 3.3 was all completed with a load rate of 1.0 MPa/s (150 psi/s) during the initial elastic portion of the stress-strain response. As previously mentioned, this load rate is outside the bounds recommended by the ASTM C39 test method. Before initiating the compression testing portion of the UHPC material characterization work, a set of UHPC cylinders was cast with the focus being on the effect of various load rates on standard compression testing results. It is normally accepted that higher load rates will result in higher compression strength and modulus of elasticity results. For this reason, using the ASTM C39 load rate of 0.24 ±0.10 MPa/s(35 ±15 psi/s) is recommended for any standardized compression testing of concrete. However, the high strength results expected from UHPC mean that a single compression test on a concrete cylinder could take 15 to 20 minutes or more. This objectionably long time for a single data point led to the testing discussed below. Twenty-four cylinders with a 76-mm (3-inch) diameter were cast within a single batch of UHPC for this testing. The cylinders were all cast and steam treated according to normal procedures.The cylinders were then divided into four groups, each of which was tested at a different load rate ranging from 0.24 to 1.7 MPa/s (35 to 250 psi/s). Within each group of six cylinders, three were tested in compression according to ASTM C39. The remaining three were tested according to ASTM C469, including multiple unloads/reloads, before being tested according to ASTM C39. This testing differed from the previously discussed modulus testing, because the axial deformations were measured via a standard compressometer as described in the test method, and data on Poisson’s ratio were also collected. Table 15 presents the results of these tests. The results do not clearly indicate a change in behavior caused by the increasing load rate. For this particular batch, the compressive strength remained around 200 MPa (29 ksi), the modulus of elasticity remained around 56.5 GPa (8,200 ksi), and Poisson’s ratio was quite consistent at 0.19. These results indicate that an increase in the load rate would not be detrimental. From a practical standpoint, a compression test run at 1.0 MPa/s (150 psi/s) can be completed within 5 minutes on a steam-treated cylinder and more quickly on lower strengths of UHPC. For these reasons, a load rate of 1.0 MPa/s (150 psi/s) was chosen for all of the UHPC compression testing.
1 MPa/s = 150 psi/s, 1 GPa = 145,000 psi, 1 MPa = 145 psi 3.4 TENSION TESTINGFour types of tension tests were implemented in this research program to experimentally determine the tensile properties of UHPC. These tests included flexural testing of prismatic sections, split tensile testing of cylinders, axial tensile testing of mortar briquettes, and axial tensile testing of cylinders. The following sections discuss the test procedures and the test results. 3.4.1 Flexural PrismThe ASTM C1018 Standard Test Method for Flexural Toughness and First-Crack Strength of Fiber-Reinforced Concrete (Using a Beam With Third-Point Loading) was one test used to determine the tensile properties of UHPC.(21) This test involves the four-point flexural loading of small-scale concrete prisms. During the test, the load on and the deflection of the prism are monitored. These data are then used to determine the cracking strength and postcracking toughness response of the concrete. This test method requires specialized equipment in order to correctly load the specimen and accurately monitor the response. First, the test setup requires that the deflection measuring system must measure "net values exclusive of any extraneous effects due to seating or twisting of the specimen on its supports or deformation of the support system." Second, the loading of the prism must be completed through a "testing arrangement where specimen net midspan deflection is used to control the rate of increase of deflection using a closed-loop, servo-controlled testing system." To meet these requirements, a specialized test setup was devised. In this setup, a yoke similar to that shown in figure 2 of ASTM C1018 was used to measure the midspan deflections. LVDTs were attached to the yoke on each side of the specimen at midspan, and the yoke was attached to the specimen at mid-depth over the support points. The LVDTs bore on a plate that was epoxied to the compression face and extended to hang over the sides of the prism. Figure 26 shows two examples of the deflection measurement setup for this four-point bending test. The loading control of the test was accomplished by completing the test in an MTS® load frame. The control signal for the MTS was the midspan net deflection of the specimen as captured by the LVDTs. The signals from the two LVDTs were electronically averaged, then submitted to the MTS control panel. In this way, the deflection rate of the prism was accurately and consistently maintained at the correct level. This loading technique also limited the amount of potential energy stored in the load frame that could be transmitted into the concrete prism during the temporary stiffness loss associated with cracking. The loading apparatus used to test the prisms was reconfigurable to allow for testing of multiple sizes of prisms. The rollers and their support blocks are movable to allow for lower support spans from 152 to 406 mm (6 to 16 inches) and upper loading spans from 51 to 152 mm (2 to 6 inches). As shown in figure 26, the two upper load points and the two lower support points are steel rollers that impart no axial restraint on the prism. Torsional effects caused by misalignment between the planes of the prism faces and the rollers were overcome by placing individual shims between each roller and its bearing block. The bearing blocks under the rollers are supported by 152-mm (6-inch) deep solid steel beams that are connected to the heads of the MTS machine. These deep steel beams reduce flexibility in the loading apparatus, thus allowing for easier and more refined control of the test during cracking of the prism. The ASTM C1018 test was performed on prisms from all four curing regimes. The casting and curing of the prisms was completed following normal procedures. During casting of each prism, special care was taken to ensure that the UHPC flowed from one end of the prism to the other, thus ensuring a fiber distribution and alignment system that was similar to that which would occur in the large-scale casting of a beam or plate type flexural member. Figure 26. Photos. Prism flexural test setup for (a) a 229-mm (9-inch) span and (b) a 305-mm (12-inch) span. 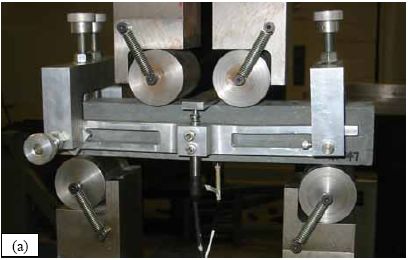 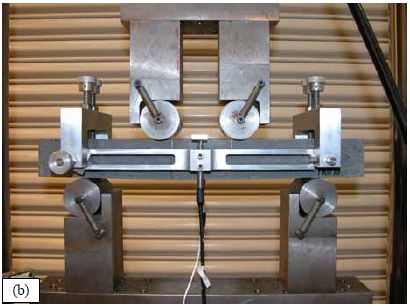
The test specification recommends a preferred standard size of molded specimen of 356 by 102 by 102 mm (14 by 4 by 4 inches), resulting in a third-point loading configuration with a 305-mm (12-inch) lower span. This specimen size was not used for a number of reasons. First, this depth of prism is on the high end of the likely thickness of UHPC plate members subject to flexural forces. Second, a shear span-to-prism depth ratio equal to one, as recommended by the specification, will create a stress field and deflection response in the prism that is substantially both flexural and shear. A larger shear span-to-prism depth ratio would much more accurately represent the flexural response of UHPC. Finally, the specification indicates that the prism crosssectional dimensions must only be at least three times the length of a fiber. This requirement can easily be met by smaller cross-sectional sizes. The test program included two prism cross sections and a total of four loading configurations. The cross sections investigated were 51- by 51-mm (2- by 2-inch) prisms and 76-mm (3-inch) deep by 102-mm (4-inch) wide prisms. The 51- by 51-mm (2- by 2-inch) prisms were cast in lengths of 279 mm (11 inches) and 432 mm (17 inches). The 76- by 102-mm (3- by 4-inch) prisms were cast 406 mm (16 inches) long. Four loading configurations were used to test the 51- by 51-mm (2- by 2-inch) prisms. These included third-point loading on 152-, 229-, and 305-mm (6-, 9-, and 12-inch) lower spans, as well as loading on a 381-mm (15-inch) lower span with 76 mm (3 inches) between the upper load points. The third-point loading with a 305-mm (12-inch) lower span was also used for the 76- by 102-mm (3- by 4-inch) cross section prisms. These various cross sections and loading configurations allow for the comparison of observed tensile behaviors, because the 51- by 51-mm (2- by 2-inch) prism on a 152-mm (6-inch) span is a scaled model of the ASTM C1018 recommended prism. Other test setups provide more realistic representations of flexural tensile material behaviors. The following procedure was used to complete the test:
The strength and toughness results and analysis presented in the next two sections are highly dependent on the correct identification of first cracking in each prism test. Plain concrete and fiber-reinforced concrete may begin to behave nonlinearly due primarily to internal microcracking before the first overall cracking of the prism; therefore, determining first cracking can be somewhat subjective. The behavior of UHPC is such that the first cracking is tensile stress cracking on the bottom flange of the prism. Thus, first cracking—recorded by the data acquisition system and physically observed on the specimen—is usually quite clear. Figure 27 shows the early parts of load-deflection response curves for both a steam and an untreated prism. This figure shows that the prism response is linear until first cracking when a clearly defined decrease in load-carrying capacity occurs. Soon thereafter the load again begins to increase. The sawtooth pattern visible in the response is indicative of additional individual cracks forming throughout the highly stressed tension face of the prism. Figure 27. Graph. Examples of first crack shown on load-deflection response curves. 
1 kN = 0.225 kip, 1 mm = 0.039 inch A total of 76 prisms were tested over the five loading/cross section configurations. Seventy-one prisms were tested successfully out of this group. The load-deflection results are presented in figures 28 through 47. Figures 28 through 31 present the results from the scaled standard ASTM C1018 test on 51- by 51-mm (2- by 2-inch) prisms with third-point loading over a 152-mm (6-inch) span. Figures 32 through 35 present the results from the 76- by 102-mm (3- by 4-inch) prisms tested with third-point loading over a 305-mm (12-inch) span. Figures 36 through 39 and 40 through 43 present the results from 51- by 51-mm (2- by 2-inch) prisms tested with thirdpoint loading on 229-mm (9-inch) and 305-mm (12-inch) spans, respectively. Finally, figures 44 through 47 present the results from the 51- by 51-mm (2- by 2-inch) prisms tested over a 381-mm (15-inch) span with 76 mm (3 inches) between the load points. Sequential results in each set have been offset by 0.1 mm (0.004 inch) to allow for clear presentation. The curing regime applied to each set of prisms is listed in the lower right corner of each set of results. Figure 28. Graph. ASTM C1018 load-deflection response results for steam-treated 51- by 51-mm (2- by 2-inch) prisms over a 152-mm (6-inch) span with third-point loading. 
1 kN = 0.225 kip, 1 mm = 0.039 inch Figure 29. Graph. ASTM C1018 load-deflection response results for untreated 51- by 51-mm (2- by 2-inch) prisms over a 152-mm (6-inch) span with third-point loading. 
1 kN = 0.225 kip, 1 mm = 0.039 inch Figure 30. Graph. ASTM C1018 load-deflection response results for tempered steam-treated 51- by 51-mm (2- by 2-inch) prisms over a 152-mm (6-inch) span with third-point loading. 
1 kN = 0.225 kip, 1 mm = 0.039 inch Figure 31. Graph. ASTM C1018 load-deflection response results for delayed steam-treated 51- by 51-mm (2- by 2-inch) prisms over a 152-mm (6-inch) span with third-point loading. 
1 kN = 0.225 kip, 1 mm = 0.039 inch Figure 32. Graph. ASTM C1018 load-deflection response results for steamtreated 76- by 102-mm (3- by 4-inch) prisms over a 305-mm (12-inch) span with third-point loading. 
1 kN = 0.225 kip, 1 mm = 0.039 inch Figure 33. Graph. ASTM C1018 load-deflection response results for untreated 76- by 102-mm (3- by 4-inch) prisms over a 305-mm (12-inch) span with third-point loading. 
1 kN = 0.225 kip, 1 mm = 0.039 inch Figure 34. Graph. ASTM C1018 load-deflection response results for tempered steamtreated 76- by 102-mm (3- by 4-inch) prisms over a 305-mm (12-inch) span with third-point loading. 
1 kN = 0.225 kip, 1 mm = 0.039 inch Figure 35. Graph. ASTM C1018 load-deflection response results for delayed steamtreated 76- by 102-mm (3- by 4-inch) prisms over a 305-mm (12-inch) span with third-point loading. 
1 kN = 0.225 kip, 1 mm = 0.039 inch Figure 36. Graph. ASTM C1018 load-deflection response results for steamtreated 51- by 51-mm (2- by 2-inch) prisms over a 229-mm (9-inch) span with third-point loading. 
1 kN = 0.225 kip, 1 mm = 0.039 inch Figure 37. Graph. ASTM C1018 load-deflection response results for untreated 51- by 51-mm (2- by 2-inch) prisms over a 229-mm (9-inch) span with third-point loading. 
1 kN = 0.225 kip, 1 mm = 0.039 inch Figure 38. Graph. ASTM C1018 load-deflection response results for tempered steamtreated 51- by 51-mm (2- by 2-inch) prisms over a 229-mm (9-inch) span with third-point loading. 
1 kN = 0.225 kip, 1 mm = 0.039 inch Figure 39. Graph. ASTM C1018 load-deflection response results for delayed steamtreated 51- by 51-mm (2- by 2-inch) prisms over a 229-mm (9-inch) span with third-point loading. 
1 kN = 0.225 kip, 1 mm = 0.039 inch Figure 40. Graph. ASTM C1018 load-deflection response results for steamtreated 51- by 51-mm (2- by 2-inch) prisms over a 305-mm (12-inch) span with third-point loading. 
1 kN = 0.225 kip, 1 mm = 0.039 inch Figure 41. Graph. ASTM C1018 load-deflection response results for untreated 51- by 51-mm (2- by 2-inch) prisms over a 305-mm (12-inch) span with third-point loading. 
1 kN = 0.225 kip, 1 mm = 0.039 inch Figure 42. Graph. ASTM C1018 load-deflection response results for tempered steamtreated 51- by 51-mm (2- by 2-inch) prisms over a 305-mm (12-inch) span with third-point loading. 
1 kN = 0.225 kip, 1 mm = 0.039 inch Figure 43. Graph. ASTM C1018 load-deflection response results for delayed steamtreated 51- by 51-mm (2- by 2-inch) prisms over a 305-mm (12-inch) span with third-point loading. 
1 kN = 0.225 kip, 1 mm = 0.039 inch Figure 44. Graph. ASTM C1018 load-deflection response results for steamtreated 51- by 51-mm (2- by 2-inch) prisms over a 381-mm (15-inch) span with 76 mm (3 inches) between loads. 
kN = 0.225 kip, 1 mm = 0.039 inch Figure 45. Graph. ASTM C1018 load-deflection response results for untreated 51- by 51-mm (2- by 2-inch) prisms over a 381-mm (15-inch) span with 76 mm (3 inches) between loads. 
1 kN = 0.225 kip, 1 mm = 0.039 inch Figure 46. Graph. ASTM C1018 load-deflection response results for tempered steamtreated 51- by 51-mm (2- by 2-inch) prisms over a 381-mm (15-inch) span with 76 mm (3 inches) between loads. 
1 kN = 0.225 kip, 1 mm = 0.039 inch Figure 47. Graph. ASTM C1018 load-deflection response results for delayed steamtreated 51- by 51-mm (2- by 2-inch) prisms over a 381-mm (15-inch) span with 76 mm (3 inches) between loads. 
1 kN = 0.225 kip 3.4.1.1 Strength The procedure implemented for the ASTM C1018 prism flexure tests allowed for accurate recording of the flexural behavior of UHPC from initial elastic behavior, through tensile cracking, to tensile fiber pullout. The strength-based results from these tests are presented in table 16. The table provides the averaged results from the prisms in each set. The first and most important result from these tests is behavior at first cracking of the UHPC matrix. As previously discussed, the first crack is an indication of the tensile cracking strength of UHPC. The load, strength, and deflection at first cracking are all listed in the table. The first crack strength is based on the equation in figure 48, which is referenced in ASTM C1018, provided in ASTM C78, and based on mechanics of materials principles assuming pure bending.(22) In the equation, fct,flexure is the flexural tensile cracking strength, P is the total load applied to the prism, l is the span, b is the width of the prism, and d is the depth. The variable η equals 1.0 for third-point loading and 1.2 for the loading configuration with a 381-mm (15-inch) span and 76 mm (3 inches) between load points. This factor accounts for the difference in the bending moment at midspan on the prism under the differing loading configurations. Figure 48. Equation. Flexural cracking strength of a concrete prism. It has been widely observed that the actual tensile cracking strength of concrete, fct, is overestimated by the tensile cracking strength results of a small-scale flexural test, fct,flexure. Carpinteri and Chiaia summarized extensive amounts of previous research on this topic.(23) They indicated that the overestimation is usually caused by depth and strain gradient effects on the flexural cross section. Chanvillard and Rigaud indicate that the concrete ahead of the crack front tends to microcrack, thus reducing stress concentrations.(24) They performed research on the UHPC that is the subject of this report. Their results indicated that the overestimation of the tensile strength is caused by the fiber reinforcement. Various correction factors have been suggested to account for this overestimation. The Association FranÇaise de Génie Civil (AFGC) Interim Recommendations for Ultra High Performance Fibre-Reinforced Concretes recommends the equation in figure 49, which varies depending on the depth of the cross section in millimeters, d, as compared to a reference depth, d0, of 100 mm (4 inches).(1) Note that this empirical equation is based on experimental data, but it has been verified for UHPC by Chanvillard and Rigaud.(24) The first crack tensile strength results as modified by this correction factor are provided in table 16. Table 16 also includes results related to the average peak load carried by each set of prisms. The peak load values tended to be between 170 and 200 percent of the cracking load values. The equivalent flexural strength corresponding with the peak load is listed. This strength is based on the equation in figure 48 and substitutes the peak load for the cracking load. This calculation is presented purely for comparative purposes, as this equivalent flexural strength has no physical meaning. At peak loading, the UHPC prism is exhibiting extensive cracking, and its midspan neutral axis no longer resides at mid-depth. Thus, the assumptions of pure bending on a uniform, elastic cross section, which are inherent in this equation, are not met. Figure 49. Equation. AFGC correction factor for concrete prism flexural strength. 
Finally, this table includes the average effective modulus of elasticity of each set of prisms. The equation in figure 50 provides the relationship between the centerline deflection of a simply supported beam with two point loads and the cross-sectional and material properties of the beam. This equation accounts for both the flexural and shear responses in the beam. In this equation, Δcl is the centerline deflection, P is the total load applied to the prism, L is the span, a is the shear span, E is the modulus of elasticity, and I is the moment of inertia. In the shear term, A’ is the effective shear area (i.e., 80 percent of the cross-sectional area for a prism) and G is the shear modulus. To calculate the shear modulus, it is assumed that the Poisson’s ratio of UHPC is 0.18. Manipulation of this equation shows that the modulus of elasticity can be calculated based on the elastic slope of the load-deflection curve and a constant term representing the load configuration and beam cross section. Figure 50. Equation. Centerline deflection of a simply supported prismatic beam. The load-deflection responses presented previously were analyzed to determine the average elastic response between 20 and 50 percent of the load at first cracking. These stiffness values, which are dependent on the test setup, were then used in conjunction with the equation in figure 50 to determine the effective modulus of elasticity. The effective modulus results tend to be higher than those based on the compression tests presented earlier in this chapter. The exception to this tendency is in the prisms where lower modulus values were observed with a span-to-depth ratio of 3. The lower modulus value in the smaller span-to-depth ratio prisms is likely due to the effects of local disturbed regions near the load application points. With this short span and these close load points, nearly the entire prism could be considered to be locally disturbed, including deformations that could add to the flexure and shear deformations. Any additional deformation would result in a lower calculated effective modulus of elasticity. Prism flexure testing of five different loading configurations for each curing regime was intended to identify the benefits and detriments of varying the prism span and cross section. From a qualitative standpoint, the easiest completion was of the 229-mm (9-inch) and 305-mm (12-inch) span tests on the 51- by 51-mm (2- by 2-inch) cross section. The behavior of the prisms in these loading configurations was observed to be more consistent than in other configurations. Also in these configurations, the moderate elastic load-displacement response decreased the difficulty encountered with the stiffer and more flexible configurations in the test setups. Quantitatively, the results from the 229-, 305-, and 381-mm (9-, 12-, and 15-inch) spans for the 51- by 51-mm (2- by 2-inch) cross section prisms were most consistent. Also, it must be mentioned that the basic intent of the ASTM C1018 test seems to be to create a state of pure bending in a concrete prism to allow for quantification of the tensile properties. As the span-to-depth ratio of the beam decreases, the proportion of the behavior that is shear based increases. Figure 51 shows the ratio of the shear to flexural deflection of a 51-mm (2-inch)-deep prism. This prism was assumed to be loaded at its third points, and it has a shear modulus equal to 61 percent of its elastic modulus based on a Poisson’s ratio of 0.18. With a span-to-depth ratio of 3, the shear deflections are 17.1 percent of the flexural deflections, thus the assumption of flexural behavior is questionable. As the span increases toward 305 mm (12 inches), the assumption of flexural behavior becomes much more reasonable. In the longer spans, the state of stress on the cross section in the constant moment region is primarily composed of stresses normal to the face of the cross section. However, the same does not hold true for the shorter spans and the more influential shear forces. Figure 51. Graph. Ratio of shear to flexural deflection for a third-point loaded prism.  1 mm = 0.039 inch
* Prism depth x width, span length, distance between upper load points 1 MPa = 145 psi, 1 GPa = 145,000 psi, 1 mm = 0.039 inch 3.4.1.2 Toughness Within concrete materials characterization testing, toughness is a term that provides some indication of the concrete’s energy absorption capability. Usually, toughness is quantified in terms of the area under a load-deflection response curve. Toughness values are specific to the testing procedure implemented. The ASTM C1018 test method presents one means of determining the toughness of fiberreinforced concrete. The test results are analyzed in terms of the area under the load-deflection curve up to specific deflection levels. The toughness results are then normalized by dividing the total area under the curve up to the specified deflection by the area under the curve up to the deflection at first cracking. ASTM C1018 defines a set of toughness indices in terms of the behavior that might be expected from a material that exhibits an elastic-plastic, flexural, load-deflection response. (Although not clearly stated in the test method, note that this reference response does not correspond to the response that would be observed for a material that exhibits elastic-plastic uniaxial stress-strain behavior.) Table 17 is reproduced from the appendix of the test method. The table provides basic information relating to the calculation of toughness indices and the expected results from various materials. Additional indices can be created in a similar fashion. Results for I30 and I40 are also presented in the following discussion.
Table 18 presents the toughness results for the sets of prismatic flexural tests. The information layout in the table is similar to table 16. Note that some results are missing for I40. In addition, some other results for I40 are from fewer than the total number of prisms listed. This is due to some prisms exhibiting fiber pullout and subsequent failure prior to reaching 20.5 times the cracking deflection. Figures 52 through 55 graphically present the toughness results from the four curing regimes. All of these results show increasing toughness through I40.
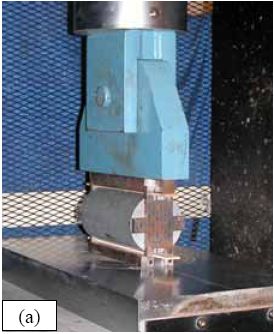
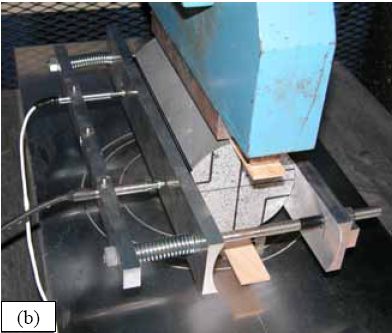
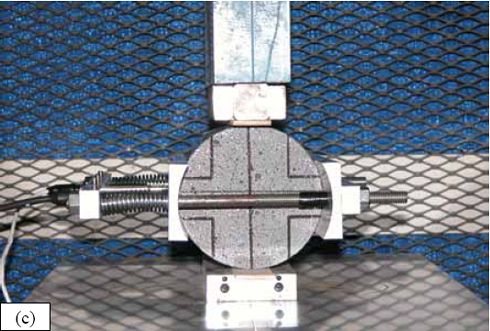
* Prism depth x width, span length, distance between upper load points Figure 52. Graph. ASTM C1018 toughness results for steam-treated UHPC prisms.  Figure 53. Graph. ASTM C1018 toughness results for untreated UHPC prisms.  Figure 54. Graph. ASTM C1018 toughness results for tempered steam-treated UHPC prisms.  Figure 55. Graph. ASTM C1018 toughness results for delayed steam-treated UHPC prisms.  Figure 56. Graph. ASTM C1018 residual strength results for steam-treated prisms.  Figure 57. Graph. ASTM C1018 residual strength results for untreated prisms.  Figure 58. Graph. ASTM C1018 residual strength results for tempered steam-treated prisms.  Figure 59. Graph. ASTM C1018 residual strength results for delayed steam-treated prisms.  Residual strength factors also are presented in table 18. These values are calculated by subtracting one toughness index from a subsequent index then multiplying the result by a normalizing factor related to the idealized elastic-plastic, flexural response. Regardless of the toughness indices chosen, the residual strength factor for the idealized elastic-plastic, flexural material will equal 100. For example, the residual strength factor, R10,20, equals 10(I20–I10). The toughness exhibited by the UHPC is quite impressive, regardless of the curing regime or test configuration. The results all tend to be at the upper end or above the ASTM C1018 predicted range for toughness of fiber-reinforced concrete. The UHPC also exhibits residual strength values that tend to increase at least through I30, and these values through this deflection level are all above the 100 reference level for elastic-plastic flexural behavior. Figures 56 through 59 provide a graphical representation of the residual strength factors. 3.4.2 Split CylinderThe tensile strength of UHPC was also measured through the ASTM C496 Standard Test Method for Splitting Tensile Strength of Cylindrical Concrete Specimens.(25) This test, often referred to as the split-cylinder test, indirectly measures the tensile strength of concrete by compressing a cylinder through a line load applied along its length. This test can be completed in a standard concrete compression testing machine, with only one special requirement: the hinged bearing that loads the specimen. This load configuration creates a lateral tensile stress in the cylinder across the vertical plane of loading. A relatively uniform tensile stress field is created over the middle 75 percent of the cylinder’s diameter along the plane of loading, and the maximum tensile stress occurs at the center of the cylinder. ASTM C496 indicates that the maximum tensile stress can be calculated based on the equation in figure 60. In this equation, P is the load applied to the cylinder, l and d are the length and diameter, and fθ is the tensile stress. Figure 60. Equation. Tensile stress in an ASTM C496 split-cylinder test.  The split-cylinder test does not determine the uniaxial tensile cracking strength of concrete. The loading configuration used in this test actually creates a biaxial stress state inside the cylinder that has been described many times.(26,27) For the purposes of this report, it is sufficient to indicate that the vertical compressive stress in the center of the cylinder is approximately three times the lateral tensile stress. This test is normally completed on standard concrete that does not contain fiber reinforcement. As such, the tensile strength results are normally clear. The cylinder will fail when its tensile strength is reached; therefore, the peak load carried by the cylinder can be used to determine the splitting tensile strength through the equation in figure 60. Fiber-reinforced concrete, and in particular UHPC, tends to behave differently. In these concretes, the initiation of cracking signifies the beginning of a new phase in the material’s behavior, but does not signify failure of the material. With UHPC in particular, the load will continue to increase after cracking, and the cracks that form during cracking will be so small that identification without microscopic investigation may not be possible. A supplemental feature was added to the ASTM 496 test because the cracking strength is the material property of interest. As the UHPC cylinder cracks, the measured length of the lateral diameter of the cylinder will show a marked increase. A lateral expansion measuring apparatus was devised and is shown in figure 61. This spring-loaded device clamps across the cylinder and measures the lateral expansion of the cylinder from load initiation through failure. The small lateral compressive force exerted by the apparatus on the specimen (less than 0.02 MPa (2 psi)) is considered negligible. Two LVDTs located near the front and back of the cylinder electronically capture the displacements, which are sent to a data acquisition system along with the load. This lateral expansion measuring apparatus is similar to a device used by Nanni in work that he completed on fiber-reinforced concrete.(28) The typical load versus lateral displacement response for a UHPC cylinder is presented in figure 62. The curve shown is the average of the results from the two LVDTs. The lateral deflection behavior is basically linear until the UHPC cracks. At cracking, a discontinuity occurs in the displacement response while the load level remains relatively constant. The total jump in displacement is usually less than 0.025 mm (0.001 inch) and could be nonexistent in a specimen that has not undergone a steam-based treatment. After cracking, a clear change occurs in the slope of the response curve. The load then continues to increase at a decreasing rate until the peak load is reached. Normal UHPC mix design and casting procedures were used for this series of tests. Twelve 4-inch diameter cylinders were cast for each curing regime. The screeded end of the cylinder was ground prior to testing, and the length of each cylinder was approximately 200 mm (7.9 inches). The cylinders were tested in groups of four at three different ages for each curing regime. The steam, untreated, and tempered steam regimes were tested at 5, 14, and 28 days after casting. The delayed steam regime was tested at 14, 21, and 28 days after casting. At 14 days, the delayed steam specimen results are more comparable to the untreated specimens than to the other delayed steam treated specimens, because the steam treatment did not occur until days 15 through 17. The initial load rate for these tests was set at 3.4 MPa/min (500 psi/min) of tensile stress according to the equation in figure 60. The rate was set above the ASTM specified rate of 0.7 to 1.4 MPa/min (100 to 200 psi/min) because of three reasons: (1) the higher tensile cracking strength of the UHPC, (2) the significant displacement that must be traversed before the peak load is reached, and (3) the reluctance to change the load rate after test initiation. Preliminary testing on UHPC prior to the initiation of these tests indicated that this increased load rate should not cause significant changes in material behaviors. Figure 63 presents the average tensile cracking results from the split-cylinder tests. As previously mentioned, cracking is defined to occur when an abrupt or semiabrupt change in specimen lateral stiffness occurs. The number of days after casting is indicated in parentheses after the curing regime’s name. The figure shows both the average stress and the ±1 standard deviation from the average. Figure 61. Photos. Split-cylinder tensile test including (a) standard test setup, (b) lateral expansion measuring apparatus, and (c) UHPC cylinder during test.
 All of the groups that underwent a steam-based curing regime exhibited a split-cylinder tensile cracking strength of between 11.0 and 12.4 MPa (1.6 and 1.8 ksi). The untreated group exhibited decidedly lower strength values, along with a clear increase in strength over time. At 5 days, the untreated group had a tensile cracking strength of 6.9 MPa (1.0 ksi), and by 28 days this strength had increased to over 9.0 MPa (1.3 ksi). Figure 62. Graph. Typical response for a UHPC cylinder during the ASTM C496 test.  1 kN = 0.225 kip Figure 63. Chart. Average tensile cracking results from the ASTM C496 test.  1 MPa = 145 psi The split-cylinder loading configuration causes vertical compressive stress and lateral tensile stress in the cylinder. This biaxial stress state has a definite effect on the postcracking behavior. The vertical compressive stresses that are parallel to any cracks cause the fiber reinforcement bridging the cracks to carry higher loads prior to pulling out of the UHPC matrix. For this reason, results derived from the peak load carried by a cylinder and passed through the equation in figure 60 are not accurate general representations of the tensile strength of UHPC. However, these peak load results may be useful for comparing fiber pullout behavior following different curing treatments. These variations in peak load results may be useful in determining whether curing was properly applied to a UHPC specimen. The average peak stress carried by these groups of specimens is presented in figure 64. This stress is calculated based on both the peak load reached and the equation in figure 60. The results show that fibers in untreated cylinders pull out earlier under this stress state, and the cylinder as a whole can only carry an equivalent stress of around 19.3 MPa (2.8 ksi). The steam treatment in the tempered steam regime enhances the behavior such that 21.4 MPa (3.1 ksi) of equivalent stress can be carried. The steam and delayed steam regimes carried the largest peak loads with average equivalent stresses of around 24.1 MPa (3.5 ksi). Figure 64. Chart. Average split cylinder peak strength from the ASTM C496 test.  1 MPa = 145 psi Frequently, the tensile strength of concrete is discussed as a percentage of the compressive strength. The results from the split cylinder tests have been normalized by the 28-day compressive strength of their control cylinders and are presented in table 19. Only the postcuring treatment results are presented, because only the 28-day compressive strengths are known for these particular batches of UHPC. The cracking stress tends to be between 5 and 7 percent of the compressive strength. The equivalent peak stress carried by the cylinders is higher, with values ranging from 12 to 16 percent. The cracking behavior must be monitored for the ASTM C496 test to provide useful results in terms of tensile cracking strength. The lateral expansion measuring apparatus (described above) allowed for quantification of this cracking behavior. Monitoring of the cracking behavior may also be possible in certain instances via audible observations. Table 20 presents the first crack parameters for each group of specimens. Aural monitoring throughout the test allowed the load at first cracking to be estimated in nearly all of the cylinders that had undergone a steam-based curing treatment. As discussed previously, the data collection during the test allowed for a specific determination of the load at first crack. The size of the first crack was also estimated based on the instantaneous lateral expansion of the cylinder at first cracking. The values presented in the table are the crack size (measured by the front or back LVDT, whichever displayed a larger instantaneous increase). These results provide a clear sense of the width of UHPC tensile stress cracks when they first occur as well as the type of instrumentation that is required to monitor or capture this behavior.
1 ksi = 6.895 MPa
1 mm = 0.039 inch
|
|||||||||||||||||||||||||||||||||||||||||||||||||||||||||||||||||||||||||||||||||||||||||||||||||||||||||||||||||||||||||||||||||||||||||||||||||||||||||||||||||||||||||||||||||||||||||||||||||||||||||||||||||||||||||||||||||||||||||||||||||||||||||||||||||||||||||||||||||||||||||||||||||||||||||||||||||||||||||||||||||||||||||||||||||||||||||||||||||||||||||||||||||||||||||||||||||||||||||||||||||||||||||||||||||||||||||||||||||||||||||||||||||||||||||||||||||||||||||||||||||||||||||||||||||||||||||||||||||||||||||||||||||||||||||||||||||||||||||||||||||||||||||||||||||||||||||||||||||||||||||||||||||||||||||||||||||||||||||||||||||||||||||||||||||||||||||||||||||||||||||||||||||||||||||||||||||||||||||||||||||||||||||||||||||||||||||||||||||||||||||||||||||||||||||||||||||||||||||||||||||||||||||||||||||||||||||||||||||||||||||||||||||||||||||||||||||||||||||||||||||||||||||||||||||||||||||||||||||||||||||||||||||