U.S. Department of Transportation
Federal Highway Administration
1200 New Jersey Avenue, SE
Washington, DC 20590
202-366-4000
Federal Highway Administration Research and Technology
Coordinating, Developing, and Delivering Highway Transportation Innovations
 |
| This report is an archived publication and may contain dated technical, contact, and link information |
|
Publication Number: FHWA-HRT-06-103
Date: August 2006 |
||||||||||||||||||||||||||||||||||||||||||||||||||||||||||||||||||||||||||||||||||||||||||||||||||||||||||||||||||||||||||||||||||||||||||||||||||||||||||||||||||||||||||||||||||||||||||||||||||||||||||||||||||||||||||||||||||||||||||||||||||||||||||||||||||
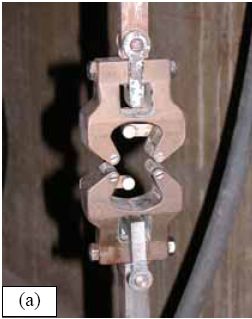
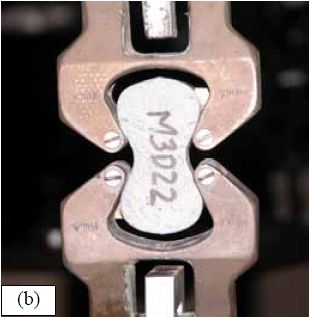
Material Property Characterization of Ultra-High Performance ConcreteCHAPTER 3. UHPC MATERIAL CHARACTERIZATION (Continued)3.4.3 Mortar BriquetteAnother means of concrete tensile strength determination is the briquette tension test. This test method, described in AASHTO T132, normally involves the direct tension testing of a small briquette cast from cement mortar.(29) The dogbone-shaped briquette is 76 mm (3 inches) long, 25 mm (1 inch) thick, and has a 645-mm2 (1-inch2) cross section at midlength. Special selfaligning grips allow for passive gripping of the specimen in the test machine and ensure uniform loading. The standard UHPC mix was used, including the steel fibers, in this test program. The casting of the briquettes is assumed to have caused some preferential alignment of the fibers because the minimum cross section of the briquette is only 645 mm2 (1 inch2). This preferential alignment would be expected to be parallel to the walls of the mold; therefore, the fiber percentage aligned across the anticipated failure plane would be higher than normal. The normal UHPC mix design and casting procedures were used. Eighteen briquettes were cast for each of the four curing regimes: three sets of six briquettes that were tested at 28, 56, and 84 days after casting. Figure 65 shows both the grips that were used to test the briquettes as well as a briquette in the grips. The testing was completed in a 98-kN (22-kip) capacity MTS testing machine. The tests were controlled based on the displacement of the crosshead of the testing machine to enable the observation of the post-peak load-displacement response. AASHTO T132 recommends loading the briquettes at 2.7 kN/min (600 lb/min). This portion of the test method was modified, and the tests were conducted at a displacement rate of 0.025 mm/s (0.001 inch/s). Given the stiffness of the load carrying apparatus between the crossheads, this displacement rate equates to approximately 4.0 kN/min (900 lb/min) throughout the initial elastic loading portion of each briquette’s response. Figure 65. Photos. AASHTO T132 setup including (a) test grips and (b) specimen.
Figures 66 through 77 present the results from the 18 tests for each curing regime. Six replicates are included in each plot, with the results shifted by 1 mm (0.039 inch) to allow for clarity. The curing regime and age (in days) at testing are included in the upper right corner of each plot. These results show that the UHPC behaved linear-elastically up to first cracking. After cracking, a slight decrease in load usually occurred followed by a load increase to a level near or above the cracking load. All of the results show a significant amount of postcracking load-carrying capacity. A more detailed discussion of these test results that focuses on strength and toughness is included in the following two sections. Similar to all batches of UHPC cast for this research program, compression tests on 7.62-cm (3-inch) diameter control cylinders were completed. The results from the control cylinders for the four batches associated with the briquette testing indicate that three of these batches exhibited strengths below the average values. The steam-treated and untreated batches showed compressive strengths 15 percent below the overall test program average, and the delayed steamtreated batch was 8 percent below the average. These results should be kept in mind as the results in the remainder of this section are discussed. Figure 66. Graph. Load-displacement response for steam-treated briquettes (28 days).  1 kN = 0.225 kip, 1 mm = 0.039 inch Figure 67. Graph. Load-displacement response for steam-treated briquettes (56 days).  1 kN = 0.225 kip, 1 mm = 0.039 inch Figure 68. Graph. Load-displacement response for steam-treated briquettes (84 days).  1 kN = 0.225 kip, 1 mm = 0.039 inch Figure 69. Graph. Load-displacement response for untreated briquettes (28 days).  1 kN = 0.225 kip, 1 mm = 0.039 inch Figure 70. Graph. Load-displacement response for untreated briquettes (56 days).  1 kN = 0.225 kip, 1 mm = 0.039 inch Figure 71. Graph. Load-displacement response for untreated briquettes (84 days).  1 kN = 0.225 kip, 1 mm = 0.039 inch Figure 72. Graph. Load-displacement for tempered steam-treated briquettes (28 days).  1 kN = 0.225 kip, 1 mm = 0.039 inch Figure 73. Graph. Load-displacement for tempered steam-treated briquettes (56 days).  1 kN = 0.225 kip, 1 mm = 0.039 inch Figure 74. Graph. Load-displacement for tempered steam-treated briquettes (84 days).  1 kN = 0.225 kip, 1 mm = 0.039 inch Figure 75. Graph. Load-displacement for delayed steam-treated briquettes (28 days).  1 kN = 0.225 kip, 1 mm = 0.039 inch Figure 76. Graph. Load-displacement for delayed steam-treated briquettes (56 days).  1 kN = 0.225 kip, 1 mm = 0.039 inch Figure 77. Graph. Load-displacement for delayed steam-treated briquettes (84 days).  1 kN = 0.225 kip, 1 mm = 0.039 inch 3.4.3.1 Strength The tensile cracking strength results are presented in figure 78. First cracking was defined as a discontinuity in the load-displacement curve caused by an instantaneous decrease in load. The results from the six replicates in each group have been averaged, and the average value is shown on the bar in the chart. The standard deviation within the results for each group is provided by the error bar, which indicates a ±1 standard deviation. Figure 78. Chart. Tensile cracking strength of UHPC briquettes.  1 MPa = 145 psi The UHPC that underwent the steam-based curing treatment showed consistent strength levels from 1 to 3 months after casting. The steam-treated UHPC tensile cracking strength is approximately 8.3 MPa (1.2 ksi), while the tempered steam-treated UHPC is 9.7 MPa (1.4 ksi). The delayed steam-treated UHPC shows a lower value of around 1.0 ksi. The untreated UHPC shows a steady increase in strength between the first and third months, with the cracking tensile strength increasing 20 percent to 7.6 MPa (1.1 ksi) by 3 months. Again, recall that the compressive strength results for three of these curing regimes were lower than anticipated, thus the tensile strength results were likely affected as well. The postcracking strength results are presented in figure 79, which has the same format as figure 78. The postcracking peak strength was defined as the highest load level reached after the tensile cracking load decreased. These results show significantly more scatter than the tensile cracking results. Of most importance, these results show that the postcracking load-carrying capacity is very similar to the precracking capacity. The fiber-reinforced nature of the UHPC matrix allows the fibers bridging a crack to carry a similar load level after cracking as the cement-based matrix did before cracking. 3.4.3.2 Toughness The toughness exhibited by UHPC after cracking is of utmost importance if the UHPC will carry tensile forces after cracking. The UHPC needs to maintain load-carrying capacity as multiple cracking occurs and as individual cracks widen. As discussed in section 3.4.3.1, one means of measuring toughness is to calculate the area under the load-displacement curve. Frequently, the area under the curve after cracking is compared with the precracking area. Using this means of comparison, normal concrete would have a toughness of nearly zero with no postcracking load-carrying capacity. On the other hand, an elastic-plastic material such as mild steel would exhibit a high post-yield toughness result. Figure 79. Chart. Postcracking peak strength of UHPC briquettes.  1 MPa = 145 psi To compare toughness results from one test program to another, the means of measuring the displacement must accurately measure the actual displacement of the concrete in question. Given the nature of the AASHTO T132 test, measuring only the displacement of the UHPC briquette is not possible. Thus, the results presented here include the overall displacement of the loading system. A quantitative comparison of the areas contained under the load-displacement curves from this test program to other test programs is not possible. However, a quantitative comparison within this test program and qualitative external comparisons are definitely warranted. Figure 80 presents the average calculated areas under the load-displacement curves after cracking for the 12 groups of briquettes tested. The area calculation includes the entire area under the curve from cracking until the load level dropped to 890 N (200 lb), which is equivalent to a stress of 1.38 MPa (200 psi) on the original minimum cross section. These results show a much larger scatter, but the average results are relatively consistent within each curing regime. The larger area results in the steam-treated regime as compared with the tempered steam-treated regime are quite instructive. Recall that the tempered steam briquettes in figures 72 through 74 show higher tensile strengths but that the shape of the postcracking portion of the curve exhibits a more rapid decrease in load capacity. The steam-treated regime clearly exhibits the best postcracking behavior, with almost twice the area as compared with the untreated briquettes. The tempered steam and delayed steam-treated regimes both show approximately 75 percent of the postcrack area as compared with the steam-treated regime. Figure 80. Chart. Area under the load-displacement response curve after cracking.  1 MPa = 145 psi For completeness, figure 81 presents the results for the ratio of the postcracking area to the precracking area under the load-deflection curve. As previously mentioned, this ratio is the standard means of measuring the toughness of a semibrittle material like fiber-reinforced concrete. The area under the curve before cracking is based on the linear elastic portion of the load-displacement response, thus eliminating the seating behaviors that occur early in each test. These results seem to indicate that the tempered steam briquettes displayed the poorest toughness results while the delayed steam- and steam-treated briquettes had the best results. However, these results are an artifact of the higher cracking strength exhibited by the tempered steam briquettes and not by their low postcracking toughness. Figure 81. Chart. Ratio of postcracking to precracking areas under the load-displacement curve.  Ratio of Areas Under Postcracking and Precracking 1 MPa = 145 psi The postcracking behavior of UHPC is dependent primarily on the steel fibers and their attachment to the UHPC matrix. Clearly, a reduction in the number of fibers in the UHPC mix eventually must lead to a decrease in the sustained tensile load capacity after cracking. The curing treatment applied to the UHPC could likely have affected the bond between the fibers and the matrix. Considering these two points, the failed specimens from the briquette tension tests were evaluated. A significant portion of the briquettes in 9 of the 12 briquette test groups were studied to determine the number of fibers that intersected the failure plane. The fibers extending from each of the failure surfaces in each briquette were counted. The totals are shown in table 21. These results are then compared with the postcrack area under the load-displacement curve to determine what portion of the area could be attributed to each fiber. Obviously, this calculation glosses over many qualifying factors that would cause different fibers to carry different loads (i.e., fiber orientation relative to crack, fibers extension on either side of crack). However, this calculation is instructive in providing some results related to the effect of curing and fiber percentages.
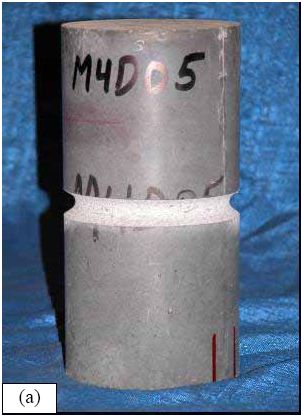
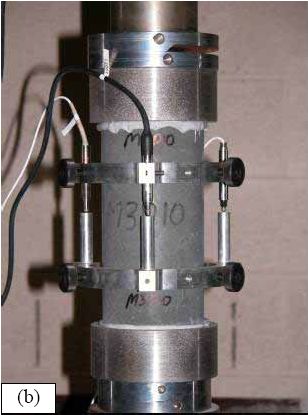
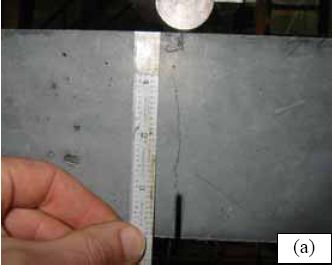
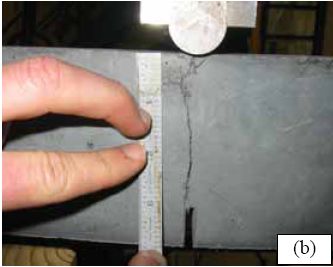
1 N-m = 0.74 kip-ft Aside from the delayed steam regime, these results indicate that the curing treatment seems to affect the ability of fibers to bond to the UHPC matrix. All of these groups contained similar numbers of fibers crossing the failure plane, but show three distinct levels of postcrack area per fiber. The steam-treated regime exhibits more than twice the toughness as the untreated regime on a per-fiber basis. Additionally, the delayed steam treatment results show that these briquettes had distinctly fewer fibers crossing the failure plane. Although this result probably could not explain the lower precracking tensile strength of these specimens, it definitely could explain the lower-than-expected postcracking peak strength. 3.4.4 Direct TensionThe fourth tension test used to quantify the material behaviors of UHPC was a direct-tension test. Unlike the flexural or split-cylinder tests, a direct-tension test applies a uniaxial tensile stress onto the concrete and monitors tensile behaviors as tensile strains are increased. In this test program, 102-mm (4-inch) diameter concrete cylinders were subjected to a uniaxial tensile load applied through the flat-end surfaces of each cylinder. Direct-tension tests are rarely performed on concrete due to the difficulties inherent in this test method. Among other things, direct-tension tests generally require complicated test setups because of the tensile gripping of the concrete and the custom equipment required for the loading and data collection. However, many researchers have investigated this topic and have attempted to develop reliable and repeatable means of testing the tensile stress-strain properties of concrete. (See references 30 through 45.) The direct-tension test setup and procedures used in this research program are an agglomeration of these testing techniques and rely most heavily on USBR 4914 Procedure for Direct Tensile Strength, Static Modulus of Elasticity, and Poisson’s Ratio of Cylindrical Concrete Specimens in Tension(42) and RILEM TC 162-TDF Uniaxial Tension Test for Steel Fibre Reinforced Concrete.(39) Concrete cylinders that had a 102-mm (4-inch) diameter and a 203-mm (8-inch) length were cast for the direct-tension tests. These cylinders were cast following the normal casting and curing procedures detailed in section 3.2. Six cylinders were prepared for each curing regime. Note that no special attention was given toward achieving the proper distribution and orientation of the fiber reinforcement within the cylinder, thus it is expected that the fibers were not necessarily randomly distributed and oriented within the cylinder. This topic will be discussed in further detail later in this section. The direct tension tests were completed between 2 and 4 months after casting. Finally, these cylinders were cast from the same four batches of UHPC as the mortar briquettes discussed in section 3.4.3. To reiterate the discussion presented in this section, three of these four batches of cylinders exhibited somewhat low compressive strengths, which indicates that the tensile behaviors could be diminished as well. Two loading configurations were used in this test program, each for half of the cylinders from each curing regime. In the first configuration, the cylinders were tested as cast. In the second configuration, the cylinders were circumferentially notched to create a plane of reduced crosssectional area and thus higher stresses per applied load. The notch was created by milling a parabolic-shaped groove into the surface of the cylinder. This groove was 6.4 mm (0.25 inch) deep, thus resulting in a reduced cylinder diameter of 89 mm (3.5 inches). The total height of the groove was 12.7 mm (0.5 inch). Figure 82(a) shows a notched cylinder, while figure 82(b) shows an unnotched cylinder ready for testing. These tests were completed in a 445-kN (100-kip) capacity MTS testing machine. The axial displacement rate of a portion of the cylinder was used as the control signal. This displacement rate was captured through three LVDTs mounted on a testing apparatus similar to the one that was discussed in section 3.3.2 and shown in figure 82(b). The signal from these LVDTs was electronically averaged and then was sent to the MTS controller. The unnotched cylinders used a 102-mm (4-inch) gage length centered on the specimen, and the notched cylinders used a 38-mm (1.5-inch) gage length centered over the notch. All cylinders were tested with a displacement rate of approximately 0.005 mm/min (0.0002 inch/min), which is the rate recommended in the RILEM test procedure. Before testing, the cylinders had their ends ground and checked for planeness. The testing machine heads and the ends of the specimen were then lightly sandblasted. A high-strength, high-modulus, rapid-setting epoxy was then applied to the testing machine heads as the cylinder was placed in the machine. A compressive load of approximately 22 kN (5 kip) was then applied to the specimen until the epoxy had cured. Note that the epoxy required at least 8 hours of cure time; thus, testing was completed on a daily cycle. The test setup and procedures discussed above were implemented in order to capture the full tensile stress-strain behavior of UHPC. Unfortunately, no behaviors after initial tensile cracking could be reliably observed and monitored. The MTS controller temporarily lost control of the cylinder during the brittle initiation of the first tensile crack. When control was regained, the cylinder had undergone some tensile fiber pullout across the crack, and the critical portion of the UHPC tensile behavior just after tensile cracking had been bypassed. This uncontrolled behavior was probably caused by a lack of sensitivity of the MTS control system due to its larger-than necessary load capacity. However, accurate postcracking results could probably not have been obtained anyway, because failure surfaces have indicated that the fiber distribution and orientation within the cylinders was not sufficiently random. Figure 82. Photos. (a) Notched cylinder and (b) testing of an unnotched cylinder.
For these reasons, the test results presented in this section focus only on the tensile cracking strength and on the modulus of elasticity of the UHPC. Table 22 provides the results from the six cylinders in each curing regime. The table indicates which specimens were notched, the location of the first tensile crack, the tensile cracking strength, and the modulus of elasticity. The modulus of elasticity was determined based on the displacement readings across the 102-mm (4-inch) gage length between the applied stresses of 2.5 MPa (360 psi) compressive and 2.5 MPa (360 psi) tensile. Recall that the cylinders were initially compressed as the epoxy cured; thus, continuous data were recorded during the test over this transition from compressive to tensile behavior. The table indicates that 11 of the 12 notched specimens failed within the notch. Aside from possible local stress concentrations caused by the notch, it is anticipated that these results accurately represent the tensile cracking strength of the UHPC. For the purposes of this research, local stress concentration effects are ignored, and these tensile cracking strengths are viewed to be accurate representations of pure tensile behavior. Only half of the unnotched cylinders failed remotely from the bearings; therefore, the unnotched specimen results are more limited. It is expected that the specimens that failed within 25.4 mm (1 inch) of the bearing had their strengths reduced by local bearing effects.
†Cracking strength results may have been influenced by crack location. The limited total data set available from the direct tension tests precludes the presentation of definitive conclusions. However, the results do provide a range in which tensile cracking of UHPC can be anticipated. For steam-treated UHPC, tensile cracking likely occurs between 9.7 and 11.0 MPa (1.4 and 1.6 ksi). For untreated UHPC, the range is from 5.5 to 6.9 MPa (0.8 to 1.0 ksi). For tempered steam specimens, the range was from 7.6 to 9.0 MPa (1.1 to 1.3 ksi). For delayed steam specimens, the range was from 9.0 to 11.0 MPa (1.3 to 1.6 ksi). The modulus of elasticity results are not affected by cracking or other localized behaviors. For this reason, three results are available for each curing regime. The steam-treated UHPC modulus of elasticity averaged 51.7 GPa (7,500 ksi). The untreated UHPC averaged 47.6 GPa (6,900 ksi). The tempered steam and the delayed steam-treated UHPC specimens both averaged 52.1 GPa (7,550 ksi). Aside from the steam-treated results, these results are somewhat higher than those presented in section 3.3 that were obtained from purely compressive testing of cylinders. Finally, the linearity of the tensile stress-strain response from minimal compressive load through tensile cracking was studied. The same stress-strain responses recorded from the testing of the unnotched cylinders that were used for the modulus of elasticity determination were also used to determine the nonlinearity of the response as cracking was approached. Overall, the results indicate that UHPC, regardless of the curing regime, exhibits very linear behavior up through tensile cracking. The theoretical linear-elastic stress-strain response based on the calculated modulus of elasticity was used to determine the actual stress deviation (reduction) at any level of tensile strain. The decrease from the linear-elastic predicted level was less than 0.14 MPa (20 psi) for 10 of the cylinders and was less than 0.21 MPa (30 psi) for the remaining 2 specimens. 3.5 FRACTURE TESTINGUnderstanding the cracking processes that occur when UHPC is stressed beyond its tensile strength is of great importance. Experience with UHPC structures has indicated that individual cracks tend to grow rapidly to a significant length, but that the width of any such crack is very small. However, this experience is based on structural testing of UHPC members with loading configurations that were not intended to create and to propagate stable cracks. A series of tests were completed on UHPC prisms to determine some of the basic behaviors of individual cracks. These tests focused on loading a prenotched prism in 3-point bending, with the load being incremented based on the opening at the mouth of the crack. The tests were loosely based on a portion of ASTM E1820 Standard Test Method for Measurement of Fracture Toughness.(46) The prisms and test setup conformed to the ASTM test method for the single-edge beam test discussed in Annex A1 of the specification. The prism had a height of 102 mm (4 inches), a width of 51 mm (2 inches), and a span of 406 mm (16 inches). The only deviation from the ASTM test method was in the size and shape of the notch cut into the prism to act as the crack initiation point. In these tests, the crack was cut into the tension flange to a distance of approximately 25 mm (1 inch). The crack was cut with a 4.75-mm (3/16-inch) thick diamondtipped saw blade. The crack’s tip had a rounded profile and was not sharpened through fatigue cycling or by any other means. Four prisms were cast for both the steam-treated and untreated curing regimes. These prisms were part of the M1P and M2P batches discussed in section 3.1. The casting of these prisms followed normal procedures except that they were cast upside-down from the orientation in which they would be tested. These prisms were cast in special steel molds that allowed for partial enclosure of the top of the prism at the ends. Therefore, the only nonmolded surface on the finished prism was the center of the bottom or tension flange in the finished specimen. These tests were completed in a 98-kN (22-kip) capacity, MTS-controlled load frame. The tests were controlled based on the crack mouth opening displacement (CMOD). The CMOD was measured via a 12.7-mm (0.5-inch) full-range-capacity clip gage that was attached to knife edges epoxied to the bottom flange on either side of the starter notch. The entire test-loading protocol was preprogrammed into the MTS Microprofiler. The testing included an initial CMOD rate of approximately 0.013 mm/min (0.0005 inch/min), as well as a postcracking rate 2.5 and 5.0 times larger. The protocol included periodic unloadings set to occur at predefined CMOD values. Unfortunately, for unknown reasons these unloadings frequently did not occur as planned. Tests were stopped after 2.5 mm (0.1 inch) of CMOD. Figure 83 shows one of the prisms undergoing this fracture test. Figure 83. Photo. Test setup for 102- by 51-mm (4- by 2-inch) notched prisms loaded on a 406-mm (16-inch) span. 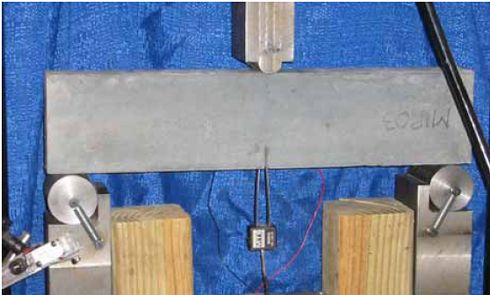 Two methods were used to monitor the crack extension during the test. The primary method involved using an optical microscope to view the fracture process zone just ahead of the tip of the crack. This microscope had a field of view of 2.5 mm (0.1 inch), which allowed the crack tip to be located with relative ease. As the test progressed, alcohol was used as a volatile penetrant to help indicate the extent of cracking. The crack extension measurements were all taken from the bottom of the prism. The second method used to monitor crack extension involved a crack propagation resistance gage. Figure 84 shows one of these gages during a test as a crack is traversing the grid. The resistance across the gage changes as more of the lines are broken due to crack extension. This method of crack monitoring was used on two prisms from each of the steam-treated and untreated curing regimes. Figure 84. Photo. Resistance foil gage to monitor crack propagation. 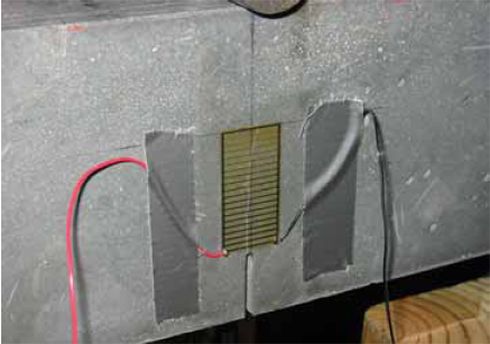 Figures 85 and 86 show photographs of crack propagation on two prisms. Alcohol was used to help indicate the locations of the cracks in both figures. Some important findings observed throughout these tests are illustrated in the figures. First, a single crack formed initially in each prism because the starter notch had sufficient depth. The crack then extended up through the prism as shown in figure 85(a). However, the fibers binding the initial crack together soon allowed for a redistribution of stresses resulting in the formation of other cracks that ran parallel to the first crack. Second, the cracks tended to extend very close to the compression flange. Figure 85(b) shows a crack extending to within 3.8 mm (0.15 inch) of the compression flange. The load and crack extension results in terms of the CMOD for each specimen are presented in figures 87 through 94. In each figure, (a) shows the overall response of the prism with the load versus CMOD behavior plotted with regard to the left y-axis and the crack extension versus CMOD behavior plotted with regard to the right y-axis. In each figure, (b) shows the initial behavior and first cracking of the UHPC prisms. Additionally, this plot shows the geometric construction used to determine when first cracking occurred. The ASTM E1820 specification defines cracking for materials that exhibit both stable and unstable first cracking. The data collected from these eight prisms indicate stable cracking behavior occurred with no clear evidence of a pop-in in any specimen. Thus, first cracking is defined by creating a linear best-fit line to the initial elastic portion of the load-CMOD response, then decreasing the slope of this line by 5 percent. The intersection of the new line with the original data is defined as the load and CMOD at first cracking. Part (b) of the referenced figures shows the required construction and the values at first cracking. Note that the initial load-CMOD response between 1.3 and 2.6 kN (300 and 600 lb) was used to define the elastic portion of the behavior, because it was beyond any initial seating-based nonlinearities and was before the initiation of cracking-based nonlinearities. The original intent of these tests had been to determine the fracture toughness, KIc, of steamtreated and untreated UHPC according to ASTM E1820. Unfortunately, the calculations associated with this specification indicate that the test as performed did not meet the standards of a qualified and size-independent KIc test. Figure 85. Photos. Prism M1P00 after (a) 86 mm (3.6 inches) and (b) 98 mm (3.8 inches) of crack extension.
Figure 86. Photo. Prism M2P03 after 93 mm (3.63 inches) of crack extension. 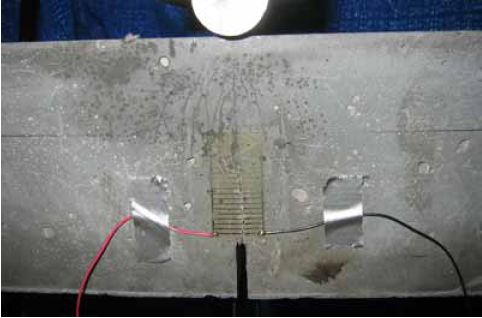 Figure 87. Graph. Load-CMOD response for steam-treated prism M1P00.  1 kN = 0.225 kip (a) Overall response including periodic unloadings.  1 kN = 0.225 kip (b) Initial response including elastic stiffness and 95 percent of elastic stiffness curves. Figure 88. Graph. Load-CMOD response for steam-treated prism M1P01.  1 kN = 0.225 kip (a) Overall response including periodic unloadings.  1 kN = 0.225 kip (b) Initial response including elastic stiffness and 95 percent of elastic stiffness curves. Figure 89. Graph. Load-CMOD response for steam-treated prism M1P02.  1 kN = 0.225 kip (a) Overall response including periodic unloadings and crack length from tension flange.  1 kN = 0.225 kip (b) Initial response including elastic stiffness and 95 percent of elastic stiffness curves. Figure 90. Graph. Load-CMOD response for steam-treated prism M1P03.  1 kN = 0.225 kip (a) Overall response including periodic unloadings and crack length from tension flange.  1 kN = 0.225 kip (b) Initial response including elastic stiffness and 95 percent of elastic stiffness curves. Figure 91. Graph. Load-CMOD response for untreated prism M2P00.  1 kN = 0.225 kip (a) Overall response including periodic unloadings.  1 kN = 0.225 kip (b) Initial response including elastic stiffness and 95 percent of elastic stiffness curves. Figure 92. Graph. Load-CMOD response for untreated prism M2P01.  1 kN = 0.225 kip (a) Overall response including periodic unloadings.  1 kN = 0.225 kip (b) Initial response including elastic stiffness and 95 percent of elastic stiffness curves. Figure 93. Graph. Load-CMOD response for untreated prism M2P02.  1 kN = 0.225 kip (a) Overall response including periodic unloadings and crack length from tension flange.  1 kN = 0.225 kip (b) Initial response including elastic stiffness and 95 percent of elastic stiffness curves. Figure 94. Graph. Load-CMOD response for untreated prism M2P03.  1 kN = 0.225 kip (a) Overall response including periodic unloadings and crack length from tension flange.  1 kN = 0.225 kip (b) Initial response including elastic stiffness and 95 percent of elastic stiffness curves. 3.6 PENETRATION RESISTANCE TESTINGPenetration resistance testing was completed on early age UHPC to determine the times of initial and final setting. The testing was completed nominally in accordance with the AASHTO T197 standard test method.(47) The primary difference between the T197 test procedure and the one undertaken was that the UHPC was used as cast and was not sieved to obtain a mortar sample. The lack of coarse aggregate and the ease with which a penetration probe could be inserted into fresh UHPC allowed for this change in test procedure. The T197 penetration resistance test is performed by forcing a flat-headed probe into a sample of fresh concrete. The surface area of the probe and the force required to insert it are used to determine the penetration resistance in psi. Initial setting is defined as when the concrete reaches a penetration resistance of 3.4 MPa (500 psi). Final setting is defined as when the concrete reaches a penetration resistance of 27.6 MPa (4,000 psi). The probe sizes range from 645 mm2 to 16 mm2 (1 inch2 to 0.025 inch2). Preliminary testing indicated that the smallest probe could be used to provide consistent results in both the initial and final setting ranges. Additionally, the use of a single probe size eliminates one source of error within the results. For these reasons, the smallest probe was used exclusively in this study. The penetration testing was performed in conjunction with the compression stress-strain response testing described in section 3.3.2. The requirements of these tests along with the delayed set times inherent in UHPC made the collection of penetration resistance data troublesome. In general, UHPC tends to exhibit virtually no setting for at least 12 hours. Sometime thereafter, the concrete will begin to set and will then quickly reach both initial and final set. This timetable led to the collection of partial penetration resistance results from four different batches of concrete. Table 23 provides the penetration resistance results. The table indicates the batch from which the penetration resistance specimens came and the subsequent curing action which was applied to all other specimens in that batch. However, it must be reiterated that no curing actions were performed on any of the penetration resistance specimens. These results show that the initial set for this particular UHPC mix design, cast and maintained under laboratory conditions, occurred around 15 hours. The final set occurred a few hours later at approximately 17 hours after casting.
3.7 SHRINKAGE TESTING3.7.1 Long-Term Shrinkage TestingLong-term shrinkage testing of the unrestrained, hardened UHPC was completed according to ASTM C157.(48) Three prisms, 76 mm by 76 mm by 280 mm (3 inches by 3 inches by 11 inches), were cast for each curing regime. Gage studs were cast into the end of each prism so that the length change could be measured according to ASTM C490.(49) After casting, the prisms were kept in a laboratory environment until demolding, which occurred at approximately 22.5 hours. Table 24 shows the demolding time for each curing regime.
Each prism had its initial length reading recorded within 30 minutes after demolding. The time of this initial reading was set by the demolding time as shown in table 24 and was not precisely 24 hours as recommend by the specification. The reading also did not capture some of the early age shrinkage of the UHPC, which will be discussed in the following section. All prisms were stored and measured in a temperature and humidity controlled room per the specification except for the duration of any steam-based treatment. Measurements of the changes in length were recorded on a daily, then weekly, then monthly basis for 1 year. A special emphasis was placed on recording a measurement both before and after any curing treatment was applied to any prism. Figure 95 shows the results of these tests up to 250 days after demolding. After that time, very little change was observed in the recorded values. Figure 95 also provides best-fit approximations of the shrinkage behavior. The approximating equation, shown in figure 96, is a modification of the equation recommended in ACI 209R-92, where it is recommended that A equal 35.(50) In the research, st is the shrinkage at a given time, t is the time in days, sult is the ultimate shrinkage that the concrete will undergo, and A is a variable defining the shape of the curve. Figure 95 shows that the prisms that underwent steam or delayed steam treatment exhibited no discernible post-treatment shrinkage. This result corroborates Acker’s shrinkage behavior theory presented in chapter 2.(12) In comparison, the untreated and tempered steam-treated prisms show continued shrinkage past 4 months of age. Even so, all the prisms reached at least 95 percent of their ultimate shrinkage by 2 months after demolding. For comparison, the ACI 209R-92 recommended equation indicated that a normal concrete might have reached 60 percent of its ultimate shrinkage at this age. Figure 95. Graph. Long-term shrinkage results.  Figure 96. Equation. Shrinkage as a function of time after casting.  3.7.2 Early Age Shrinkage TestingThe results presented in section 3.7.1 show that this concrete can exhibit large, unrestrained shrinkage strains regardless of the curing applied. More importantly, the shrinkage exhibited tends to occur much earlier in the overall behavior than would normally be expected. For these reasons, the ASTM C157 specification and its requirement that the concrete needs to have set prior to the recording of the initial measurement seems ill-suited for determining the full, unrestrained shrinkage behavior of this concrete. To quantify this early age shrinkage behavior, a test was devised to measure the unrestrained shrinkage of a prism starting at casting. An embedded strain measuring device (Geokon 4202 Vibrating Wire Strain Gage) was cast into the center of a prism. This type of gage, shown in figure 97, measures strain by monitoring the resonant frequency of a wire tensioned between two end blocks that are embedded in the concrete. Aside from the gage embedment, the mixing, casting, and demolding procedures were the same as the ones followed for the long-term shrinkage prisms discussed above. Vibrating wire gages were embedded into one prism that was receiving the steam treatment and into another prism that was subjected to the untreated curing regime. The gages monitored the shrinkage for the first 17 days after casting. After demolding, standard ASTM C490 length change measurements were also recorded for verification purposes. Figure 97. Photo. Embeddable vibrating wire gage. 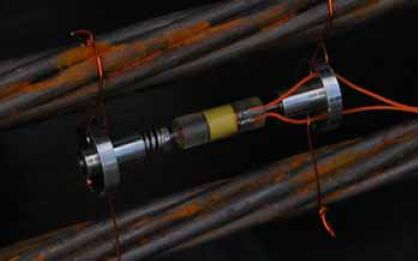 Figure 98 shows the unrestrained shrinkage results from these embedded strain gages. The premix for this particular batch was over 150 days old, thus the initial setting was slower and the prisms were demolded at 28 hours. The steam-treated prism was steamed from hours 29 to 77 as shown in the figure, while the untreated prism was maintained in a laboratory environment. Figure 98. Graph. Early age shrinkage.  The figure shows that this concrete exhibits rapidly occurring, large-value, early age shrinkage. The steam-treated prism reached a total of 850 microstrain, and the untreated prism was continuing to exhibit some shrinkage beyond the 790 microstrain recorded at 40 days after casting. Of greater interest is the rate at which the shrinkage occurs. Table 25 provides shrinkage rates in microstrain per hour that were obtained at discrete times during the early age of these two prisms. In particular, note that the shrinkage rate is over 60 microstrain per hour at 1.18 days, which is just after the prisms are demolded. This high rate of shrinkage soon drops off, but in total over 400 microstrain of shrinkage occurred in the untreated prism in the 24 hours following the 20-hour mark when shrinkage started to occur. For reference, concrete usually has a tensile cracking strain of between 150 and 250 microstrain.
|
||||||||||||||||||||||||||||||||||||||||||||||||||||||||||||||||||||||||||||||||||||||||||||||||||||||||||||||||||||||||||||||||||||||||||||||||||||||||||||||||||||||||||||||||||||||||||||||||||||||||||||||||||||||||||||||||||||||||||||||||||||||||||||||||||