U.S. Department of Transportation
Federal Highway Administration
1200 New Jersey Avenue, SE
Washington, DC 20590
202-366-4000
Federal Highway Administration Research and Technology
Coordinating, Developing, and Delivering Highway Transportation Innovations
 |
| This report is an archived publication and may contain dated technical, contact, and link information |
|
Publication Number: FHWA-HRT-06-103
Date: August 2006 |
||||||||||||||||||||||||||||||||||||||||||||||||||||||||||||||||||||||||||||||||||||||||||||||||||||||||||||||||||||||||||||||||||||||||||||||||||||||||||||||||||||||||||||||||||||||||||||||||||||||||||||||||||||||||||||||||||||||||||||||||||||||||||||||||||||||||||||||||||||||||||||||||||||||||||||||||||||||||||||||||||||||||||||||||||||||||||||||||||||||||||||||||||||||||||||||||||||||||||||||||||||||||||||||||||||||||||||||||||||||||||||||||||||||||||||||||||||||||||||||||||||||||||||||||||||||||||||||||||||||||||||||||||||||||||||||||||||||||||||||||||||||||||||||||||||||||||||||||||||||||||||||||||||||||||||||||||||||||||||||||||||||||||||||||||||||||||||||||||||||||||||||||||||||||||||||||||||||||||||||||||||||||||||||||||||||||||||||||||||||||||
Material Property Characterization of Ultra-High Performance ConcreteCHAPTER 3. UHPC MATERIAL CHARACTERIZATION (Continuted)3.8 CREEP TESTING3.8.1 Long-Term Creep TestingThe long-term compressive creep testing of the UHPC was conducted according to ASTM C512.(51) Four cylinders, 102 mm (4 inches) in diameter by 204 mm (8 inches) long, were cast for each curing regime for these tests. Two additional half-height cylinders were cast for each curing regime to act as loading blocks. All cylinders had their ends ground to within 0.5 degree of parallel. The testing was completed using hydraulically actuated load frames in a room that was controlled for temperature and humidity. No attempt was made to retard moisture gain or loss from the cylinders either prior to or during the test.
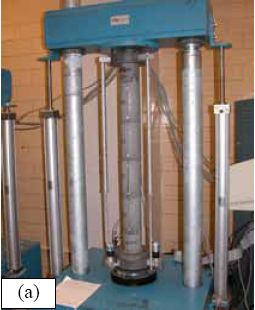
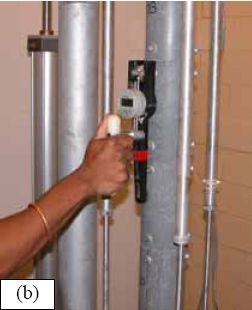
* Prism was undergoing Steam treatment The four cylinders for each curing regime were instrumented with Whittemore points before being stacked into a load frame. The Whittemore points were attached to each cylinder at three locations around the circumference with a 152-mm (6-inch) nominal gage length. Measurement of the points was completed before loading, immediately after loading, and periodically for 1 year. Figure 99 shows creep cylinders in the load frame as well as the method used to measure the Whittemore points. The creep testing was initiated for each curing regime after the curing treatment was applied. For the steam and tempered steam cylinders, the creep loading was initiated 4 days after casting. Loading was initiated 21 days after casting for the delayed steam cylinders and 28 days after casting for the untreated cylinders. The load level applied to each set of cylinders was 77 MPa (11.2 ksi), which is 40 percent of 193 MPa (28 ksi), the anticipated compressive strength of a steam-treated cylinder. Figure 99. Photos. (a) Creep cylinders in load frame and (b) measurement of creep.
Table 26 provides the creep testing results for the four curing regimes. The 28-day average compressive strength is also shown. Note that in all cases the load applied was in excess of the ASTM recommended load. The initial elastic strain was mechanically measured on the cylinders. The final creep strain is the estimated long-term value that the strain in the cylinders asymptotically approached. Intermediate creep strain values were calculated by subtracting the long-term shrinkage and the initial elastic strain from the overall measured strain. A best-fit approximation, discussed below, allowed for the determination of the final asymptotic value. Note that the subtraction of the long-term shrinkage from the recorded creep strain assumes that creep and shrinkage are uncoupled behaviors. However, research has indicated that these behaviors are dependent on one another in UHPC.(12) In this research, the shrinkage strain was subtracted from the creep strain for two reasons. First, some of the measured creep strain was necessarily due to shrinkage. Second, the overall shrinkage strains were small or nonexistent, thus the total error introduced was minimal. If the shrinkage strain were not subtracted from the creep strain for the untreated and tempered steam-treated specimens, the creep coefficients would have been less than 10 percent higher.
1 MPa = 145 psi The creep coefficient, Ccu, is defined as the final asymptotic amount of additional creep strain that occurs over time divided by the initial elastic strain that occurs when load is first applied. The specific creep, δcu, is defined as the creep coefficient divided by the elastic modulus of the concrete. For reference, creep coefficients for concrete are normally in the range of 1.5 to 3.0, and specific creep values normally range from 35 to 145 microstrain per MPa. Recall the discussion in section 2.4.3 regarding the creep and shrinkage of UHPC. The results presented here correlate well with that discussion in that steam and delayed steam-treated UHPC exhibit extremely low creep coefficients, while the tempered steam-treated and untreated UHPC exhibits higher creep coefficients. Specifically, note that the delayed and tempered steam specimens had similar compressive strengths and load levels, but that the tempered steam exhibited more than twice as much creep strain. The more severe steam treatments should cause more rapid and more complete self-desiccation of the UHPC, thus leading to less creep of the concrete. A plot of the creep data acquired during the year of testing is shown in figure 100. The creep strain shown is the additional strain observed after the initial loading of the cylinders. The data presented are the average results from the four cylinders in each curing regime. The figure also includes best-fit approximations for each dataset. The best-fit curves are based on the equation shown in figure 101, wherein t is the time in days since load initiation, εct is the creep strain at that time, and A and B are variables that define the shape of the curve. This equation is loosely based on a creep equation suggested by Branson.(52) 3.8.2 Early Age High-Stress Creep TestingA test program was initiated to investigate the dimensional stability of UHPC that was subjected to compression loading early in its strength gain. This test program was designed to answer questions related to the delay required prior to stressing a prestressed UHPC girder. Although the rapid-strength gain of UHPC is beneficial with regard to the stressing of a girder, it is important to know what portion of that strength gain is actually useable. Short-term creep tests were conducted on UHPC cylinders that were of moderate compressive strength. Two strength levels were investigated: 59 and 86 MPa (8.5 and 12.5 ksi). Within one batch of UHPC, 102-mm (4-inch) diameter cylinders were cast for creep tests and 76-mm (3-inch) diameter cylinders were cast to determine the concurrent compressive strength of the UHPC. The specimen preparation procedures for the creep cylinders mimicked the procedures that were followed for the ASTM C39 compression tests that were previously discussed, including sulfur capping of the cylinder ends due to the relatively low compressive strengths. Figure 100. Graph. Long-term creep results.  Figure 101. Equation. Creep as a function of time after loading.  The creep testing was completed in a 445-kN (100-kip) capacity MTS testing machine. Each cylinder rested one end on a flat steel bearing and was loaded through the other end by a spherical bearing. Each cylinder was loaded at a computer-controlled constant load rate of 1.0 MPa/s (150 psi/s) until the desired compressive load level was reached. This load level was then maintained for 30 minutes, after which the load was removed at 1.0 MPa/s (150 psi/s). The deformation of the cylinder was monitored throughout the test via three LVDTs that were mounted on two parallel rings attached to the cylinders. This deformation measurement system was the same as the one used in the elastic modulus testing (previously discussed in section 3.3.2). A photograph of the test setup is provided in figure 102. The early age creep results are presented in table 27. The table provides the cylinder identifier, the compressive test at the time of creep testing based on concurrently tested 76-mm (3-inch) diameter cylinders, and the stress level maintained during the creep test. The stress levels tested ranged from 60 percent of the compressive strength to just over 90 percent. Figure 102. Photo. Short-term creep test setup. 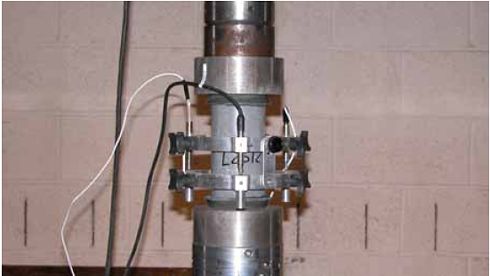
1 MPa = 145 psi Table 27 lists the 30-minute creep coefficient, Cc-30, for each of the cylinders that was able to carry the load through the end of the test. This creep coefficient is similar to the standard creep coefficient, except that here it equals the amount of additional creep strain that occurred during the 30 minutes divided by the initial elastic strain when the constant load level was reached. The two cylinders loaded to stress levels above 90 percent of the compressive strength both failed, and thus no value of Cc-30 is listed. Figures 103 and 104 show plots of the results of these tests. The observed strain values have been normalized on the strain when the constant stress level is first reached. In this way, the effect of stress level on early age creep is clearly visible. At both strength levels, stressing to above 85 percent causes twice the creep strain to occur, and stressing above 90 percent caused failure. Even stressing to only 60 percent caused a significant amount of creep strain to accumulate in a short time. Figure 103. Graph. Early age creep behavior of 55 to 65 MPa (8.0 to 9.5 ksi) UHPC.  Figure 104. Graph. Early age creep behavior of 86 MPa (12.5 ksi) UHPC.  3.9 COEFFICIENT OF THERMAL EXPANSIONThe coefficient of thermal expansion of UHPC was measured through the use of the provisional AASHTO test specification, TP60-00.(53) The test method determines the coefficient of thermal expansion (CTE) by measuring the length change of a concrete cylinder in a variable temperature water bath. Three 102-mm (4-inch) diameter UHPC cylinders from each of the four curing regimes were tested. Normally, the degree of water saturation of a concrete will influence its CTE. To counteract this fact, the test method requires that the concrete needs to be in a saturated condition before testing. In the current testing of UHPC, the saturation of the cylinders before testing was considered to be detrimental to the final results for two reasons. First, one of the primary variables in the overall test program is the curing condition of the UHPC at the time of testing. Saturating the UHPC would change the condition of the UHPC by introducing more water into the matrix, which could then react with unhydrated cement. Second, because saturation of the UHPC is problematic due to its low permeability, determining when a specific degree of saturation was reached would be difficult. Thus, the exterior surfaces of the cylinders, aside from the bearing points of the supports and LVDT, were sealed with epoxy before testing. The testing of the 12 cylinders was completed after they had undergone their complete curing treatment. All the cylinders were at least 2 months old. The untreated cylinders were the oldest at 4.5 months at the time of testing. The results from the CTE testing are shown in table 28. In general, the CTE of UHPC is around 15 x 10-6 mm/mm/°Celsius (C) (8.3 x 10⁻⁶ inch/inch/°Fahrenheit (F)). This value is somewhat higher than the normally expected value for concrete of around 10 x 10-6 mm/mm/°C (5.6 x 10⁻⁶ inch/inch/°F). However, recall that UHPC contains both high cement content and no coarse aggregate. Hydrated Portland cement paste has been reported to have a CTE of between 11 x 10-6 and 16 x 10-6 mm/mm/°C (6.1 x 10⁻⁶ and 8.9 x 10⁻⁶ inch/inch/°F), and aggregates tend to exhibit lower CTE values.(54)
1 mm/mm/°C = 1.8 inches/inches/°F 3.10 HEAT OF HYDRATIONThe amount of heat that UHPC generates during initial curing is of interest for two reasons: (1) it can be used as an indicator of other behaviors and (2) it could cause detrimental behaviors if not accounted for in the design. Time-temperature data were gathered for 15.24-cm (6-inch) diameter cylinders during the first few days after casting. This testing was completed on two UHPC mixes. The first mix was the standard UHPC mix that has been discussed throughout this report. The second mix included a slight modification of the mix design in that no accelerator was added. Specifically, 30.0 kg/m3 (1.87 lb/ft3) of Rheocrete CNI was eliminated from the mix, and an extra 32.0 kg/m3 (2.00 lb/ft3) of water was added. The time-temperature results were collected for cylinders in three environments. Figure 105 shows the heat that was generated by cylinders in a normal laboratory environment. These results indicate that the accelerator can have a significant effect on set time, but that the overall level of heat generation is not significantly different. Figure 106 shows the heat that was generated by cylinders that were kept in a normal laboratory environment until setting began, after which the steam treatment was applied. Again, the accelerator’s primary impact seems to be in the rate of setting and not in the peak heat generated. Note that the steam treatment of the accelerated mix was started earlier in the setting behavior, thus impacting the comparative level of the peak temperatures recorded. Figure 105. Graph. Heat generated in 152-mm (6-inch) diameter cylinders during initial curing.  °F = 1.8 (°C) + 32 The difficulty with the previously discussed methods of measuring the heat generated by the UHPC is that local conditions within a laboratory environment can vary. Air currents that aid in the dissipation of heat can have a significant impact on final results. To address this issue, timetemperature data were also collected using a well-insulated calorimeter. For these tests, each 152-mm (6-inch) diameter cylinder was placed in a Quadrel iQdrumTM heat signature calorimeter and monitored for 6 days. The results are shown in Figure 107. Through the use of the calorimeter, the effect of the accelerator becomes very clear. The accelerator causes a slow temperature rise to occur before setting and caused setting to begin over 1 day earlier. Heat was generated more quickly during setting, but the peak temperature reached by the cylinder was only 3 °C (5.4 °F) higher than in the unaccelerated mix. Note that these relative changes between mix designs are instructive; however, the actual time-temperature and setting behaviors of any UHPC mix will depend on many other factors as well (i.e., age of premix, precise environmental conditions, quantity of accelerator). Figure 106. Graph. Heat generated in 152-mm (6-inch) diameter cylinders from casting through steaming.  °F = 1.8 (°C) + 32 Figure 107. Graph. Heat signature for 152-mm (6-inch) diameter cylinders in a well-insulated calorimeter.  °F = 1.8 (°C) + 32 3.11 AIR VOID ANALYSISAn air void analysis was completed on the UHPC. The modified point-count method of ASTM C457 was used to determine the air void structure.(55) The variables investigated in this testing included the effect of the analysis location within individual cast cylinders, the effect of the time a cylinder was held on a vibrating table after casting, the effect of mix stiffness, and the effect of using an accelerator in the mix design. The casting procedure was as follows. The UHPC was mixed as usual, following the normal mix design and procedure, except that an unaccelerated mix (as described in section 3.2) was included. The UHPC was then cast into 152-mm (4-inch) diameter plastic cylinder molds. The filling of the molds differed from the usual procedure in that some of the molds were filled without using the vibrating table while others were filled on the vibrating table and were then held in place on the table for a specific length of time. After casting, the cylinders were screeded, covered in plastic, and left in a laboratory environment to set. The preparation and testing of the cylinders for the air void structure analysis was as follows. After setting, the cylinders were cut in half lengthwise. One of the two halves was then polished using up to 800-grit sandpaper. Each cylinder’s half was then divided into a top and bottom section on its flat face. Modified point-count measurements were then completed on each of these sections. Because this UHPC did not contain any coarse aggregate, the fibers were counted as coarse aggregate within the data collection procedure. In total, each air void data collection set covered an area of 6,770 mm2 (10.5 inches2) and traversed a length of 1,270 mm (50 inches) while counting 1,429 points. The results from these tests are presented in table 29. The results are grouped into sets for each of the three mixes tested. For reference, the stiff mix has a flow table reading of 165 mm (6.5 inches) after 20 impacts, and the normal flow mixes both have readings of 190 mm (7.5 inches) after 20 impacts. Each pair of rows shown with a common vibrating table time is the top and bottom results from the same cylinder half. Although some slight differences were observed in various groupings of specimens, the limited sample set makes drawing specific conclusions difficult. In general, the air content across the range of mixes and specimen locations was approximately 6.5 percent. The bottom of the cylinders tended to have slightly more air, likely due to air in the top of the cylinders being removed by vibration. The cylinders that were held on the vibrating table for 300 seconds after filling also tended to have a decrease in air content. The stiffer mix tended to have slightly less air than the more flowable mix, and the results of the accelerated and unaccelerated mixes had no clear differences. 3.12 STEEL FIBER DISPERSION TESTINGDispersion of fibers throughout UHPC is a necessary part of achieving many of its material properties. In this section, a simple set of tests is described in which the dispersion of fiber throughout UHPC cylinders was measured. This batch of UHPC, L03, exhibited a relatively fluid rheology with a flow table result after 20 impacts of 235 mm (9.25 inches).
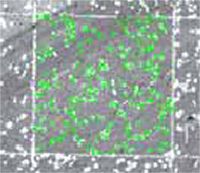
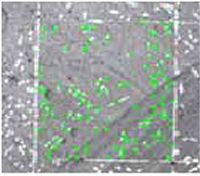
1 mm = 0.039 inch, 1 mm2/mm3 = 25.4 inches2/inches3 The 76-mm (3-inch) diameter cylinders for these tests were cast without the use of a vibrating table, and some of the cylinders were then impacted on an ASTM C230 flow table.(56) After the cylinders had gained sufficient strength, they were cut in half along their length. Four 645-mm2 (1-inch2) areas were then marked on the flat face of the cylinders. The delineated areas were located in a line along the length of the cylinder at a 12.7-mm (0.5-inch) spacing. The fibers contained within each area were then counted. Five cylinders were tested according to this procedure. Each of these cylinders underwent a different number of impacts on the flow table, ranging from 0 to 100. The fiber counting results are presented in figure 108. The results seem to indicate that more fibers tend to be located toward the bottom of each cylinder. Whether this result is caused by the impacts administered on the flow table or is an artifact of the method used to pour the UHPC into the cylinder molds is not clear. Figure 108. Graph. Fiber dispersion analysis results for cylinders impacted on an ASTM C230 flow table. 
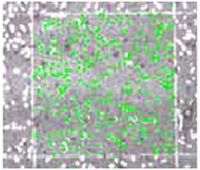
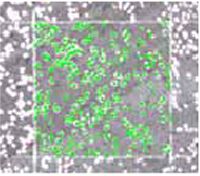
1 mm2 = 0.002 inch2 Of greater importance is the wide range of fiber concentrations evident throughout the five cylinders. Figure 109 shows the four areas measured on the cylinder that underwent 25 impacts. One green dot has been placed on the head of each individual fiber. Clearly, casting technique is very important if equal dispersion of fibers throughout the mix is desired. 3.13 DURABILITY TESTINGA series of durability tests were conducted to determine the resistance of UHPC to various environmental aggressors. These tests included measurement of the chloride ion penetrability, scaling and freeze-thaw resistance, abrasion resistance, and alkali-silica reaction susceptibility. The results are detailed throughout this section. Figure 109. Photos. Fiber dispersion analysis photographs for a 645-mm2 (1-inch2) area in the (a) bottom, (b) lower middle, (c) upper middle, and (d) top of a cast cylinder.
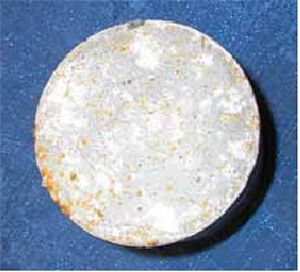
3.13.1 Rapid Chloride Ion Penetrability TestingThe ability of concrete to resist ingress of chloride ions can result in a significantly more durable concrete. The ASTM C1202 test for the Electrical Indication of Concrete’s Ability to Resist Chloride Ion Penetration.(57) frequently referred to as the rapid chloride ion penetrability test, was conducted on specimens from the four UHPC curing regimes. This test approximates the resistance that a concrete may exhibit to chloride ion penetration by measuring the amount of electrical current that passes through a 51-mm (2-inch) thick slice of concrete over 6 hours. A 60-volt direct current (DC) potential is applied across the slice of a 102-mm (4-inch) diameter cylinder, while a sodium chloride solution is applied to one side of the slice, and a sodium hydroxide solution is applied to the other side. Figure 110 shows a cylinder slice before being tested and while a test is in progress. The cylinders were cast and cured following normal procedures. For these tests, each cylinder was cast in a 102-mm (4-inch) diameter mold that was filled to 76 mm (3 inches). After both demolding and the application of any curing treatment, the cylinders were cut to length, and both ends of the cylinder were then ground to create a uniform finish. The outside circumference of each cylinder was sealed with epoxy. The standard amount of steel fiber reinforcement was included in all cylinders. The short, discontinuous nature of the steel fibers in the UHPC matrix allowed for this test to be completed without shortening the circuit or generating significant heat in the ponded fluids. Results from these tests are presented in table 30. Three tests were performed for each curing regime at 28 days after casting. An additional three tests were performed on the untreated and tempered steam-treated regimes at 56 days, because these regimes had exhibited slightly higher results during the first tests. Aside from the untreated tests from 28 days, all of the results are in the negligible range as defined by ASTM C1202. Also, the untreated and tempered steam-treated regimes exhibited significant reductions in charge passed between 28 and 56 days. Figure 111 shows averaged results for current versus time from three sets of cylinders. For reference, if 0.003 amps of current were passed through the concrete for the duration of the test, then the total charge passed would be 65 coulombs. Figure 110. Photos. (a) Cylinder and (b) setup for rapid chloride ion penetrability test. 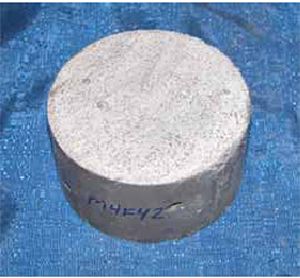
(a)
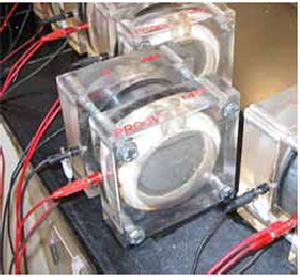
(b)
3.13.2 Chloride PenetrationIn conjunction with the chloride ion tests described in section 3.13.1, standard chloride ion penetration testing was conducted according to the AASHTO T259 specification.(58) This test, often referred to as the chloride ponding test, entails ponding a 3-percent sodium chloride solution on the surface of the concrete for 90 days. After 90 days, the level of migration of chloride ions into the concrete is determined. This test was conducted on three specimens from each of the curing regimes. The specimens were cast in 102-mm (4-inch) diameter steel cylinder molds that were filled at least 76 mm (3 inches) full during casting. After both demolding and the application of any curing treatment, the circumferential surface of each cylinder was coated in epoxy. A section of rubber hose was then slid over the cast face end of the cylinder and affixed with a hose clamp. Finally, 28 days after casting, the sodium chloride solution ponded on the cylinder face. Note that the solution was ponded on the steel mold cast face of the cylinder to replicate the UHPC surface that would have been achieved in a precast concrete production facility. Figure 111. Graph. Average current passed versus time results for three sets of cylinders. 
The AASHTO T260 standard test method was used to sample and test the concrete following the ponding.(59) Samples were taken from each cylinder at depths of 13, 25, 38, 51, 64, and 76 mm (0.5, 1.0, 1.5, 2.0, 2.5, and 3.0 inches) from the ponded surface. The samples were obtained by using a drill press with a 6.3-mm (¼-inch) masonry bit to drill into the side of the cylinder at the correct depth. Approximately 15 grams of the pulverized concrete were captured at each specified depth. The steel fiber shavings were then magnetically removed from each sample of the concrete powder. Thus, at least 10 grams of powder were available for the chloride ion testing. The chloride ion testing was conducted according to Procedure A, Section 5.2: Procedure for Total Chloride Ion Content. The chlorides were unlikely to penetrate any significant distance into the concrete because of the penetrability of this concrete. This allowed a large collection of background chloride content samples to be obtained at 64 and 76 mm (2.5 and 3.0 inches). The average background chloride ion content in kg/m3 of concrete was determined to be 0.051 with a standard deviation of 0.004. Figure 112 presents the corrected results for these tests. The removal of the background chloride content from each sample caused some of the samples to seem to exhibit negative chloride ion contents. The AASHTO specification indicates that these results should be rounded up to zero. Overall, the chloride ion content in the UHPC for all of the curing regimes is extremely low. There is some trend toward higher chloride ion contents near the ponded surface; however, the amount of chlorides that migrated into the concrete over 90 days is still extremely small. Figure 112. Graph. Chloride ion content results after 90 days of ponding. 
1 kg/m3 = 1.686 lb/yd3, 1 mm = 0.039 inch
An additional benefit of this set of tests is that the behavior of the surface of this steel fiberreinforced UHPC can be qualitatively observed. Figure 113 shows a tempered steam-treated cylinder just before the 90 days of ponding began and 1 day after it concluded. This specimen is representative of all 12 tests that were completed because minor corrosion of steel fibers on and very close to the surface occurred. This corrosion would probably more aptly be described as surface staining caused by exposed fibers. There was no indication that the corrosion of the fibers was progressing into the interior of the UHPC. Figure 113. Photos. (a) Cylinder before and (b) after 90 days of chloride ponding. 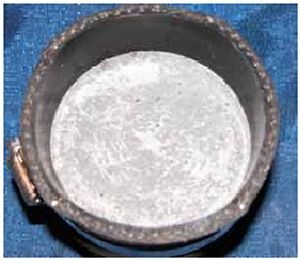
(a)
(b)
3.13.3 Scaling ResistanceThe UHPC scaling resistance to deicing chemicals was evaluated through the use of the ASTM C672 standard test method.(60) In this test method, a solution of calcium chloride is ponded on the surface of the concrete. The concrete specimen is then placed in a -18 °C (-0.4 °F) freezing environment for 18 hours followed by a 23 °C (73.4 °F) thawing environment for 6 hours. This cycle is repeated daily, while ensuring periodically that the surface of the specimen remains covered in the ponding solution. The ASTM C672 testing included two slabs from each curing regime. Each slab was cast in a 356-mm by 356-mm (14-inch by 14-inch) square steel mold that was 76 mm (3 inches) deep. The cast surface on the bottom of the slab became the surface to be ponded after demolding. The curing treatments were applied to the slabs, and then the dams were epoxied to the ponding surface. The dams were composed of steam-treated UHPC. A rapid-setting, two-part epoxy was used as the bonding agent slab and the dam. Figure 114 shows one of the slabs before testing was initiated. The total exposed ponding area on the surface of each slab was approximately 0.065 m2 (100 inches2). The testing of these slabs commenced in two phases. In the first phase, a walk-in freezer was used to generate the freezing condition, while the standard laboratory environment generated the thawing environment. The capabilities of this freezer were such that a consistent temperature could not be maintained. Over the course of 4 months, 70 cycles were completed. Up through cycle 50, the temperature in the freezer was usually below -9 °C (15.8 °F). For the next 20 cycles, the temperature was usually in between -8 and -3 °C (17.6 and 26.6 °F). Due to the inability of this freezer to maintain a sufficiently cold temperature, this phase of the testing was halted. At the cessation of these tests, no scaling was observed on the surface of any of the slabs. Figure 114. Photo. Scaling slab before initiating ASTM C672 testing. 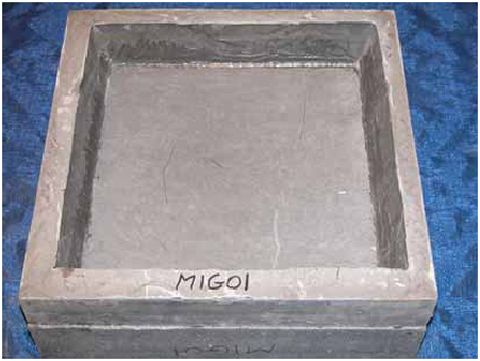
The second phase of the ASTM C672 testing used an environmental chamber to carefully control the freezing and thawing portions of each cycle to within ±1.67 °C (±3 °F) of the prescribed values. A total of 145 additional cycles were completed on all eight slabs. Every few cycles, the slabs were checked for leaking of the dams and for the proper solution level on the ponded surface. The slabs were also drained, flushed, inspected, and refilled after cycles 20 and 50. No scaling was observed. After cycle 145, the slabs were drained through a #30 sieve to capture any small scaling particles that might have been present. Each slab produced less than 0.5 grams (0.02 ounces) of material, which included small bits of concrete, pieces of epoxy, and other small detritus that had made its way onto the slabs over the course of 95 cycles. A final inspection of the ponded surface indicated that no scaling had occurred, thus an ASTM C672 surface condition rating of 0 was warranted. No differences were observed between the slabs from any of the four curing regimes. The surfaces did tend to show a slightly rougher texture after testing, with many more of the small air bubbles visible just under the ponded surface. Figure 115 shows the same slab that was pictured in figure 114 after having undergone the 70-plus-145 cycles of scaling as described above. Figure 115. Photo. Scaling slab after ASTM C672 testing. 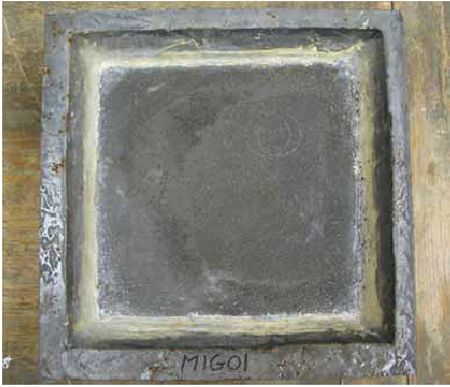
Figure 116 shows a byproduct of the ASTM C672 scaling tests. Some of the dams on top of the slabs did not seal properly with the slab surface. At the joint, the calcium chloride solution slowly leaked out and ran down the side of the slab. This leak allowed for an extremely aggressive environment on the vertical surfaces of these slabs. Even after the 70-plus-145 cycles of freezing and thawing in this environment, these vertical surfaces only showed minor surface deterioration of the type shown in the figure. The corrosion of the fibers did not seem to penetrate into the slabs, and no scaling, spalling, or chipping of the concrete surface was apparent. Figure 116. Photo. Surface deterioration of a vertical surface after 70-plus-145 cycles of wetting/drying with a chloride solution in a freezing/thawing environment. 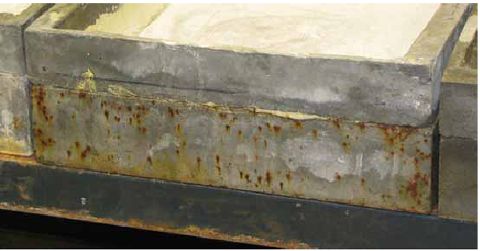 3.13.4 Abrasion ResistanceThe abrasion resistance of UHPC was measured through the standard test method described in ASTM C944.(15) This test determines abrasion resistance by measuring the amount of concrete abraded off a surface by a rotating cutter in a given time period. The cutter consists of a series of dressing wheels mounted on a rod that is attached to a drill press. Figure 117 shows a picture of the cutter head bearing on a specimen. The drill press is used to apply a constant force through the cutter into the specimen and to rotate the cutter at 200 revolutions per minute. The test procedure specifies that the force exerted by the cutter on the specimen surface should be 98 N (22 lb) unless the test is conducted on concrete that is particularly abrasion-resistant. Preliminary testing on UHPC indicated that doubling the load to 196 N (44 lb) as recommended by the standard would provide better results, thus this load level was used for the testing. Cylinders with a 152-mm (6-inch) diameter were cast for these tests. The specimens were cast following normal procedures except that steel molds were used, and the molds were only filled approximately 76 mm (3 inches) full. Three cylinders were cast for each curing regime. The abrasion resistance of a concrete surface will vary depending on the finish of its surface. For this reason, the ASTM C944 test was completed on the finishes of three different concrete surfaces for each of the four curing regimes. The surface finishes included a steel cast surface, a sandblasted surface, and a ground surface. In the test program, the 12 cylinders were all tested in the steel cast surface state. The cylinders were then sandblasted, after which they were tested again. Finally, the cylinders were ground and tested a third time. Figure 117. Photo. ASTM C944 abrasion test setup. 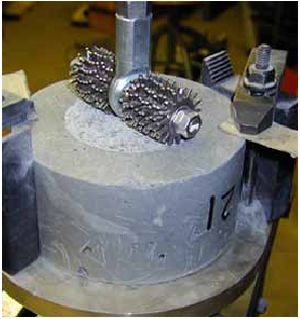
The ASTM test procedure indicates that the testing should include abrading the surface with the rotating cutter for 2 minutes. At the conclusion of the 2 minutes, the amount of concrete that has been abraded away is reported. In this test program, a modification was made to the test procedure in which the surface abrasion was repeated so that a total of between three and five abrasion sequences, with a duration of 2 minutes each, were applied to each specimen. The number of abrasion sequences varied depending on the abrasion depth capacity of the cutter and the resistance of the specimen. Figure 118 shows two of the steel cast surface specimens after abrasion testing. The untreated cylinder on the left underwent four abrasion sequences that lasted 2 minutes each. The steamtreated cylinder on the right underwent five abrasion sequences that also lasted 2 minutes each. The photo clearly shows that the steel cast surface of steam-treated UHPC is much more abrasion-resistant than the untreated UHPC. The rotating cutter had difficulty breaking into the surface on the steam-treated cylinder and tended to skid, with only slight abrasion occurring near the center of rotation. The results for the ASTM C944 abrasion testing are presented in figures 119 through 121. Throughout these figures, the results for each curing regime and surface condition set are the averages of the results for the three cylinders tested. Figure 119 presents the ASTM C944 abrasion weight loss as defined in the test specification. As detailed above, this result only includes the first 2 minutes of abrading for each specimen. The other two figures present the results from the entire sequence of tests completed on each specimen. Figure 120 presents the average amount of concrete per abrading over the sequence of abradings. Figure 121 presents the least-squares linear approximation of the weight loss per abrading. Figure 118. Photo. Steel cast surface untreated and steam-treated abrasion specimens after 8 and 10 minutes of abrading, respectively. 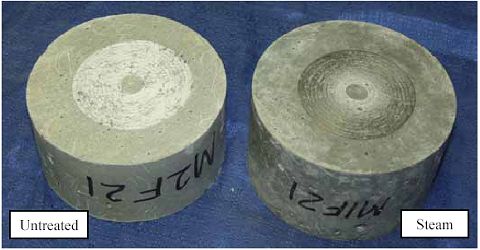 Figure 119. Chart. ASTM C944 weight loss (grams) per abrading. 
1 gram (g) = 0.035 ounces (oz)
Figure 120. Chart. Average weight loss (grams) per abrading.  1 gram (g) = 0.035 ounces (oz)
Figure 121. Chart. Linear best-fit weight loss (grams) per abrading. 
1 gram (g) = 0.035 ounces (oz)
These results show that a steam-based curing treatment of any kind has a significant impact on the abrasion resistance of UHPC. In general, the untreated cylinders lost approximately an order of magnitude more concrete per abrading than did any of the other cylinders. Quantitatively, the steam-based treated cylinders usually lost between 0.1 and 0.3 grams (0.0035 and 0.01 ounces) per abrading, while the untreated cylinders usually lost between 1 and 3 grams (0.035 and 0.1 ounce) per abrading. Also, as would be expected given its smoother texture, the steel cast surface performed the best compared with the sandblasted and ground surfaces. These results can be compared to the results from Horszczaruk(14) presented in section 2.4.4. The testing of 83- to 100-MPa (12- to 14.5-ksi) steel fiber-reinforced concretes produced results ranging from 0.14 grams to 0.25 grams (0.005 to 0.009 ounces) of mass loss per abrading for the more abrasion-resistant concretes. (These results are presented in a form comparable to the UHPC results presented in figure 121.) However, these results are based on ASTM C944 with the standard 98-N (22-lb) load, as opposed to the double load used in the present research program. The UHPC mass loss would have been significantly lower with the decreased abrasive normal force on the cutter head. Also, note that Horszczaruk’s research indicated that higherstrength concretes exhibited constant abrasion resistance, from test initiation until conclusion. This seems not to be the case with UHPC, which displayed increased abrasion resistance prior to the breaching of the smooth cast surface. 3.13.5 Freeze-Thaw ResistanceThe resistance of UHPC to freezing and thawing degradation was quantified through the use of the ASTM C666 (Procedure A) standard test method.(61) In this test, concrete prisms are subjected to freezing and thawing while submerged in a water bath. The aggressive environment created in this accelerated durability test helps to determine if the concrete has a microstructure that can resist the thermal expansion and contraction effects of water. The concrete could achieve this resistance by either resisting the initial water penetration or by allowing the thermal expansion of any penetrated water to occur within a voided microstructure. The specified lower and upper temperature value targets for the freezing and thawing environments are -18 °C and 4.4 °C (0 and 40 °F), respectively. The automated equipment used in this test program allowed for five cycles of freezing and thawing to be completed per day. In this test method, each prism is housed in a water-filled container that is only slightly larger than the prism itself. The containers are placed in an environmental chamber that freezes the prisms and their surrounding water layer using cold air, and then thaws the prisms using water. The 76- by 102- by 406-mm (3- by 4- by 16-inch) UHPC prisms produced for this test were cast following normal procedures. Three prisms were cast for each curing regime. After casting, any curing treatments were applied. The freeze/thaw testing began between 5 and 6 weeks after casting, following 2 days in which the prisms were submerged in 4.4 °C (39.92 °F) water to prepare them for the initial test measurement. In total, 690 cycles of freezing and thawing were conducted over the course of 9 months. During stoppages in testing, the prisms were stored in a frozen state in a walk-in freezer. In a few instances, however, machine malfunctions did allow the prisms to soak in room temperature water for up to a few days until the malfunction was corrected. Periodically, the freeze/thaw cycling was halted, and the prisms were measured. The data collection included mass determination and capture of the fundamental transverse frequency of each prism. Figure 122 is a photograph showing the setup used to determine the fundamental or resonant frequency. In this test, a transducer records the vibrations induced in a prism supported on two wires by an instrumented hammer. The capture and determination of this frequency response was completed according to ASTM C215. Figure 122. Photo. Resonant frequency testing of a freeze/thaw prism. 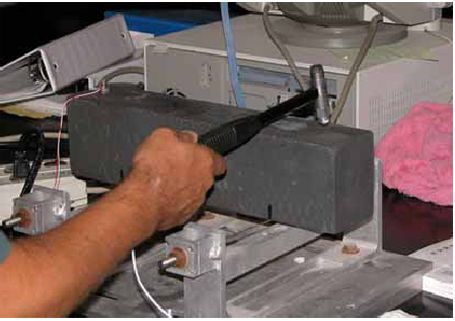
Figure 123 presents pictures of an untreated prism both before and near the end of testing. The second photograph shows that the prism experienced some deterioration of fibers that were exposed on the surface. Also, the surface of the prism tended to become slightly pitted as the cycling progressed. Overall, this pitting was very minor and was much more prevalent on the Untreated prisms than on any of the steam-treated regimes. Figure 123. Photos. Freeze-thaw prism (a) before testing and (b) after 564 cycles. 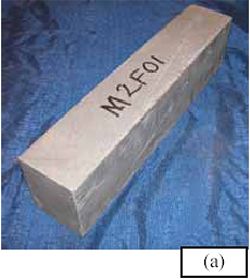 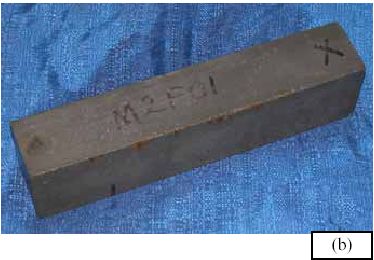
The resonant frequency results from this test program are presented in figure 124. These results are the average values from the three prisms that were tested for each curing regime. Note the clear difference between the initial resonant frequency results from each curing regime. All prisms in each regime resonated within 16 Hz of one another, indicating a tight band of results. Figure 124. Graph. Resonant frequency of freeze/thaw prisms. 
The relative dynamic modulus (RDM) is a value defined in the ASTM C666 test method as the percent difference in the squares of the frequency at any cycle compared with the initial frequency before freeze/thaw cycling. This calculation normalizes the results for ease of comparison to other tests. Figure 125 shows these results. In general, this test method assumes that freeze-thaw cycling will cause the RDM to decrease as the concrete deteriorates. This RDM decrease would occur due to the resonant frequency decreasing as the prism develops internal microcracking. The figure shows that the RDM changed very little in the tempered steam and delayed steam regimes, decreased slightly in the steam-treated regime, and increased significantly in the untreated regime. Overall, these results confirm that UHPC is very resistant to deterioration caused by freezing and thawing. However, it is premature to conclude that the untreated UHPC exhibits the best freeze-thaw resistance, because these RDM values are being influenced by other factors beyond those intended in the test. One indicator that an additional unintended behavior was occurring during the freeze-thaw cycling was the mass change exhibited by the prisms. Figure 126 presents the mass change results. All the regimes exhibited mass increase throughout the testing, with the untreated prisms averaging a 0.2 percent increase by 125 cycles. In a normal freeze-thaw test, a prism will lose mass as it deteriorates. As mentioned previously, these prisms showed very little deterioration throughout the test. However, it seems that instead of deteriorating during the cycling, these prisms were taking on water and possibly even hydrating. Figure 125. Graph. Relative dynamic modulus of elasticity of freeze/thaw prisms.  Figure 126. Graph. Mass change of prisms during freeze-thaw testing. 
Further experiments were conducted to investigate the increase in RDM in the untreated prisms. To determine if the prisms were taking on water and possibly hydrating, an additional batch of eight prisms were cast. This batch included two prisms that were treated according to each curing regime. After 28 days, initial freeze-thaw measurements were completed on the prisms, and then one prism from each curing regime was placed in a water bath. The other prism from each curing regime was maintained in a laboratory environment. The prisms were kept under these conditions for 250 days, during which mass and dynamic modulus of elasticity testing was periodically completed. The resonant frequency results from these eight prisms are presented in figure 127. The RDM results are presented in figure 128. The legend for each series indicates the curing regime and whether the prism was placed in air or water after day 28. These figures show that for the three steam-based treatment regimes, a steady increase in frequency occurred throughout the testing in the prisms maintained in the laboratory environment. The submerged prisms from these same regimes show a more rapid increase initially followed by the same type of steady increase. The untreated prisms show different behavior, with the submerged prisms exhibiting a rapid increase in frequency response during the first 10 days and both untreated prisms showing large overall increases in frequency response. The mass change of these prisms is also instructive, with the results provided in figure 129. The masses on all of the prisms increased throughout the testing, with the untreated prisms tending to show a larger increase than their counterparts in the three steam-based treatment regimes. One final experiment was conducted to determine if the prisms were hydrating as they were gaining water. A set of 76-mm (3-inch) diameter cylinders were cast along with the eight prisms previously discussed. These cylinders were divided into four groups, paralleling the conditions that the prisms in the untreated and steam treatment regimes underwent through day 56 after casting. An additional two sets of control cylinders were cast for testing in compression at 28 days. Table 31 presents the results of these tests. These compression results show that placing UHPC in a water bath can increase the compressive strength. As would be expected, the strength increase is greater in the untreated UHPC than in the steam-treated UHPC. This greater increase is likely partially due to the greater permeability of the untreated UHPC. Figure 127. Graph. Resonant frequency of prisms maintained at room temperature in a laboratory environment or in a water bath.  Figure 128. Graph. Relative dynamic modulus of elasticity of prisms maintained at room temperature in a laboratory environment or in a water bath.  Figure 129. Graph. Mass change of prisms maintained at room temperature in a laboratory environment or in a water bath. 
1 MPa = 145 psi These additional tests, which were completed following the initial freeze-thaw testing, have shown that the procedure followed for the freeze-thaw testing could lead to unintended water permeation and to additional hydration of the UHPC. This effect has been shown to be limited in the steam-based treatment curing regimes; however, it can be significant in the untreated regime. The added hydration creates the possibility of a 15 percent increase in the RDM if a prism spends 250 days in a water bath and a 10-percent increase in compressive strength if a cylinder is placed in a water bath from day 28 to 56. 3.13.6 Alkali-Silica ReactionAlkali-silica reaction (ASR) testing was performed in accordance with ASTM C1260.(62) This accelerated test method allows for the possible detection of the deleterious effects of ASR far more rapidly that could be achieved using the standard test method, ASTM C1293.(63) The ASTM C1260 test involves submerging mortar bars in an 80 °C (176 °F) sodium hydroxide solution for 2 weeks, while periodically measuring the length of the bar. These tests were extended to 4 weeks. Standard mortar bar molds were used to cast the specimens for this series of tests. Because this UHPC contains no coarse aggregate, no special preparation of the batch ingredients was necessary before casting the bars. Six mortar bars were cast for each curing condition. The mortar bars had a 25.4- by 25.4-mm (1- by 1-inch) cross section and were 280 mm (11 inches) long. The bars had gage studs cast into each end so that ASTM C490 length change measurements could be recorded throughout the testing.(49) Figure 130 shows one of the mortar bars in the length comparator for measurement. The standard test method includes specific instructions regarding timing throughout the test. These instructions include demolding the mortar bars at 24 hours, placing the bars in an 80 °C (176 °F) water bath for the following 24 hours, then placing the bars in the 80 °C (176 °F) sodium hydroxide solution bath until test completion. Due to the curing regimes being investigated in this research program, the timetable recommended in the standard test method could not be followed. Table 32 provides the timetable for each of the five sets of specimens that were tested. Submerging the UHPC in the 80 °C (176 °F) bath is somewhat similar to the steam-based curing regimes wherein the UHPC is placed in a high-heat, high-humidity environment. For this reason, it is anticipated that the test method described in ASTM C1260 may inadvertently provide additional curing to the UHPC, especially UHPC that did not undergo a steam-based curing treatment. Thus, two sets of specimens were tested in the untreated curing regime. In what is deemed the untreated (standard) set in table 32, the ASR testing was not initiated until 28 days after casting. In the untreated (modified) group, the ASR testing was initiated immediately after demolding. Figure 130. Photo. Length comparator for ASR measurements. 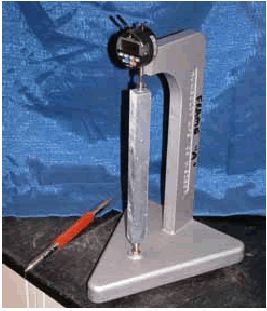
Table 33 presents the results from this series of tests. The standard test method indicates that expansion values less than 0.10 percent after 14 days of testing are indicative of innocuous behavior, whereas expansion values over 0.20 percent are potentially deleterious. The UHPC expansion results are an order of magnitude below this lower threshold after 14 days and even after 28 days of testing. Figure 131 presents the entire set of test results, including approximately 10 length readings for each curing regime throughout the 28 days of testing. These results indicate that there should be no concern of ASR problems with the concrete after a steam-based curing regime is applied. Given the procedures used in this test method to check for ASR susceptibility, Untreated UHPC may not be as resistant to ASR as determined in these tests. However, for ASR to occur in any concrete, free water must be present. Given the low permeability of UHPC, it seems unlikely that ASR would be an issue under any curing regime.
Figure 131. Graph. ASTM C1260 alkali-silica reactivity expansion results.  3.14 SPLIT–CYLINDER TENSION TESTING ON CRACKED CYLINDERSAny material that is affected by external environmental aggressors will necessarily be more affected by those aggressors if pathways into the interior of the material are present. The durability of uncracked UHPC has been well covered by the topics discussed in section 3.13. However, in some applications cracked UHPC could be subjected to aggressive environments. The cracks could allow for ingress of contaminants and for a more rapid deterioration of the UHPC than would be expected based on uncracked durability results. Recall the research presented in section 2.4.2 wherein Rapoport et al. indicated that the permeability of fiberreinforced normal concrete could be increased by cracking if the cracks were larger than 0.10 mm (0.004 inch).(10) To begin to access the durability of cracked UHPC, a series of tests were conducted to determine if the ponding of a sodium chloride solution on cracked UHPC would negatively impact the postcracking tensile strength. Although these tests are not standardized, they are a combination of the ASTM C496 split-cylinder tensile tests discussed in section 3.4.2 and the AASHTO T259 ponding tests discussed in section 3.13.2.(25,58) The split-cylinder tensile test portion of this program was conducted identically to the tests discussed earlier in the chapter, including the measurement of lateral deformation using a pair of LVDTs. The only difference was in the staging of the test wherein specimens were not necessarily loaded directly to failure (as discussed below). The ponding portion of these tests was identical to the AASHTO T259 tests described previously. This series of tests included 30 cylinders with a 102-mm (4-inch) diameter; half of the cylinders came from batch L1R and half came from L2R. Only the steam-treated and untreated cases were investigated. The casting and curing of the specimens followed standard procedures, and the testing discussed herein was initiated on day 28 after casting. The 15 cylinders from each batch were divided into 5 groups of 3. The first group of cylinders, the control group, was loaded to failure. The second group was loaded until cracking had occurred, then unloaded, then reloaded to failure. The third group was loaded identically to the second group, except that after unloading the cylinders were stored in a laboratory environment for 90 days. The fourth group was identical to the third group except that, during the 90-day storage, water was ponded on a cracked end of the cylinder. Finally, the fifth group was identical to the fourth group, except that a 3-percent sodium chloride solution was ponded on a cracked surface. The cracking of each cylinder was determined by monitoring the lateral deformation behavior. The two means of determining if a crack had occurred included a clear jump in the lateral deformation or a definite reduction in stiffness of the load versus lateral deformation response. Most cylinders exhibited a clear jump in their response, but a few untreated cylinders only exhibited the stiffness change. Cylinders from the second through the fifth groups were unloaded immediately after cracking was observed. The cracks on these specimens were then identified and measured using an optical microscope. First, alcohol was used as a volatile penetrant to highlight each crack. A crack that was made visible using this technique can be seen in figure 132. The cracks were then located using the microscope set at 350x magnification. In general, each end of each cylinder only had one crack. Once located, each crack was traced to find its largest width. The cracks were then photographed for later analysis of the crack widths. A photograph of a crack from one of the steam-treated cylinders is shown in figure 133. At this optical magnification and given the resolution of the digital photograph acquired, the crack shown in this figure is only 2 pixels wide, corresponding to a width of 0.0036 mm (0.00014 inch). Figure 132. Photo. Crack in a split cylinder tensile specimen. 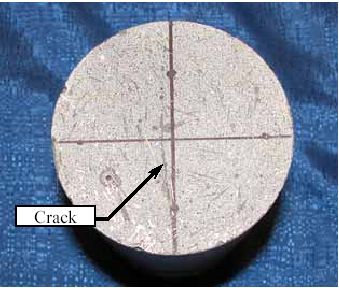 Figure 133. Photo. Crack in a split-cylinder tensile specimen under 350x magnification. 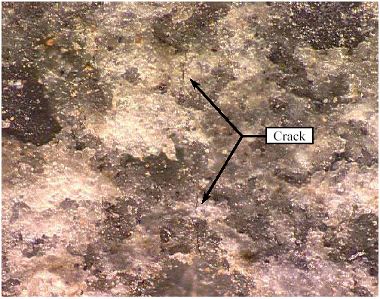
The crack widths on the ponded faces of the 12 ponded cylinders ranged from 0.0018 mm (0.00007 inch) to 0.012 mm (0.00047 inch). Ten of the 12 cylinders had crack widths between 0.0036 and 0.0069 mm (0.00014 and 0.00027 inch). Table 34 provides the crack width and splitcylinder peak strength results for the cylinders that were ponded.
1 MPa = 145 psi, 1 mm = 0.039 inch The results of these tests indicate that the ponding of neither the water nor the sodium chloride solution had little effect on the peak tensile load carried by the cylinders. Figure 134 provides the postcracking strength results for all five groups of cylinders for both curing regimes. The peak load carried shows no clear change, and it is clear that the ponding of the water or the sodium chloride did not have a serious detrimental effect on the fibers crossing the crack in each cylinder. However, it must also be noted that the sodium chloride solution did cause corrosion of fibers exposed on the ground end of the cylinder, similar to what was observed in the AASHTO T259 and ASTM C672 tests. Further research into the permeability of cracked UHPC is necessary to determine what crack size results in a change in the permeability characteristics of the material. Figure 134. Chart. Split-cylinder peak strength results. 
1 MPa = 145 psi
|
||||||||||||||||||||||||||||||||||||||||||||||||||||||||||||||||||||||||||||||||||||||||||||||||||||||||||||||||||||||||||||||||||||||||||||||||||||||||||||||||||||||||||||||||||||||||||||||||||||||||||||||||||||||||||||||||||||||||||||||||||||||||||||||||||||||||||||||||||||||||||||||||||||||||||||||||||||||||||||||||||||||||||||||||||||||||||||||||||||||||||||||||||||||||||||||||||||||||||||||||||||||||||||||||||||||||||||||||||||||||||||||||||||||||||||||||||||||||||||||||||||||||||||||||||||||||||||||||||||||||||||||||||||||||||||||||||||||||||||||||||||||||||||||||||||||||||||||||||||||||||||||||||||||||||||||||||||||||||||||||||||||||||||||||||||||||||||||||||||||||||||||||||||||||||||||||||||||||||||||||||||||||||||||||||||||||||||||||||||||||||