U.S. Department of Transportation
Federal Highway Administration
1200 New Jersey Avenue, SE
Washington, DC 20590
202-366-4000
Federal Highway Administration Research and Technology
Coordinating, Developing, and Delivering Highway Transportation Innovations
 |
| This report is an archived publication and may contain dated technical, contact, and link information |
|
Publication Number: FHWA-HRT-06-115
Date: August 2006 |
|||
Index, Structural Behavior of Ultra-High Performance Concrete Prestressed I-GirdersCHAPTER 5. UHPC GIRDER TEST RESULTSThis chapter presents detailed results from the four UHPC girder tests. The results from the flexure test on the 24.4-m (80-ft) AASHTO Type II girder are presented first, followed by the results from the three full-scale shear tests. 5.1 Static Flexural TestingAs discussed in chapter 4, Girder 80F was a 24.4-m (80-ft) AASHTO Type II prestressed girder. The girder was loaded in four-point bending by point loads located 0.91 m (3 ft) from the centerline and by roller supports located 12.0 m (39.25 ft) from the centerline. The girder contained twenty-six 12.7-mm, 1860-MPa (0.5-inch, 270-ksi), low-relaxation strands and no mild steel. Figure 9 shows the applied load versus the vertical deflection response for this girder. The deflection is measured from the girder's bottom flange at the midspan centerline. The load-deflection response shows that the girder began to soften between 310 and 355 kN (70 and 80 kips) at a deflection of approximately 75 mm (3 inches). The girder exhibited significant additional capacity, reaching a peak load of 790 kN (178 kips) at a deflection of 470 mm (18.5 inches). A similar response can be observed in figure 10, which shows the applied load versus rotation at the girder support. Figure 11 provides a plot of the deflected shape of the girder at seven load steps throughout the test. Note that the data points closest to the supports were derived from the support rotation values.
1 mm = 0.039 inch Figure 9. Graph. Load versus midspan deflection response of Girder 80F.
1 kN = 0.225 kip Figure 10. Graph. Load-rotation response of Girder 80F.
1 m = 3.3 feet Figure 11. Graph. Deflected shape of Girder 80F at selected load levels. The 16 strain gages located at the girder's centerline were used to create a strain profile over the depth of the girder throughout the test. Individual gages were used until their readings became unreliable due to cracking of the underlying concrete. The data from both sides of the girder correlated well. The neutral axis location and the curvature of the cross section could be computed from these results. Figure 12 shows the applied moment versus midspan curvature response. Similarly, figure 13 shows the neutral axis depth from the top of the girder versus the applied moment. Note that basic elastic section analysis indicates that the neutral axis at test initiation should have been located approximately 520 mm (20.5 inches) down from the top of the girder. This plot shows that the neutral axis began to rise at an applied moment of approximately 1,920 kN-m (17,000 kip-inches), which corresponds to a load of approximately 347 kN (78 kips). Also, note the stability of the neutral axis depth during the unloads/reloads. The strain rosette on the south face of the girder near the west bearing was used to capture the data presented in figures 14 and 15. The data shown in these plots are not continuous because difficulties with the data acquisition system resulted in the loss of 10 data points in the middle of the test. Figure 14 provides the principal tensile and compressive strains at the rosette. Figure 15 shows the angle of the principal strains in clockwise degrees from horizontal on the south face. In both figures, note the linearity of the results. The tensile principal strain angle was approximately 40° from vertical, and the strain increased elastically up to more than 75 microstrain. No shear cracking was observed in the girder.
1 kN-m = 8.85 kip-inches Figure 12. Graph. Moment-curvature response of Girder 80F.
1 mm = 0.039 inch Figure 13. Graph. Midspan neutral axis depth from the top of Girder 80F.
1 kN = 0.225 kip Figure 14. Graph. Principal strains in the web near the west support of Girder 80F.
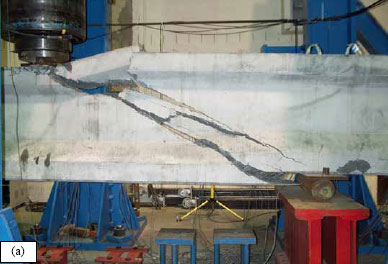
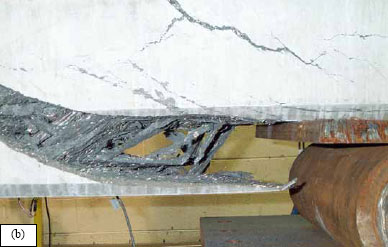
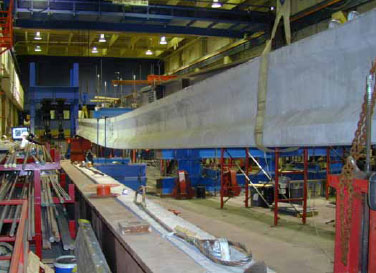
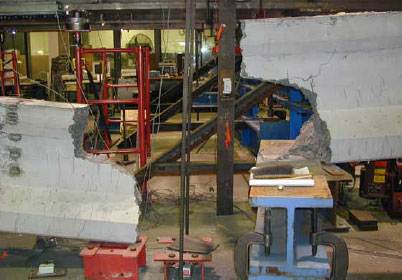
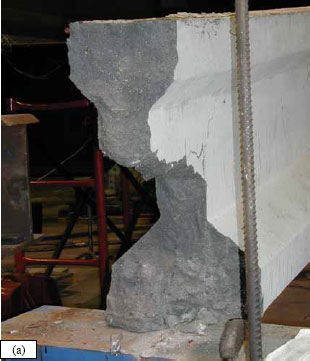
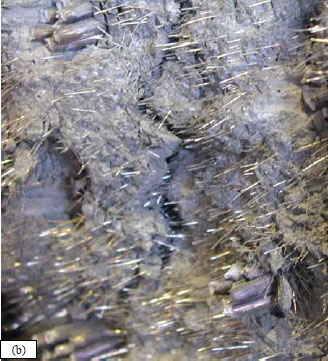
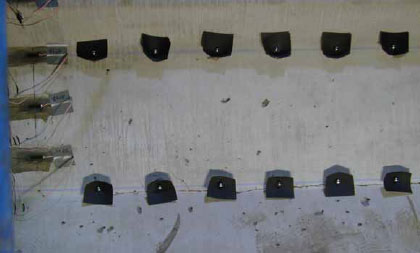
1 kN = 0.225 kip Figure 15. Graph. Principal strain angles in the web near the west support of Girder 80F. Significant audible cracking-which started when the load reached 325 kN (73 kips) and continued throughout the remainder of the test-emanated from the girder. However, in general, these cracking sounds could not individually be correlated to cracks on the surface of the girder. In fact, the cracks were not visible without the aid of a highly volatile crack-revealing spray until the load had reached approximately 710 kN (160 kips). After this load was reached, many tightly spaced hairline flexure cracks were visible in the bottom flange and web near midspan. The test was halted overnight just after a peak load of 623 kN (140 kips) was reached. The girder was locked in place with a deflection of 305 mm (12 inches). Before resuming the test, the cracks on the bottom flange were mapped using the volatile spray. Figure 16 shows photographic results of this mapping from six points along the length of the girder. The crack spacing near midspan was approximately 5 mm (0.2 inch). This spacing increased to 10 mm (0.4 inch) at 3 m (10 ft) from midspan, 25 mm (1.0 inch) at 4.9 m (16 ft), and 127 mm (5 inches) at 6.7 m (22 ft). No cracks were visible either to the unaided eye or through simple magnification devices. As previously mentioned, Girder 80F exhibited a significant deflection capacity before failure. Figure 17 shows the girder carrying a load of 780 kN (175 kips) with a resulting deflection of 430 mm (17 inches). Soon after this photograph was captured, the girder reached its maximum applied load of 790 kN (178 kips), which corresponds to an applied moment of 4,370 kN-m (38,700 kip-inches). The maximum combined dead and live load moment was 4,800 kN-m (42,500 kip-inches). For comparison, recall from section 2.4.4 that a similar ultimate flexural capacity was attained experimentally by Russell and Burns during the testing of a 1.17-m (46-inch) deep decked I-girder.(15) That girder had a 41-MPa (6-ksi), 1.83-m (72-inch) wide top flange, and was prestressed with twenty-eight 12.7-mm (0.5-inch) strands. After the maximum load was reached, the girder began to exhibit drastically decreased stiffness. The loading was stopped at this point. As the girder softened the load decreased, because the loading apparatus was hydraulically actuated. Approximately 1 minute before failure, a single gross crack was observed growing up from the bottom flange at the west load point. Unlike any other cracks in the girder, this crack was clearly visible to observers from a distance of 4.6 m (15 ft). Failure of the girder was dramatic, with the girder fracturing into two unconnected pieces. Failure occurred due to a combined tensile failure of the concrete matrix and the prestressing strands. At the failure location, the fibers pulled out and all the strands necked and ruptured. Figure 18 shows the north elevation after failure, and figure 19 shows the west failure surface.
1 m = 3.3 ft Figure 16. Photo. Crack spacing on the bottom flange of Girder 80F at 305 mm midspan overall girder deflection.
Figure 17. Photo. Girder 80F after approximately 430 mm (17 inches) of deflection.
Figure 18. Photo. Girder 80F immediately after failure.
Figure 19. Photo. Failure surface of Girder 80F including (a) overall west failure surface and (b) closeup of west failure surface showing pulled-out fibers and necked strands. 5.2 Static Shear TestingThe results from three shear tests of full-scale AASHTO Type II prestressed UHPC girders are presented in this section. 5.2.1 Girder 28SThe first shear test was completed on Girder 28S. The test specimen had an overall span of 8.54 m (28 ft) and a shear span of 1.98 m (6.5 ft) resulting in a shear span-to-depth ratio of 2.17. The east bearing on this girder was placed 1.22 m (4 ft) from the end of the girder to minimize the effect that the debonding of the strands would have on the test results. As shown in figure 3, Girder 28S was originally the west end of Girder 80F. Before the Girder 28S test, the girder was examined for damage that may have resulted from the Girder 80F test. Significant flexural cracking was observed toward the midspan of Girder 80F (i.e., the west end of Girder 28S). Additionally, a longitudinal hairline crack was observed along the base of the web that went from 0.3 m (1 ft) east of the east bearing to just west of the load point. This crack may have either occurred due to the failure of Girder 80F or during fabrication or shipping of the girder. The response of Girder 28S to the applied loading is shown in figures 20 through 22. Figure 20 shows the applied load versus the vertical deflection response at the seven instrumentation lines. Figure 21 focuses on the data from the tilt meters at the east and west bearings. Figure 22 shows a plot of the deflected shape of the girder at six load levels. Recall that the point load was applied 6.6 m (21.5 ft) from the west support. Note how the location of maximum deflection shifts east as the test progresses. This shift is a direct function of the softening of the east end of the girder as shear cracking progresses. The potentiometer readings nearest to the load point clearly indicate that the girder began to show softening behavior at a load of 1,110 kN (250 kips). The girder still had a significant reserve load capacity and reached a peak load of 2,220 kN (500 kips). At this peak load, the shear load carried by the east shear span was 1,710 kN (384 kips). For comparison, Tawfiq found that decked AASHTO Type II girders composed of 55 to 83 MPa (8 to 12 ksi) HPC and containing shear reinforcement carried approximately 1,200 kN (270 kips) of shear before failure.(11,12) Half of the prestressing strands extending from the east end of the girder were instrumented to measure strand slip. Figure 23 shows the strand slip behavior throughout the test. Only the instrumented debonded strands are shown because all of the fully bonded instrumented strands showed less than 0.0508 mm (0.002 inch) of slip throughout the test. Results from the four strain rosettes are presented in figures 24 through 27. The tensile principal strain and strain angle values are presented in the first two figures. The compressive principal strain and strain angle are presented in the second two figures. Note that the strain angles are measured in clockwise degrees from horizontal as viewed from the south face of the girder.
1 kN = 0.225 kip Figure 20. Graph. Load-deflection response of Girder 28S.
1 kN = 0.225 kip Figure 21. Graph. Bearing rotation response of Girder 28S.
1 mm = 0.039 inch Figure 22. Graph. Deflected shape of Girder 28S.
1 kN = 0.225 kip Figure 23. Graph. Strand slip in Girder 28S.
1 kN = 0.225 kip Figure 24. Graph. Principal tensile strain in the web of Girder 28S.
1 kN = 0.225 kip Figure 25. Graph. Principal tensile strain angle in the web of Girder 28S.
1 kN = 0.225 kip Figure 26. Graph. Principal compressive strain in the web of Girder 28S.
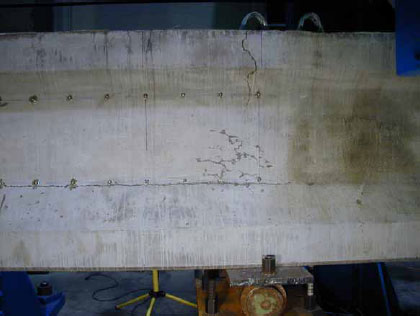
1 kN = 0.225 kip Figure 27. Graph. Principal compressive strain angle in the web of Girder 28S. Cracking and other damage to the girder were observed both audibly and visually throughout the test. The first cracking was heard at a load of 1,245 kN (280 kips). The cracking continued throughout the remainder of the test and seemed to primarily emanate from the eastern half of the girder. Throughout the test, the preexisting hairline crack at the base of the web continued to grow larger and longer. At a load of 1,560 kN (350 kips), this crack was clearly visible from 4.6 m (15 ft). Figure 28 shows the size of this crack at a load of 2,000 kN (450 kips). This crack, along with its branch that rose toward the load point beginning around 2,000 kN (450 kips), was the only gross cracking observed before girder failure. However, many other smaller cracks were present. These cracks were initially visible only through the use of an indicating spray but later were visible by short-range unaided viewing.
Figure 28. Photo. Crack at south base of Girder 28S web at a load of 2,000 kN (450 kips). Figure 29 shows the south face of the east shear span near the east bearing just after girder failure. Note the longitudinal crack at the base of the web, the vertical crack descending from the top of the top flange, and the crushed area in the web above the bearing. Figure 30 illustrates the damage recorded after girder failure. The failure of the girder was precipitated by a number of events. First, the longitudinal shear crack at the base of the web continued to grow longer and wider throughout the test. Near the completion of the test, the width of the crack was sufficient that only minimal tensile load transfer via fiber reinforcement across the crack would have been possible. Just after the peak load was reached, the base of the girder web just above the bearing began to crush. This slow process (lasting approximately 90 seconds) was finally halted by the rupturing of the two strands in the top flange. Note that the instrumented top flange strand did not show any slip throughout the test and that the rupture was 1.22 m (48 inches) from the end of the girder. The failure mode of this girder will be discussed in more depth in chapter 6.
Figure 29. Photo. Tension failure of top flange and crushing of web at conclusion of test.
1 m = 3.3 ft Figure 30. Illustration. Crack pattern at failure in Girder 28S. 5.2.2 Girder 24SThe second shear test was completed on Girder 24S. This girder had an overall span of 7.32 m (24 ft) and a shear span of 2.29 m (7.5 ft), resulting in a shear span-to-depth ratio of 2.5. The east bearing on this girder was centered 1.22 m (4 ft) from the end of the girder to minimize the effect that the debonding of the strands would have on the test results. As shown in figure 3, Girder 24S was originally the east end of Girder 80F. Similar to Girder 28S, this girder was examined for damage that may have resulted from the Girder 80F test. Significant flexural cracking was observed toward the west end of the girder; however, the majority of this cracking was outside of the test span. Additionally, a single crack was observed that started in the east overhang region at the bottom flange and ended in the web just west of the east bearing. This crack probably resulted from the motion of this end of the girder immediately following the failure of Girder 80F. Figure 31 shows the applied load versus the vertical deflection response of the girder. Individual curves are shown for each potentiometer, including Pot 4, which was located under the load point. Figure 32 shows the applied load versus the girder rotation at the east and west supports. Figure 33 shows the deflected shape of the girder at nine points throughout the test. Recall that the load was applied 5 m (16.5 ft) from the west bearing.
1 mm = 0.039 inch Figure 31. Graph. Load-deflection response of Girder 24S.
1 kN = 0.225 kip Figure 32. Graph. Bearing rotation of Girder 24S.
1 m = 3.3 ft Figure 33. Graph. Deflected shape of Girder 24S. The deflection measurements nearest to the load point indicate that the girder began to show softening behavior at a load between 1,330 and 1,780 kN (300 and 400 kips). The girder still had a significant reserve load capacity and reached a peak load of 3,250 kN (731 kips). At this peak load, the shear load carried by the east shear span was 2,230 kN (502 kips). Again, this capacity is significantly above the decked AASHTO Type II shear capacity determined by Tawfiq for HPC.(11,12) Half of the prestressing strands extending from the east end of the girder were instrumented to measure strand slip. None of the strands showed any slippage until after the girder failed. For this reason, the strand slip results are not plotted here. Results from the seven strain rosettes are presented in figures 34 through 37. The tensile principal strain and strain angle are presented in the first two figures. The compressive principal strain and strain angle values are presented in the second two figures. Note that the strain angle values are measured in clockwise degrees from horizontal as viewed from the south face of the girder. Also, in these figures tension and compression are not always strictly correct. For instance, at certain load levels, Rosette 4 in figure 34 exhibits a principal tensile strain that is actually compressive. A subsequent comparison with figure 37 shows that the compressive principal strain for Rosette 4 is compressive and is far larger. In this case, both principal strains were compressive; therefore, the less compressive strain is presented as tensile. Cracking and other damage to the girder throughout the test were observed both audibly and visually. The first cracking was heard at a load of 1,650 kN (370 kips). The cracking continued throughout the remainder of the test and seemed to primarily emanate from the eastern half of the girder. Up until just before failure, no gross cracking was observed in the girder. However, many small cracks were present. These cracks were only visible through the use of an indicating spray and were primarily shear cracks in the girder web. The failure of this girder was sudden and dramatic. Toward the conclusion of the test, two parallel shear cracks appeared in the girder web, each clearly visible from 4.6 m (15 ft) away. These cracks were approximately on the direct line from the bottom flange bearing plate to the top flange load plate. One of the cracks ran from the bottom to the top of the web while the other ran from the bottom to halfway up the web. Figure 38 shows photographs taken from a digital video of the failure. These two parallel shear cracks released in a brittle fashion, and the girder failed. As previously mentioned, none of the strands slipped until after the failure. The two top flange strands did break in three locations during the failure; however, this secondary failure was related to the large release of energy coming from the concrete tensile (shear) failure. Figure 39 shows the girder after failure. Figure 40 illustrates the crack and failure patterns recorded after the girder had failed.
1 kN = 0.225 kip Figure 34. Graph. Principal tensile strain in the web of Girder 24S.
1 kN = 0.225 kip Figure 35. Graph. Principal tensile strain angle in the web of Girder 24S.
1 kN = 0.225 kip Figure 36. Graph. Principal compressive strain in the web of Girder 24S.
1 kN = 0.225 kip Figure 37. Graph. Principal compressive strain angle in the web of Girder 24S.
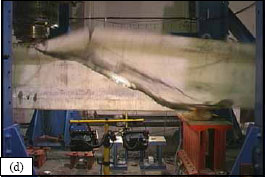
Figure 38. Photo. Failure of Girder 24S (a) 1/15 second before failure, (b) 1/30 second before failure, (c) at failure, and (d) 1/30 second after failure.
Figure 39. Photo. Failed Girder 24S (a) south elevation and (b) bottom flange near bearing.
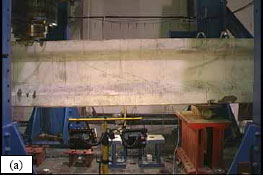
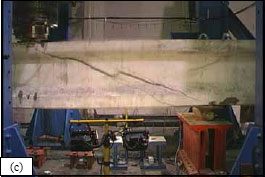
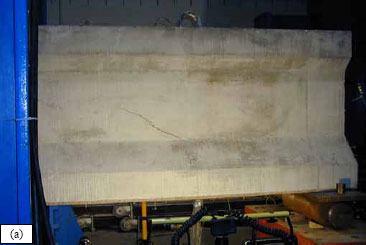
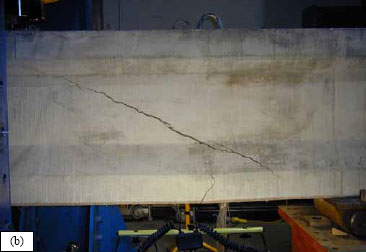
1 mm = 0.039 inch Figure 40. Illustration. Crack pattern at failure in Girder 24S. 5.2.3 Girder 14SThe third shear test was completed on Girder 14S. As shown in figure 3, this girder was one end of an untested 9.2-m (30-ft) girder. This specimen had an overall span of 4.27 m (14 ft) and a shear span of 1.83 m (6 ft), resulting in a shear span-to-depth ratio of 2.0. The east bearing on this girder was placed 152 mm (6 inches) from the end of the girder, similar to where it would be placed in practice. Note that half of the bottom flange strands are debonded to 0.91 m (36 inches) from the end of the girder. Figure 41 shows the applied load versus the vertical deflection response of the girder. Similarly, figure 42 shows the applied load versus the girder rotation at the east and west supports. Figure 43 shows the deflected shape of the girder at nine points throughout the test. Recall that the load was applied 2.44 m (8 ft) from the west support. The deflection measurements nearest to the load point indicate that the girder began to show softening behavior at a load of between 2,000 and 2,220 kN (450 and 500 kips). The girder still had a significant reserve load capacity and reached a peak load of 3,410 kN (766 kips). At this peak load, the shear load carried by the east shear span was 1,950 kN (438 kips). Half of the prestressing strands extending from the east end of the girder were instrumented to measure strand slip. Figure 44 shows the strand slip results throughout the test. The results for 11 of the 13 instrumented strands are shown. The LVDTs attached to the remaining two strands were not providing reliable results at the conclusion of the test; therefore, the results from these instruments were disregarded. Results from the six strain rosettes are presented in figures 45 through 48. The tensile principal strain and strain angle values are presented in the first two figures. The compressive principal strain and strain angle values are presented in the second two figures. Note that the strain angle values are measured in clockwise degrees from horizontal on the south face of the girder. Also, similar to the Girder 24S results, tension and compression are not always strictly correct with regard to the sign of the principal strains. Cracking and other damage to the girder throughout the test were observed both audibly and visually. The first cracking was heard at a load of 1,600 kN (360 kips). The cracking continued throughout the remainder of the test and seemed to primarily emanate from the eastern half of the girder. At a load of approximately 3,100 kN (700 kips), a larger crack became visible that could clearly be seen from 4.6 m (15 ft) away. This crack continued to grow longer and wider as the applied load was increased. Figure 49(a) shows the crack at the peak load carried by the girder. Subsequent to this point in the test, the girder continued to soften while the displacement increased and the load decreased. The crack continued to grow toward the bearing and load points until a secondary crack formed. Figure 49(b) shows the girder after the formation of the secondary crack in the bottom flange 0.91 m (36 inches) from the end of the girder. This is precisely the location to which half of the bottom flange strands were debonded.
1 mm = 0.039 inch Figure 41. Graph. Load-deflection response for Girder 14S.
1 kN = 0.225 kip Figure 42. Graph. Bearing rotation for Girder 14S.
1 m = 3.3 ft Figure 43. Graph. Deflected shape for Girder 14S.
1 kN = 0.225 kip Figure 44. Graph. Strand slip in Girder 14S.
1 kN = 0.225 kip Figure 45. Graph. Principal tensile strain in the web of Girder 14S.
1 kN = 0.225 kip Figure 46. Graph. Principal tensile strain angle in the web of Girder 14S.
1 kN = 0.225 kip Figure 47. Graph. Principal compressive strain in the web of Girder 14S.
1 kN = 0.225 kip Figure 48. Graph. Principal compressive strain angle in the web of Girder 14S.
Figure 49. Photo. Girder 14S at (a) peak load and (b) postpeak load of 2,650 kN (595 kips). Failure of the girder occurred when prestressing strands in the bottom flange began to rupture. The vertical crack in the bottom flange at the end of the debonding length continued to widen as, sequentially, the fully bonded strands broke. As more displacement was imparted into the girder, more strands ruptured until all 12 fully bonded bottom flange strands had ruptured. Figure 50 illustrates the crack and failure patterns that were recorded after girder failure.
1 mm = 0.039 inch Figure 50. Illustration. Crack pattern at failure in Girder 14S.
|


 s
s