|
ASTM C 1262 CLAUSES
|
COMMENTARY
|
|
1. Scope*
|
|
1.1 This test method covers the resistance to freezing and thawing of Segmental Retaining Wall (SRW) units. Units are tested in a test solution that is either water or 3 percent saline solution (3 percent salt by weight of solution) depending on the intended use of the units in actual service. |
|
1.2 This standard does not purport to address all of the safety concerns, if any, associated with its use. It is the responsibility of the user of this standard to establish appropriate safety and health practices and determine the applicability of regulatory limitations prior to use. |
|
2. Referenced Documents |
|
2.1 ASTM Standards:
C 140 Test Methods of Sampling and Testing Concrete Masonry Units and Related Units
C 215 Test Method for Fundamental Transverse, Longitudinal, and Torsional Resonant Frequencies of Concrete Specimens
C 1093 Practice for the Accreditation of Testing Agencies for Unit Masonry
C 1209 Terminology of Concrete Masonry Units and Related Units |
C 2.1—This revised version of ASTM C 1262 provides the option of conducting resonant frequency testing on SRW coupons to determine their relative dynamic modulus (RDM). |
3. Terminology |
|
3.1 Terminology defined in Terminology C 1209 shall apply for this test method. |
|
4. Significance and Use |
|
4.1 The procedure described in this test method is intended to determine the effects of freezing and thawing on SRW units in the presence of water or saline solution |
|
4.2 The procedure is not intended to provide a quantitative measure to determine an expected length of service for a specific type of concrete unit.
NOTE 2—The testing laboratory performing this test method should be evaluated in accordance with Practice C 1093.
NOTE 3—Compressive strength and absorption tests should be performed on different but representative specimens. While compressive strength and absorption values by themselves have been shown by research to not be reliable indicators of durability, they have been shown to be good reference values for units manufactured from a given set of materials. |
|
5. Apparatus |
|
5.1 Freezing-and-Thawing Apparatus: |
|
5.1.1 In the event that a chamber or chambers are used to subject the specimens to the specified freezing or thawing cycles, or both, the chamber or chambers shall be capable of maintaining the air temperature at all specimen locations within the specified test ranges when measured at any given cycle . If the apparatus operates automatically, it must be able to provide reproducible cycles within the specified temperature requirements. |
(See commentary C 8.3.1 below) |
5.1.2 The apparatus includes a non-rigid plastic container for each test specimen and test specimen supports as illustrated in Fig. 1. The containers shall be of sufficient size to provide 1-3/16 ± 1/24 in. (30 ± 1 mm) test solution surrounding the specimen. Test specimen supports to hold the specimen above the container bottom shall be two 1/8 ± 1/24 in. (3 ± 1 mm) rods of a solid noncorrosive, nonabsorptive material (brass, plastic, etc.). Supports in the specimen longitudinal and transverse directions shall be provided (see Note 5). The container shall be flat enough that when the specimen coupon is set on the support rods the specimen shall not deviate from level by more than 1/16 in. (2 mm) from one end of the specimen to the opposite end.
NOTE 4—An example of a container that fulfills this requirement for a 4 in. x 8 in. (100 mm x 200 mm) coupon cut from 8 in. (200 mm) tall units is the Rubbermaid® "Servin' Saver Plus" 1.1 Gal / 4.0 L container.
NOTE 5—A recommended setup for longitudinal and transverse support of the specimen consists of an I-shaped support formed by attaching pieces of 1/8 ± 1/24 in. (3 ± 1 mm) rod to form the I. |
(See commentary C 7.1.4 below) |
5.2 Temperature-Measuring Equipment—Thermometers, resistance thermometers, or thermocouples, capable of measuring the temperature at various points within the test chamber to within 2°F (1°C) of the temperature measured by a sensor that has been calibrated to a standard reference temperature. |
|
5.3 Scales—Scales for weighing full-size specimens shall have a capacity of at least 50 percent greater than th weight of the largest specimen tested and shall be accurate to at least 1 g (0.002 lb). Scales for weighing the filter paper and specimen residue (spall), as required in 8.2.3, shall be accurate to at least 0.2 g (0.0005 lb). |
|
5.4 Dynamic Testing Apparatus shall conform to the requirements of Test Method C 215. |
|
FIG. 1 Test Specimen in Freezing-and-Thawing Container
|
6. Sampling |
|
6.1 Selection of Test Specimens—Select whole units representative of the lot from which they are selected. The units shall be free from visible cracks or structural defects and shall not have been previously exposed to below-freezing temperatures. |
|
6.2 Number of Specimens—From the whole units selected in 6.1, randomly Select five units for freezing and thawing tests. If compression and absorption tests are to be performed on the same set of units in accordance with Test Methods C 140, select additional units as required. Specimens (coupons) used for Test Methods C 140 tests shall not be used as specimens for freezing-and-thawing tests. |
C 6.2—Variability in properties and freeze-thaw performance among SRW units within a "lot," as defined in 6.1, needs to be further investigated. If the lot consists of 1 day's production, then units shall be sampled at various different times in the day and tested. If the lot consists of several days' production, then units shall be sampled on a daily basis for testing. Knowledge of between-unit variability will enable developing more specific requirements in 6.1 and 6.2. For example, a sampling frequency of "1 unit per X units" or "1 unit per Y hours production" can be specified depending on the observed level of variability. |
6.3 Identification—Mark each freezing-and-thawing specimen so that it is identifiable at any time. |
|
7. Preparation of Test Specimens |
|
7.1 Freezing-and-Thawing Test Specimens—Test specimens shall consist of solid coupons saw-cut from full sized units. Do not saw-cut test specimens from units that have been previously oven-dried. Do not subject test specimens to oven-drying prior to completion of freezing-and-thawing testing. |
|
7.1.1 One coupon shall be cut from each of the five sampled units. Using a water-cooled saw, cut the coupon from a flat molded surface, on the surface of the unit that is opposite to the split surface as illustrated in Fig. 2. Cut the coupons at least 1 in. (25 mm) away from the corners of the unit and in such manner that the coupon is centered at mid-height of the unit (Fig. 2). Immediately following saw-cutting, thoroughly
remove loose particles and residue from the coupon by rinsing in tap water and brushing with a soft bristle brush until the coupon surfaces are clean (saw-cut aggregates clearly visible). Do not fully immerse coupons in water.
|
C 7.1.1—Sampling from the back face has two advantages: it avoids sampling near the split face where cracks and delaminations have been frequently observed, and it ensures consistency in properties (there is evidence that properties over an SRW unit vary from split to back face). Sampling from the back face has the disadvantage that it is not the exposed surface of the unit, the one of interest. Moreover, there is data to prove that properties of specimens sampled from the back face have lower water absorption and higher flexural strength than those sampled from the split face. One approach that can be taken is to tighten freeze-thaw specifications for specimens sampled from the back face, recognizing that these specimens are of likely higher quality than those sampled from the split face. |
7.1.2 Place the coupons on edge on a 3/8 in. (10 mm) or coarser mesh such that there is an air space of not less than 1 in. (25 mm) between coupons. Allow the coupons to dry for not less than 48 h in laboratory air at a temperature of 75 ± 15°F (24 ± 8°C) and a relative humidity of 45 to 55 percent . |
C 7.1.2—The 45 to 55 percent relative humidity is adapted from ASTM C 672 which also requires a drying period for specimens prior to start of freeze-thaw testing. |
7.1.3 The thickness of each coupon shall be 1-1/4 in. (32 mm) ± 1/16 in. (2 mm), unless the unit does not permit this minimum thickness, in which case the thickness shall be the maximum thickness that can be obtained from the unit. The thickness of the coupon shall not be less than 3/4 in. (19 mm). |
C 7.1.3—It is not clear at this time whether variations in coupon thickness affect test results. Thickness variations do, however, affect total mass of specimen (for specimens with the same face test area), and as concluded in the NCMA study, variations in specimen mass relative to solution mass affect mass loss measurements. The issue of specimen thickness must be evaluated and consideration should be made as to whether or not a constant thickness should be specified. |
FIG. 2 Extraction of Test Coupon from SRW Unit (figure not to scale)
FIG. 2 for C 7.1.1 Alternate Extraction Method of Test Coupons from SRW Unit (figure not to scale)
|
7.1.4 The area of the submerged bottom surface of the test specimen shall be, between 31 in2 (200 cm2) and 33 in2 (210 cm2) unless the unit does not permit a coupon meeting the minimum area, in which case the test specimen shall consist of two coupons. The combined area of the two coupons shall be between 31 in2 (200 cm2) and 33 in2 (210 cm2) . These two coupons shall be tested as and considered to be a single specimen.
NOTE 6—For combinations of specified container (5.1.2) and coupon sizes (7.1.4), approximately 300 g of test solution is required to obtain a depth of 1/2 ± 1/16 in. (13 ± 2 mm) (8.3.1). |
C 7.1.4—It is understood that the current allowable range of container and coupon sizes is intended to provide flexibility to different laboratories testing a variety of different manufactured products including concrete masonry units, segmental retaining wall units, concrete pavers, and roof pavers. It can be demonstrated that for the current tolerances, specifically in the amount of surrounding solution, the energy required to cool a coupon surrounded by 1 1/2 inches (3.8 cm) of water is up to 5 times larger than the energy required to cool a similar size coupon surrounded by 1/8 inch (0.32 cm) of water. In addition, the combination of permissible container and coupon sizes can result in ratios of mass of surrounding water (or solution) to mass of specimen (i.e,. mwater/mspecimen) as high as 0.40 for a 35 inch2 (226 cm2) coupon surrounded by 1-1/2 inches (3.8 cm) of water to as low as 0.06 for a 25 inch2 (161 cm2) coupon surrounded by 1/8 inch (0.32 cm) of water. In the studies conducted at Cornell for NCMA, mass loss approximately doubled in going from msolution/mspecimen
of 0.15 to 0.30.
Based on these data, the range msolution/mspecimen has been narrowed by specifying coupon size as well as the clearance between specimen and container. Thus, 4 inch by 8 inch (10 cm by 20 cm) (coupons are tested in containers of about 6.4 inches by 10.4 inches in size (16 cm by 26 cm) (Rubbermaid® "Servin' Saver Plus" 1.1 Gal / 4.0 L). Coupons cut from 6-inch (15 cm-)tall units are then required to be 5-1/3 inches by 6 inches (14 cm by 15 cm) and be tested in containers of about 7.7 inches by 8.4 inches (20 cm by 21 cm) in size. Coupons cut from 4-inch-(10-cm-)tall units are then 4 inches by 8 inches (10 cm by 20 cm) provided there is sufficient space in the SRW unit or two 4 inch by 4 inch (10 cm by 10 cm) coupons tested as one coupon. These coupons (4 inch(10 cm)) are tested in the same containers as those used for coupons cut from 8-inch (20-cm-)tall units.
One likely problem is the long-term availability of said containers in the market. For test results to be repeatable and comparable, test containers (material and dimensions) must be standardized. Another option is to specify custom-made containers with exacting dimensions meeting the above specifications. |
8. Procedure |
|
8.1 Survey of Freezing-and-Thawing Test Chamber: |
|
8.1.1 The chamber shall be surveyed for its internal temperature distribution prior to actual freeze-thaw testing of specimens. This survey shall be performed according to the procedures outlined in the Annex. The survey shall be performed on a chamber loaded with the same number and type of containers, coupons, and solution in the same arrangement as will be used in actual freeze-thaw testing of specimens. |
|
8.1.2 Determine Freezer Reliability Curves from the survey (see Annex). If Reliabilities
less than 95 percent are measured, remove 10 percent of the containers from the chamber and repeat the survey. Continue this process until Reliabilities greater than 95 percent are consistently attained. The remaining amount of containers in the chamber shall then be the maximum amount of containers that may be used in actual freeze-thaw tests.
NOTE 7—Dummy coupons of the same mass as actual test coupons are acceptable for the survey. The test solution used during the survey shall be similar to that used for actual freeze-thaw testing. |
C 8.1.2—The current ASTM C 1262 requires that the freezer air T-t conditions be maintained "throughout the chamber." Although the meaning of "throughout" is not clear (i.e., "at all points in the freezer" or "at all specimen locations"), it may imply "everywhere" in the chamber (note: the word "throughout" is defined in Merriam-Webster's dictionary as "in or to every part; EVERYWHERE"). As such, complying with ASTM C 1262 (2003) may entail attaining R = 100 percent at all cycles. For the Tenney freezer with 28 specimens and the walk-in freezer with 20 specimens, R = 100 percent was consistently attained. However, as noted in section 4.4.5, somewhere between 20 and 40 specimens, R is no longer 100 percent for the walk-in freezer. Similarly, the chest freezer with six specimens exhibited R less than 100 percent. The issue of whether R needs to consistently be 100 percent at all cycles, or whether lower R values such as R = 95 percent are acceptable remains open. Note that when R = 0.95, the probability that any given specimen will experience 100 consecutive fully compliant cycles is about 60 percent. For other R values, this probability is:
R = 0.96 - 66 percent
R = 0.97 - 74 percent
R = 0.98 - 85 percent
R = 0.99 - 90 percent
|
8.1.3 During actual freeze-thaw testing, the length of Cooling Branch (see Annex) shall be such that Reliabilities greater than 95 percent are attained. The internal temperature distribution of the chamber shall be monitored during actual freeze-thaw testing to monitor the chamber performance and the reproducibility of cycles. If fluctuations in the performance of the chamber are detected, the length of Cooling Branch shall be adjusted accordingly to maintain Reliabilities greater than 95 percent.
NOTE 8—It is recommended that at least 5 cycles in every 25 freeze-thaw cycles be monitored. |
|
8.2 Specimen Conditioning: |
|
8.2.1 After preparation of the freezing-and-thawing test specimens in accordance with Section 7, place the specimen in the container such that the non-saw-cut surface of the specimen is in contact with the specimen supports. Add a sufficient amount of test solution at a temperature of 60 to 80°F (16 to 27°C) to the container to achieve a test solution depth of 1/2 ± 1/16 in. (13 ± 2 mm). Do not pour test solution directly onto the specimen. The test solution shall be either potable tap water or a 3 ± 0.1 percent (by weight) sodium chloride saline solution (0.03 lbs of salt to 0.97 lbs of water). Close container lids tightly and store containers on a level surface in laboratory air as defined in 7.1.2.
NOTE 9 —The submerged portion of the specimen is 3/8 in. (10 mm) of its thickness. There is 1/8 in. (3 mm) of test solution between the bottom of the container and the face of the specimen. |
C 8.2.1—The effect of partial immersion should be re-evaluated. Scherer and Valenza (2005) have conducted experiments in which concrete slabs are ponded with saline solution on one face. Swelling of the slabs is observed and this swelling increased with increasing salt concentration. Under freezing conditions, swelling is further enhanced. This may be related to the observation of transverse cracks in specimens. |
8.2.2 After 1 h ± 15 min, open the container and add test solution as necessary to maintain the water level required in 8.1.1. Reseal the container. After another 23 h ± 1 h, remove the specimen from the test solution and allow to drain for 1 min ± 15 sec. by placing it on a 3/8-in. (10-mm) or coarser sieve, removing visible surface test solution with a damp cloth. Immediately weigh the specimen to the nearest 1 g (0.002 lb) and record as Wp. Immediately test for fundamental frequency (optional). If fundamental frequency is measured, the total time period from removal of specimen from container to resonant frequency measurement shall not exceed 15 mins. nor should specimen surfaces become visibly dry before frequencies are measured.
NOTE 10 —The weight Wp as determined in 8.2.2 is not required to be reported at the conclusion of the test, nor is it used to calculate the reported weight loss of the specimen throughout the test. However, because the initial dry-weight of the specimen is not determined until the completion of freezing-and-thawing testing by adding the dry-weight of the collected residue to the dry-weight of the remains of the specimen (see 8.4.5 ), this Wp weight is needed as a reference weight to be used during the testing to estimate percentage weight loss and to predict relative performance between test specimens.
NOTE 11—Testing of fundamental frequency of SRW coupons requires close attention to test technique to avoid confusing frequencies for different modes of vibrations. Carefully aligning the location of impact and accelerometer (in the impact resonance method) as shown in Fig. 3a usually results in the transverse vibration mode being the dominant form of vibration for a specimen with 2:1 aspect ratio. To verify that the observed frequency peaks correspond to the transverse vibration mode, the location of impact and accelerometer may be offset as shown in Fig. 3b, in which case the torsional vibration mode becomes dominant. The frequency corresponding to this torsional may thus be distinguished from the transverse mode. |
|
FIG. 3 Possible vibration modes for SRW specimen
|
8.2.3 Return the specimens to the container and adjust test solution level as required in 8.2.1. |
|
8.2.4 Test solution added to the containers shall be at a temperature of 60 to 80°F (16 to 27°C). |
|
8.3 Cyclical Testing: |
|
8.3.1 Begin the test with a freezing cycle. Place the containers into the freezing test chamber such that each container is surrounded by a minimum air space of 1/2 in. (13 mm) on all sides. During testing the container shall be level within 1/16 in. (2 mm). The air temperature in the chamber shall be maintained within the limits shown in Fig. 4. During the freezing cycle, maintain the air temperature in the chamber at 0 ± 5°F (-18 ± 3°C) for a period of not less than 4.0 h and not more than 5.0 h (cold soak) . Hence, the time at which the warming ramp (shown by the dashed lines) starts may vary depending on the length of cold soak, as determined from the Chamber Survey (8.1). The rates of freezer air warming shall conform with the limits shown in Fig. 4.
NOTE 12—An example of a chamber that meets the temperature-time requirement in Fig. 4 is the Tenney Environmental (A Lunaire Company) chamber, Model No. T20S-2.0 shown in Fig. 5.
NOTE 13 —Temperature probes should be used to monitor the air temperature throughout the chamber. If warm units are placed into a freezing chamber, the air temperature within the chamber rises. The start of the freezing cycle time period begins only after the temperature of the air within the chamber is within the permissible range. Typically, constant temperature monitoring is not necessary, but it should be preformed through the first several cycles to ensure that the specimens remain in the freezing chamber for the appropriate length of time to comply with the cycle requirements. The same procedures should also be used to verify compliance with thawing cycle requirements in 8.2.6. |
C 8.3.1a—Spacing between specimens may influence the flow of air between specimens and affect cooling rates. It has been observed that cooling rates in the Tenney freezer increased slightly when the spacing between containers was increased and this is suspected to be caused by enhanced air flow between containers. Spacing between test containers may be more significant for a freezer such as the Tenney freezer in which air flow is essentially from top to bottom of freezer, and the passage of air from one shelf level to the next occurs in the space between containers and between containers and freezer wall.
C 8.3.1b—A complete freezer air T-t requirement (Fig. 4) is specified in this annotated version of C 1262 (2003). This is because findings from the FHWA and NCMA studies confirmed two important results:
- Meeting the current ASTM C 1262-05 freezer air T-t requirements does not lead to similar specimen cooling curves.
- Meeting the current ASTM C 1262-05 freezer air T-t requirements does not lead to similar specimen performance.
Thus, in addition to specifying cold and soak lengths and durations as is done in the current C 1262, the cooling and warming rates must also be specified.
The freezer air T-t envelopes shown in Fig. 4 are based on the data obtained at Cornell University for a freezer loaded with 28 specimens (also refer to section 8.3.3). It is recognized that variations in specimen load may produce freezer air curves outside the bounds from those shown in Fig. 4. The curves shown in Fig. 4 are intended for a testing laboratory wishing to reproduce the test conditions of the NCMA freezer at Cornell.
Furthermore, an open question is the issue of how the T-t envelopes in Fig. 4 reflect actual field exposure of SRWs. This is a topic that must be investigated further by comparing actual cooling rates and performance of SRW units in field and laboratory conditions and revising the freezer-air requirements in the test method accordingly.
Another issue is the total number of specimens in the freezer. Chapter 4 showed that different coupon and container sizes can lead to variations in the total specimen quantity in the freezer and how variations in total specimen quantity lead to fluctuations in freezer performance. If a standardized container is used, it is then possible for the test method to specify total specimen quantity in the freezer and maintain this total quantity fixed (see section 8.3.3). This means that anytime during the course of a test that a specimen is considered "failed" and removed from the population in the freezer, it should be replaced by a similar dummy specimen. This practice is in use in ASTM C 666 for ordinary concrete testing. |
FIG. 4 Chamber Air Temperature Limits
|
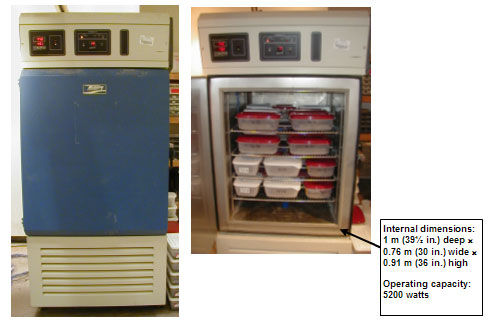
FIG. 5 Example of Freezing-and-Thawing Apparatus
|
8.3.2 Periodically, at the end of a thawing cycle, open the containers and visually inspect the specimens to determine if no ice remains. If ice is still present, extend the length of the thawing cycle to ensure that all ice has thawed.
NOTE 14—There is evidence that the length of thawing cycle may affect overall freezer performance. Freezers programmed for thawing cycles shorter than 6 h have been observed to lose cooling efficiency in subsequent cycles. It is therefore recommended that freezer performance be monitored during tests, as indicated in 8.1.3 and Note 8, and the lengths of Cooling and Warming Branches be adjusted accordingly if fluctuations in freezer performance are detected. |
|
8.3.3 The total number of specimens in the freezer shall be maintained at 28. Whenever a specimen is removed because of failure, replace it for the remainder of the test by a dummy specimen (see Note 7 for definition of dummy specimen). |
C 8.3.3—Note again that the 28 specimens specified in section 8.3.3 are intended to reflect the test conditions at Cornell in the NCMA study for which the freezer air envelopes in Fig. 4 were produced. Other specimen quantities are expected to alert the freezer air response and thus different specification envelopes are required. |
8.3.4 One freezing-and-thawing cycle is defined as a completed freezing cycle followed by a completed thawing cycle. |
|
8.3.5 At 20-cycle intervals for those specimens tested in water and at 10-cycle intervals for those specimens tested in saline solution, remove containers from the test chamber and collect residue in accordance with 8.4. Open containers to visually inspect the condition of the specimens and to adjust the test solution level to comply with 8.2.1.
NOTE 15 —There is some evidence that frequency of sampling influences results. Therefore, variations from cycle intervals for residue sampling are only appropriate when this method is used for research purposes rather than compliance purposes. Collecting and reporting residue at regular intervals provides information about the performance of the specimens throughout the duration of the test and also permits plotting results of weight loss relative to number of cycles of exposure. |
|
8.3.6 Every time a container is replaced into a multi-level freezing test chamber, the container shall be placed on the level immediately above the level on which it was previously located. If the container was previously located on the top level of a multi-level freezing chamber, replace it onto the bottom level. Containers in the front and back locations of the freezer shall be switched around, and containers in the left and right locations in the freezer shall also be switched around. |
|
8.3.7 If the test method is being used to document compliance of a set of specimens with specific freezing-and-thawing durability criteria, repeat the freezing-and-thawing cycle to reach the specified number of cycles. After the specified number of cycles have been completed, collect residue in accordance with 8.4.
|
|
8.4 Collection of Residue: |
|
8.4.1 Weigh to the nearest 0.2 g (0.0005 lb) and record as Wf a filter paper of high wet strength and smooth surface that has come to equilibrium temperature with the lab environment. Remove a single specimen from its container. Immediately rinse the specimen with water (if the specimen is tested in saline solution, use saline solution to rinse the specimen) using a squeeze bottle, being careful to collect in the specimen container the rinse water (or saline solution) and all loose particles from the specimen. Consider any pieces that separated from the specimen as part of the residue. Pour the test solution from the specimen container through the filter paper to collect the residue (spall) from the test specimen. Replace the specimen in the container. Using fingertips and a squeeze bottle, remove loose particles from all surfaces of the specimen, again being careful to collect all rinse water (or saline solution) and loose particles in the specimen container. The top surface of the specimen shall not be immersed in test solution at anytime and the collected rinse water (or saline solution) shall not exceed a depth of 1/2 in. (13 mm) in the container. Remove the specimen from the container, pour the rinse water (or saline solution) through the filter paper, and rinse the specimen container until all residue (spall) in the specimen container is collected on the filter paper. Rinse the residue from specimens tested in saline solution three times with water to remove any soluble salt.
NOTE 16 —The filtering may be expedited by using filter paper rated at a faster speed or vacuum filtration, or both. This is acceptable as long as the test solution that passes through the filter paper (filtrate) is clear to the naked eye. If it is cloudy, then filter papers of increasingly slower speeds should be used until the filtrate is clear. |
C 8.4.1—While the current ASTM C 1262 requires that the top surface of coupons not be immersed in water at any time, it has been consistently observed that moisture condenses and freezes on the underside of container lids. Upon thawing, this water drips back on the coupon surface where it either sits or gets absorbed into the coupon. The amount of such moisture falling back on the coupon appears to vary randomly from coupon to coupon. While the effects of variable moisture content on specimen performance is not certain at this time, the effect discussed under this commentary may be overcome as follows:
- If fully immersed specimens are specified in future ASTM C 1262 (2003) versions, this condensed moisture will no longer be an issue.
- By providing lids with an incline so the condensed moisture can run down to the side of the container rather than dripping on the coupon.
|
8.4.2 Use a damp cloth to remove moisture films from all specimen surfaces, immediately weigh the specimen to the nearest 1g (0.002 lb) and record as Ws (optional) and right away test for fundamental frequency (optional). If Ws and fundamental frequency are measured, the total time period from removal of specimen from container to resonant frequency measurement shall not exceed 15 mins and specimen surfaces shall not become visibly dry before frequencies are measured. |
C 8.4.2—Experiments conducted in the NCMA study demonstrated the influence of varying specimen moisture conditions (in this case due to drying) on resonant frequency. Resonant frequencies of specimens were found to not vary by more than 1 percent in the first 15 minutes from removal of specimen from container. |
8.4.3 If testing is to be continued, return the specimen to the container positioned on its supports. Check that the specimen container still meets the flatness requirement of 5.1.2. If it fails to meet the flatness requirement, use a different container. Add fresh test solution to the container in accordance with 8.2.1, and seal the container. |
|
8.4.4 Repeat the procedures described in 8.4.1, 8.4.2 and 8.4.3 with each remaining specimen. |
|
8.4.5 Dry all the filter paper and residue (spall) collected from each specimen at 212 to 239°F (100 to 115°C) for not less than 4 h and until two successive weighings at intervals of 2 h ± 15 min show an increment of loss not greater than 0.2 percent of the last previously determined weight. Place the filter paper and residue in a draft-free location within the laboratory for a period of 2 h ± 15 min to allow the filter paper and residue to come to equilibrium temperature with the laboratory environment. Weigh the filter paper and residue to the nearest 0.2 g (0.0005 lb) and record as Wf+r. Calculate the residue weight, Wr, as follows:
Wr = Wf+r + Wf (1)
where:
Wr = weight of residue (spall), g (lb),
Wf+r = weight of the dried residue and filter
paper, g (lb), and
Wf = initial weight of the filter paper, g (lb). |
|
8.4.6 At each residue collection interval (after n cycles), calculate the following parameters (optional):
Wrn = total accumulated residue weight from start of test to current cycle (2)
Wsn = Ws + Wrn (3)
where:
Wsn = total surface dried weight of
specimen at current cycle, g (lb),
Ws = surface dried weight of specimens at current cycle (8.4.2), g (lb), and
Wrn = accumulated residue weight from start of test to current cycle (Eq. 2), g (lb) |
|
8.4.7 At the completion of the freezing-and-thawing testing, dry each specimen at 212 to 239°F (100 to 115°C) for 24 ± 1 h. Weigh to the nearest 1 g (0.002 lb) the final oven-dried specimen and record as Wfinal. Calculate the initial weight of the specimen, Winitial, as follows:
Winitial = Wfinal + Wresidue (4)
where:
Winitial = calculated initial weight of the
specimen, g (lb),
Wfinal = final weight of the specimen, g (lb),
and
Wresidue = total accumulated residue weight (equal to the sum of the residue weight, Wr, from each evaluation period, g (lb). |
|
9. Calculation and Report |
|
9.1 Percent Weight Loss - Determine the cumulative weight loss of each residue collection interval expressed in terms of g (lb) and as a percent of the calculated initial weight of the specimen, Winitial, determined in accordance with 8.4.7. Where the coupon thickness is less than 1.25 in. (32 mm), the percentage and cumulative weight loss shall be multiplied by a value equal to the actual thickness in inches (mm) divided by 1.25 in. (32 mm). Report these values for each specimen as well as the average of the specimens tested. |
|
9.2 Moisture Parameters (optional) - Determine the moisture content of the specimens at each residue collection interval as follows:
MCn =  x 100 percent x 100 percent
(5)
where:
MCn = moisture content at each residue collection interval, percent,
Wsn = total surface dried weight of
specimen at each residue collection
interval (Eq. 3), g (lb), and
Winitial= calculated initial weight of the specimen, g (lb).
Determine the moisture gain of the specimens at each residue collection interval as follows:
MGn =  x 100 percent x 100 percent
(6)
where:
MGn = moisture gain at each residue
collection interval, percent,
Wsn = total surface dried weight of
specimen at each residue collection
interval (Eq. 3), g (lb),
Wp = initial pre-freeze surface dried
weight of specimen (8.2.2), g (lb), and
Winitial = calculated initial weight of the specimen, g (lb). |
C 9.2—The equations used to calculate moisture parameters are based on the following reasoning. At each residue collection interval (after n cycles), the surface-dried mass (Ws) of each specimen is measured (this is equivalent to measuring Wp
in section 8.2.2, i.e., Wp = Ws at 0 cycles). However, because of continued mass loss with increasing cycles, Ws represents the surface-dried mass of only the remaining portion of the specimen. Hence, to estimate the total surface-dried mass of the specimen, the cumulative residue mass up to n cycles needs to be added to Ws
(equation 3). This calculation is similar to equation 4 to determine the initial oven-dried mass of the specimen. The only difference here is that the surface-dried mass is obtained rather than the oven-dried mass. Once the total surface-dried mass Wsn of the specimen is obtained at n cycles, the moisture content is determined from equation 5 and the moisture gain from equation 6.
Findings from the NCMA study confirmed the existence of a critical moisture content above much specimen resonant frequencies dropped at an increasingly rapid rate. This observed behavior concurred with the theory of critical degree of saturation (SCR) proposed by Fagerlund (1975). Degree of saturation is defined as the ratio of actual moisture content to the total moisture content required to fill the open porosity in the material. This theory states that each particular material (with a certain combination of material properties such as strength and pore properties) possesses a unique value of SCR, and significant frost damage does not occur until the actual degree of saturation (SACT ) in the material exceeds SCR. For ordinary concretes, SCR is in the range of 0.75 to 0.90 (Fagerlund, 1977). For the SRW specimens tested in the NCMA study, SCR (calculated as the ratio of moisture content to ASTM C 642 (2002) boiled absorption) was in the range of 0.76 to 0.83. |
9.3 Relative Dynamic Modulus (RDM) of Elasticity (optional) - Calculate the value of RDM as follows:
RDMn= (fc/fo)2 x 100 percent (7)
where:
RDMn = relative dynamic modulus of elasticity after n cycles of freezing and thawing, percent
fn = fundamental frequency after n cycles of freezing and thawing
fo = fundamental frequency after 0 cycles of freezing and thawing |
|
|
9.4 The report shall also include the following information:
- Date and location of SRW unit sampling
- Age and storage condition of SRW units, if known
- Location of coupon extraction from units (provide sketch)
- Types of specimen damage during testing (cracking, scaling, aggregate popouts, etc)
- Percent weight loss at each residue collection interval, n
- Moisture content and percent moisture gain at each residue collection interval, n (optional)
NOTE 17 —If compressive strength and absorption test results (determined in accordance with Test Methods C 140) from representative specimens are available, it is recommended that these values be reported for reference purposes. |
|
10. Precision and Bias |
|
10.1 Precision and bias data for freezing-and-thawing durability is not available. |
|
11. Keywords |
|
11.1 absorption; compressive strength; freezing-and-thawing durability; manufactured concrete units |
|


