U.S. Department of Transportation
Federal Highway Administration
1200 New Jersey Avenue, SE
Washington, DC 20590
202-366-4000
Federal Highway Administration Research and Technology
Coordinating, Developing, and Delivering Highway Transportation Innovations
 |
| This report is an archived publication and may contain dated technical, contact, and link information |
|
Publication Number: FHWA-HRT-07-021
Date: April 2007 |
|||||||||||||||||||||||||
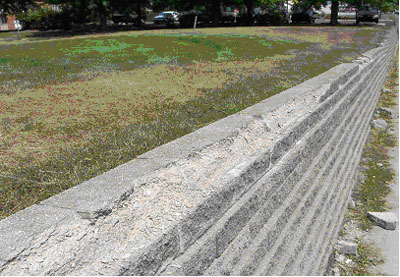
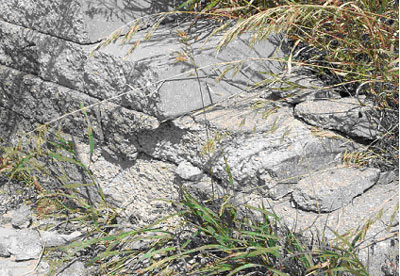
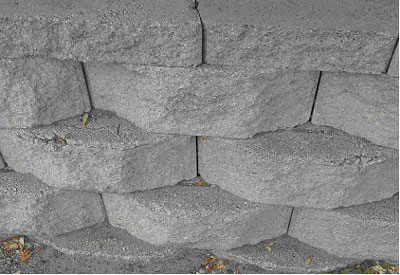
Durability of Segmental Retaining Wall Blocks: Final ReportCHAPTER 3: FIELD EVALUATION OF SRW BLOCKS3.1 INTRODUCTIONAs described in section 1.3, the discovery of various deteriorated SRW blocks (from freeze-thaw damage) in highway applications led to concerns within the SHA community, resulting in tighter specifications, and in some cases, restrictions on new SRW construction. These concerns also resulted in the initiation of the FHWA-funded research described in this report. As part of the current project, the research team discussed this durability issue with various SHAs and also visited SRW installations throughout North America to inspect for frost/salt damage. The overwhelming majority of SRWs visited during the course of this project are performing very well, even in cold climates. However, there are some SRWs that are performing very poorly in cold climates, and the observed deterioration can be quite severe. The observed damage, without exception, was found in SRW blocks that were exposed to deicing salts (or fertilizer runoff) and numerous freeze-thaw cycles. This chapter highlights the key findings from the most comprehensive field survey initiated under the project, which was conducted in cooperation with SHA engineers from Wisconsin and Minnesota in August 2003. The remainder of this chapter describes this field evaluation, provides a summary of the conditions of the SRWs that were inspected, and describes testing performed on SRW blocks procured from selected SRW installations. 3.2 FIELD EVALUATIONS OF SRWs IN WISCONSIN AND MINNESOTAOverall, seven different in service walls were examined in Wisconsin, and seven were examined in Minnesota. These walls were all located near Madison, WI or St. Paul, MN, and the walls to be viewed were selected based on feedback from members of the SHAs in Wisconsin and Minnesota. Walls were selected based on location, exposure conditions, and distress levels. Of the walls visited, five in Wisconsin and seven in Minnesota showed significant freeze-thaw damage. This is not an indicator of the condition of the walls in general for either State, as most of these walls were chosen because the presence of damage had been previously recognized. This does, however, give insight as to how damage is occurring and at what locations. The research team was able to locate and photograph existing walls and document their level of damage, as well as identify walls from which to obtain samples for future laboratory testing. The research team was also able to obtain feedback from DOT members regarding the state of existing walls and construction and repair methods currently being used. In addition, various other SRWs (e.g., county or city installations, commercial properties, etc.) were informally inspected during this field study, with the same general trend in behavior—that is, most of the SRWs are performing as expected, but a minority of the walls show the same type of distress as seen in highway applications for SRWs located where deicing salts or fertilizers are applied. 3.2.1 Types of Distress Observed in SRW blocksFor the blocks showing significant deterioration, the most common distress manifested itself in scaling of the exposed surface (front and/or top). Figure 12 shows a typical example of this deterioration, which tended to be most prevalent closest to the roadway or where exposed to direct/indirect runoff of deicing salts from above (e.g., from bridge or pavement at higher elevation). Distress was also typically most pronounced for cap units (i.e., top block on SRW), as illustrated in figures 12 and 13. Discussions on the key role that exposure to deicing salts plays in SRW block deterioration are presented next, along with further discussion on the unique nature and behavior of cap blocks.
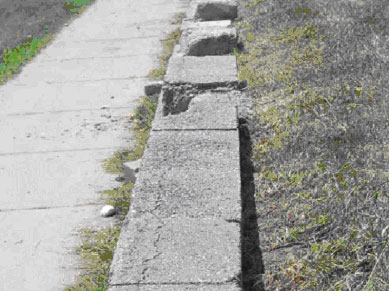
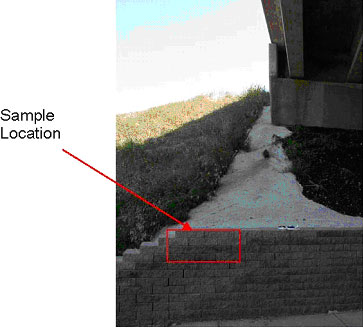
For a given SRW installation, the blocks with the most direct exposure to moisture, and especially salts, tended to exhibit the most distress. Walls located below, or at the edge of parking lots consistently showed the same pattern of heavily deteriorated blocks located directly in the path of drainage, while other blocks located not in the drainage path showed little or no freeze-thaw damage. The moisture draining over these particular walls would likely be very strong in salt content due to the application of salt on the parking lot being pushed to the edge of the lot and accumulating in snow piles that eventually will melt, creating saline solution draining over the wall. Blocks exposed to saline solution have shown consistently worse freeze-thaw durability when compared to those exposed to pure water in a laboratory setting, as discussed in chapter 4. Figure 14 shows that the damage at areas of water and salt runoff from a parking lot can be so severe that whole portions of the wall can lose their serviceability. Interestingly, portions of the wall not directly in the path of drainage showed little sign of freeze-thaw damage. Another example of microclimate or exposure-related distress can be seen in figure 15 in which a large multiwall SRW installation adjacent to a freeway exhibited excellent performance away from and above the roadway, but the blocks closest to the roadway (and hence salt spray) showed significant distress. This is an interesting case where the both wall sections (upper and lower) were constructed from the same SRW blocks, but only the lower wall section (lower portion of figure 15), which was about 2.5 m (8 ft) from the roadway, exhibited distress. There was heavy cracking in the cap block units of this wall and moderate damage to the body of the wall. One last example of the vivid effects of microclimate or exposure conditions can be seen in figure 16, in which a wall located beneath a bridge overpass shows very severe damage only in the section of wall that receives direct runoff from the overpass. Sections either sheltered from the elements by the overpass or located a "safe" distance from the direct runoff were in good shape.
The idea of salt spray action leading to further deterioration of the walls has been thought of as the main issue in freeze-thaw durability for some time. Although the exposure to saline solution from road salts being sprayed against the wall is a more severe exposure condition than pure water, the effects of salt spray were not as noticeable as other exposure conditions such as drainage, which can lead to a higher degree of saturation of the blocks. This is especially the case when the poor drainage allows saltwater (from deicing salts) to penetrate into the blocks. The reason salt spray may not be of as much concern as poor drainage could be due to walls salt sprayed not actually being exposed to as much moisture and salt as walls receiving exposure due to poor drainage. Although some salt will reach the wall through snow plowed adjacent to the wall, this snow could actually protect the wall from any additional road salt being sprayed onto the wall. There is also the possibility that the areas which are located in the spray zone are protected from going through as many freeze-thaw cycles as other sections of the wall because the areas in the spray zone are subjected to large piles of snow during freezing months. These piles of snow next to the wall may actually provide insulation for the wall, causing it to go through fewer freeze-thaw cycles than the portion of the wall where snow piles are not present. The role of salt spray and the exact amount of moisture and salt it imparts upon a given wall is still unclear. However, what is evident is that the presence of salt, whether from salt spray or runoff, is required for serious deterioration to occur. This observation also validates the need for laboratory-based testing using saline solutions. The examples in figures 12 through 16 clearly show that exposure to deicing salts (typically NaCl or lately magnesium chloride (MgCl2) for highways), coupled with freezing and thawing cycles, can lead to distress for certain SRW blocks. An interesting observation made during this field survey was that other chemicals, particularly fertilizers, can have a similar detrimental effect on SRW blocks. Walls exposed to drainage from areas such as golf courses also showed severe damage when compared to walls exposed only to water. The blocks that were directly exposed to the runoff of water containing large amounts of chemicals (phosphates or nitrates) from fertilizer were heavily distressed when compared to blocks on the same wall not exposed to fertilizer. As is the case with saltwater, water with significant amounts of these chemicals has proven to be highly detrimental to the freeze-thaw durability of SRW blocks when compared to those exposed only to water in a laboratory environment. Figure 17 shows a wall severely damaged due to exposure to runoff high in phosphates from an adjacent golf course. It is obvious that a large number of the blocks show complete deterioration, and adjacent blocks show severe cracking on the top face.
As stated previously, the most common form of distress observed in SRW blocks was the progressive and sometimes severe loss of mass, which was worst for cap units and when blocks suffered from poor drainage or direct exposure to salts. However, in a smaller number of cases, macrocracking was observed. For example, in the wall shown in figure 18, large cracks were located near the back, formed-face of the wall, perhaps indicating heavy internal damage, which leads to microcracking and finally large cracks that reach the surface of the block. Although this type of cracking was most evident in cap blocks, there were some cases where relatively large cracks appeared in noncap blocks, with this type of distress typically accompanying the more common scaling and significant mass loss shown in figures 12 through 16. This may indicate that, like conventional concrete, damage to SRW blocks due to freezing and thawing in the presence of deicing salts can lead to both surface scaling and internal damage caused by freezing water.
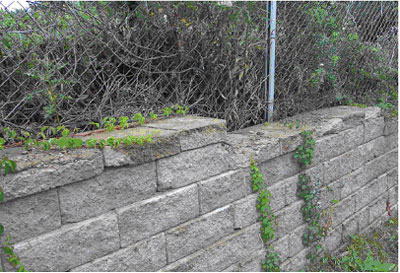
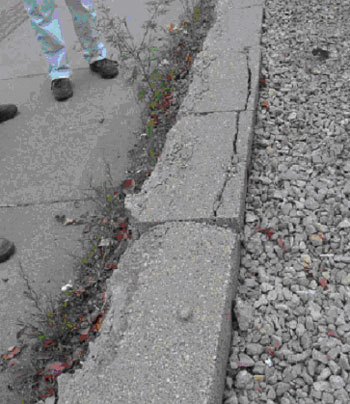
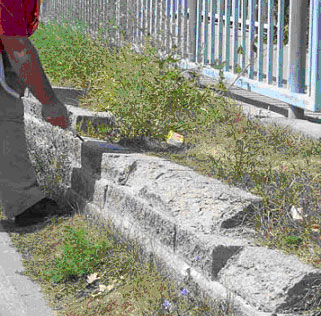
In reviewing the various types of distress in SRW blocks and the influencing parameters, it is evident that the cap blocks consistently displayed more freeze-thaw damage than the blocks from the body of the wall. It is not clear whether this is solely a result of the top course of blocks being exposed to much worse conditions or if the cap blocks themselves are that much more susceptible to freeze-thaw damage. It is likely that both of these factors play into the cap blocks receiving more damage, but more research on why cap blocks behave differently than the wall blocks is needed. Once the cap units are significantly damaged, it is much easier for the damage to progress below to the next row of blocks as there is now a direct path for water and saline solutions. Cap blocks are typically cast separately from the blocks used for the main body of the wall. Cap units may contain a different mix design than the wall blocks, have a different geometry, and receive different levels of compaction (mainly due to size and shape of block). Many of the cap blocks are rectangular and much shorter than the blocks used for the body of the wall. The cap units typically have less stringent freeze-thaw requirements when compared to the wall block, which is mainly a function of ease of replacement of damaged cap blocks when compared to wall blocks. Although cap blocks tend to show the most distress, freeze-thaw durability problems are not limited to these top blocks. There are cases where the main blocks also suffer from deterioration, especially when exposure conditions are severe. This is especially the case when walls are constructed at an angle (as opposed to vertical), with blocks staggered in a stair step fashion. This can lead to exposure to excessive moisture (and salts) due to ponding of water or snow and an increase in the ingress of water into the block. The added amount of moisture can cause blocks with exposed surfaces to have an area of weakness near the exposed horizontal surface and/or have overall worse freeze-thaw performance throughout the block. Although the presence of staggered blocks can lead to more frost damage for those blocks with inherent poor frost resistance, blocks that are durable with regard to frost resistance are generally not impacted by this block configuration. Figure 19 shows a wall that is staggered much like a set of stairs. On this particular wall, approximately 25 mm (0.98 inch) of the top face of each block was exposed, and this exposed area showed considerably more damage than the other sections of the block. The exposed horizontal section of the blocks exhibited major cracking and some signs of scaling. On many of the lips of the wall in Figure 19, the top layer (approximately 6–13 mm (0.24–051 inch)) had been degraded or could be physically removed using little force, due to horizontal cracks reaching the vertical surface of the block. The front, vertically aligned faces of the blocks on this wall did not show significant freeze-thaw damage, reaffirming the idea that the exposed horizontal surface can be harmful from a freeze-thaw durability standpoint for those blocks that are not inherently resistance to freezing and thawing damage.
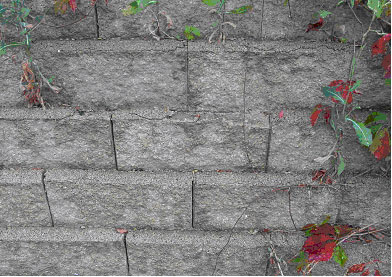
Other walls, like the one shown in figure 20, make use of block geometries that tend to result in part of the horizontal top surface being exposed. The exposed portion of the block, where water or snow would be allowed to accumulate shows much worse damage on the exposed surface compared to the front facing of the block. The wall in figure 20 had cracks on the top layer that reached the top surface and front face of the block, causing portions of the block to chip. Scaling was also present, mainly at the corner of the block where the exposed horizontal face meets the exposed vertical face of the block. This pattern of much worse damage on an exposed horizontal face can also be seen in cap units, as mentioned previously. It should be noted that the block geometry and wall design shown in figure 20 perform well in the vast majority of applications. It is only when using nondurable SRW blocks in particularly aggressive environments (exposure to salts) that the exposed horizontal surface can exacerbate distress.
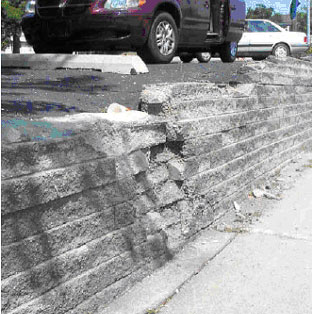
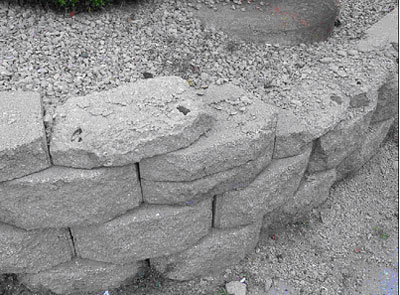
Inspecting inservice walls exhibiting freeze-thaw damage allowed the research team to look at a wide range of the factors involved in the issue. Although the performance of a wall is influenced primarily by the properties of the blocks (e.g., frost and salt resistance) being used, other issues can affect the freeze-thaw performance of walls. The exposure conditions, block geometry, and wall configuration can play key roles in the performance of SRWs, and these issues should not be overlooked when designing new SRW installations. These issues are beyond the scope of this project, which focuses exclusively on the inherent frost and salt scaling resistance of SRW blocks, but discussions were provided on the relevance of each of the above issues for completeness. In addition to visually inspecting the various SRWs in Wisconsin and Minnesota, the research team also procured SRW blocks from selected walls for subsequent evaluation in the laboratory, as described next. 3.2.2 Laboratory Evaluation of SRW Blocks Procured From Inservice WallsSRW blocks were obtained from three SRWs for laboratory evaluation. These walls were chosen for sampling because of ease of access to the walls and differing distress levels. Blocks were obtained and tested from one wall in Minnesota and two walls in Wisconsin, as shown in table 1. The Wisconsin samples obtained included two blocks from a wall (WI-2) where the distress levels within the wall varied between very poor and very good (figure 21). One of these blocks was exhibiting severe distress and was part of the original wall construction; the other was a block that had replaced a block that had deteriorated to the point that replacement was necessary. Another Wisconsin wall (WI-4, shown in figure 22), which was in quite poor overall conditions, was selected for sampling, and a block exhibiting severe distress from this wall was obtained for testing. One block exhibiting severe distress was taken from the Minnesota SRW, which could be classified as being in very poor condition as a whole (figure 23).
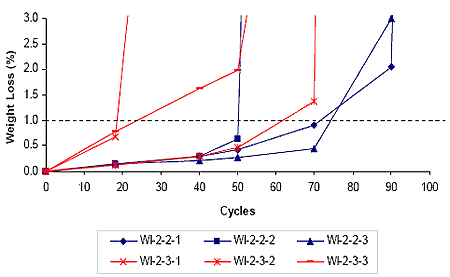
3.2.2.1 Test Methods for SRW Blocks Procured From Inservice WallsUpon receipt of the SRW blocks, they were saw-cut for freeze-thaw testing (ASTM C 1262, (2003) tested in water/and or 3 percent NaCl solution) microstructural analysis. Two of the samples were also profile grinded to determine the concentration of chlorides as a function of distance from the front block surface. For the ASTM C 1262 (2003) tests, after 24 hours of testing, additional water or saline solution was added to containers if the fluid level had dropped (due to absorption) below a depth of 12.7 mm (5 inches). Mass loss of specimens was recorded at regular intervals during the test (note that tests were conducted until either significant mass loss was measured (greater than 20 percent) or 100 cycles were reached. Much more detailed information on the specifics of ASTM C 1262 (2003) is provided in chapter 4. Microscopic air-void analysis was conducted on the SRW units described previously according to the procedures of ASTM C 457, "Standard Test Method for Microscopical Determination of Parameters of the Air-Void System in Hardened Concrete, Procedure B—Modified Point-Count Method" (2004). One of the challenges in conducting air-void analysis of SRW concrete was caused by the presence of the irregularly shaped and possibly interconnected compaction voids. As a first approximation, a compaction void is simply defined as a void in which less than three-fourths of its boundary is a paste-void interface, while an air void is defined as a void in which more than three-fourths of its boundary is a paste-void interface. As such, it is not necessary for a void to be completely surrounded by paste to be classified an air-void. This arbitrary definition was based on the fact that in ordinary concretes, certain air bubbles (entrapped or entrained) are not entirely surrounded by paste and may be partly bounded by an aggregate particle or by another air bubble. However, when using this definition in the examination of SRW units, any spherical shaped bubble completely surrounded by paste would be considered an air-void (as in the classical model for entrained air bubbles) and largely connected voids would be considered compaction voids. More discussion on SRW microstructure and air-void characteristics is provided in chapter 4. Chloride penetration analysis was conducted on field samples WI-4 and WI-5. A strip from the middle of the test unit spanning from the front face to the rear was examined and powder mortar samples were retrieved at various depths from the front face of the sample using a profile grinder. The mortar dust was collected using a vacuum pump and an aerosol filter system. The standard test method for measuring the total chloride content in mortar or concrete using the specific ion probe was used to identify the chloride thresholds at various depths from the face of the samples. This test method is based on a chloride test method developed by the Strategic Highway Research Program 1992 (SHRP-S/FR-92-110 1992). The specific ion electrode was calibrated using a set of predetermined concentrations of NaCl solutions prior to testing the SRW dust samples. Readings were taken for each calibration solution and a linear regression was performed. 3.2.2.2 Test Results for SRW Blocks Procured From Inservice WallsAll of the block samples obtained from in situ SRWs performed poorly in ASTM C 1262 (2003) when tested in 3 percent NaCl solution, with each sample exhibiting complete deterioration (e.g., 100 percent mass loss) before reaching 10 freeze-thaw cycles. This behavior is not surprising, given the generally poor field performance of the SRWs from which the blocks were taken. The durability of selected blocks tested under ASTM C 1262 (2003) using water (instead of saline) was also not good, as shown in figure 24. All of the WI-2 samples suffered at least 1 percent mass loss by about 75 cycles, and mass loss was severe soon after passing this typical threshold value for mass loss.
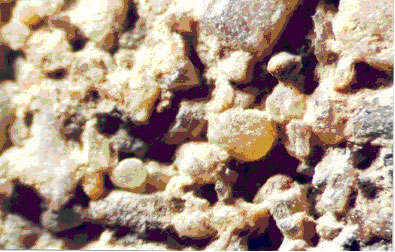
Microscopic analyses of all of the field units indicated internal characteristics similar to those of other nondurable blocks studied in detail in chapter 4. All the blocks displayed regions with large compaction voids and low paste contents, which contributed to the poor performance under ASTM C 1262 (2003) testing (in saline and for some, in water). Examples of the typical microstructure of these poorly performing SRW blocks is shown in figure 25.
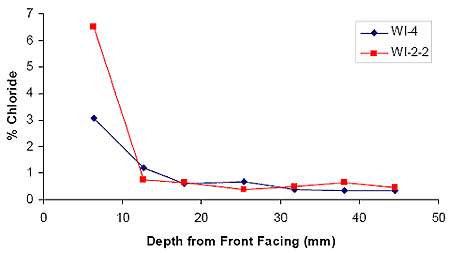
The results of chloride profiling on SRW blocks exhibiting distress in highway applications clearly show that chloride contents are extremely high (compared to conventional concrete), and based on the literature review (chapter 2) and laboratory program (chapter 4), it is not surprising that blocks with this type of microstructure performed poorly when exposed to freeze-thaw cycles. Typical results of chloride profiling are shown in figure 26, in which it can be seen that the chloride levels are extremely high, especially in the outer 10–15 mm (0.39–0.59 inch) of the blocks (that is, the first 10–15 mm (0.39–0.59 inch) from the front face of the blocks). Such high salt concentrations are expected to adversely affect block performance based on the various mechanisms described in chapter 2 (e.g., freezing point depression, increased osmotic pressure, salt crystallization, etc.).
1 mm = 0.039 inch Figure 26. Photo. Typical chloride concentrations for SRW blocks exhibiting poor field performance (data for WI-2 and WI-4, SRWs from Wisconsin). 3.3 SUMMARYThis chapter summarized some of the key findings from field evaluations of SRWs in Minnesota and Wisconsin. The overall findings are consistent with other visual observations from SRW installations in other cold weather regions—that is, most SRWs have performed very well, with very little sign of frost damage or salt distress. However, this chapter clearly shows that there are some cases where durability-related problems with SRWs are quite severe, confirming the need for research to address the problem. These field evaluations clearly show that exposure to both moisture (e.g., rain or snow) and salts is a prerequisite to damage, strongly suggesting that any attempt to assess durability in the laboratory should include saline solutions as part of the testing regime. Although the type and amount of distress observed in some SRW installations is quite troublesome, it is reassuring that SRW blocks can and are currently being produced that seem to be quite resistant to both freezing and thawing cycles and salt exposure. Thus, the challenge is identifying which types of SRW blocks will be most durable, based on accelerated laboratory testing, and being able to specify test methods that will discern good from poorly performing blocks. The laboratory program described in the next chapter focused on this challenge and provides guidance on how best to assure long-term durability of SRWs, even in severe environments.
|