U.S. Department of Transportation
Federal Highway Administration
1200 New Jersey Avenue, SE
Washington, DC 20590
202-366-4000
Federal Highway Administration Research and Technology
Coordinating, Developing, and Delivering Highway Transportation Innovations
 | Report |  |
| This report is an archived publication and may contain dated technical, contact, and link information |
|
| Publication Number: FHWA-HRT-11-027 Date: JANUARY 2011 |
Publication Number: FHWA-HRT-11-027 Date: JANUARY 2011 |
This chapter presents the performance of in-service GRS abutments, specifically, bridges built with GRS-IBS between 2005 and 2010. The performance of the first series of GRS-IBS indicates that the method has considerable potential to advance the state of the practice. Included in this chapter is a performance overview of several other bridges built with GRS abutments in the private and public sectors within the United States and Canada. The chapter also lists various case histories of many GRS walls built during the past 20 years to validate the long-term performance of these structures.
The elimination of the joint at the bridge ends helps improve the durability of both the beam ends and the bearings in conventional bridge systems. A distinctive feature in the design of GRS IBS is that it works with settlement instead of resisting it to create a compatible connection between the approach and the road, hopefully as a long-term solution to the bump at the end of the bridge. Reducing the bump at the end of bridge will improve the bridge's overall performance and serviceability. The bump not only creates a chronic maintenance issue but also induces an amplification of live load on the superstructure, creating fatigue on bridge elements.
The performance of nearly 20 bridges built with GRS-IBS has been an improvement on similar bridges built with conventional construction techniques. The GRS-IBS bridges have performed as well as conventional bridges structurally and functionally in addition to eliminating the bump at the end of the bridge that often results from conventional construction. At the time of this report, the suppression of the bump had been maintained for all in-service GRS-IBS bridges. The first bridge constructed with the IBS method, Bowman Road Bridge, has been in service since 2005 without the development of a crack in the asphalt layer from the road to the bridge.
Of the nearly 30 bridges built with GRS-IBS, 5 bridges have current data from monitoring of settlement at the abutments. The total settlement and deformation (and, thus, vertical strain) of the GRS abutment due the bridge load is recorded using either a standard survey level and rod system or an electronic distance measurement (EDM) survey referenced off a permanent survey pole and benchmarks. The methods to monitor performance are discussed in detail in the interim implementation manual.(1)
In both methods, settlement is recorded for both the abutment face wall and the superstructure. The difference between the settlement measured on the abutment face wall and on the superstructure is the vertical deformation within the GRS mass due to the bridge load. This value can be divided by the height of the abutment face wall to compute the vertical strain within the GRS abutment. The lateral strain and deformation can then be estimated.
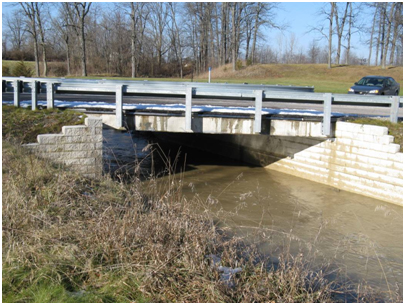
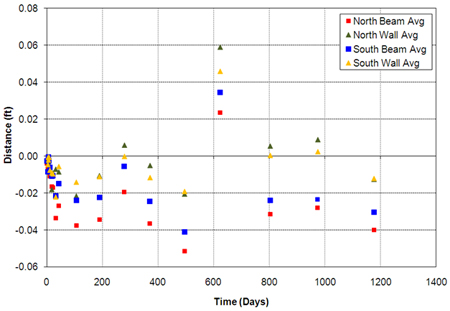
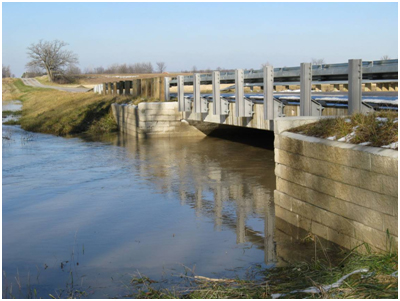
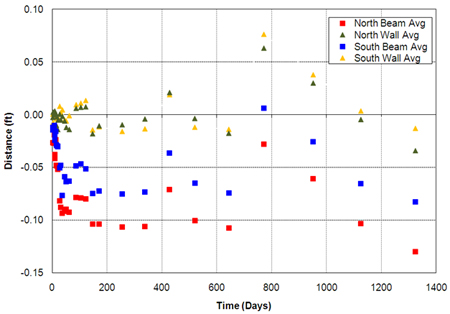
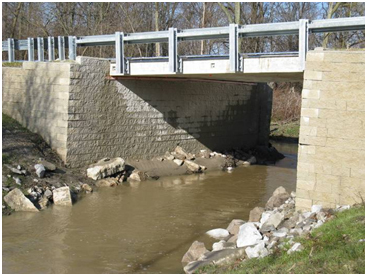
Table 2 gives general information about five bridges built using GRS-IBS. The settlement of three of the bridges, Vine Street, Glenburg Road, and Huber Road, was monitored with the survey level system over the course of 3.2, 3.6, and 2.4 years, respectively (see figure 17 through figure 22). Lateral deformation was not measured on these bridges, but it can be estimated knowing the vertical deformation (see chapter 3).
Table 2. Bridge information summary.
Bridge |
Date Built |
Abutment |
Abutment Height |
Dead Load |
Span Length |
Width of Bridge (ft) |
|---|---|---|---|---|---|---|
Vine Street |
October 2006 |
North |
12.36 |
2.37 |
50.0 |
32.67 |
South |
10.36 |
|||||
Glenburg Road |
May 2006 |
North |
13.22 |
4.53 |
30.6 |
28 |
South |
12.80 |
|||||
Huber Road |
August 2007 |
North |
17.30 |
1.53 |
28.0 |
28 |
South |
16.16 |
|||||
Bowman Road |
October 2005 |
East |
16.91 |
3.46 |
79.0 |
34 |
West |
16.47 |
|||||
Tiffin River |
July 2009 |
North |
20.52 |
3.69 |
134.0 |
36 |
South |
18.00 |
Figure 17. Photo. Vine Street Bridge.
Figure 18. Graph. Vine Street GRS-IBS settlement versus time.
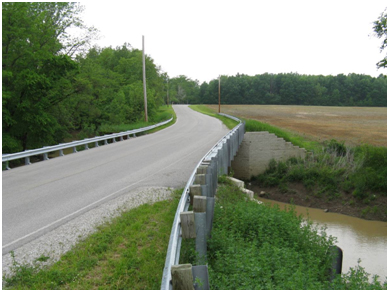
Figure 19. Photo. Glenburg Road Bridge under flood conditions.
Figure 20. Graph. Glenburg Road GRS-IBS settlement versus time.
Figure 21. Photo. Huber Road Bridge.
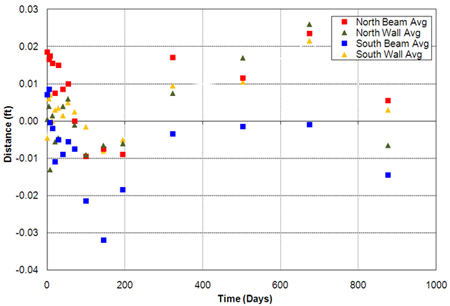
Figure 22. Graph. Huber Road GRS-IBS settlement versus time.
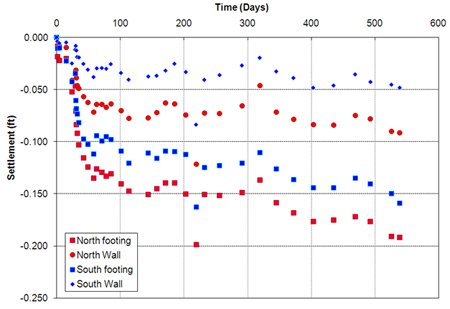
The settlement of two of the bridges, Bowman Road and Tiffin River, was monitored with the EDM and total station system over the course of 1.5 years (see figure 23 through figure 26). Lateral deformation was also recorded using this method for both bridges, but the noise level on Bowman Road Bridge was considered too high to be of any significant use.
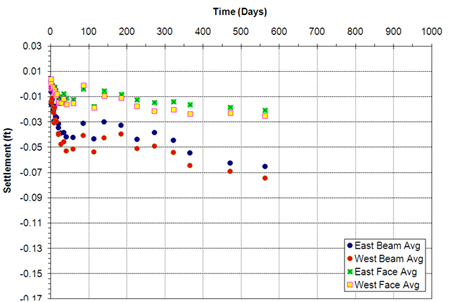
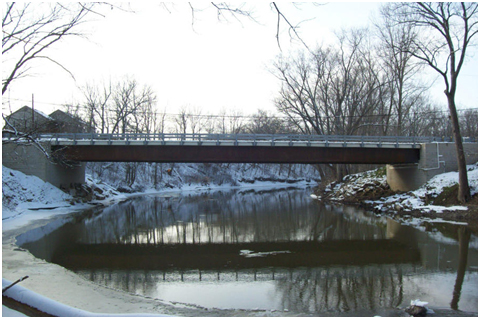
Figure 23. Photo. Bowman Road Bridge after 4.5 years.
Figure 24. Graph. Bowman Road GRS-IBS settlement versus time.
Figure 25. Photo. Tiffin River Bridge.
Figure 26. Graph. Tiffin River GRS-IBS settlement versus time.
For the majority of these cases, the bridges were built with concrete box beams, so the settlement was essentially instantaneous with one large load increment. The settlement history for Tiffin River Bridge, shown in figure 26, is slightly different than the settlement of the other bridges because the bridge was assembled in stages. The record began following the erection of the steel girders on day 0. The plot clearly shows the settlement due to the weight of the concrete deck (installed on day 30). The bridge was opened to traffic on day 60, but this is not apparent in the settlement record. The postconstruction settlement, from when the Tiffin River Bridge was opened to traffic until the last settlement reading, was 0.023 ft on the north abutment and 0.027 ft on the south abutment. Compared to the settlement due to casting the concrete deck (0.079 and 0.06 ft for the north and south abutments, respectively), the settlement after traffic is minimal and reaches the secondary settlement stage. In fact, in all of the bridges, the primary settlement essentially ceased before the bridges opened to traffic.
The differential settlement for an individual abutment, the uniformity of abutment settlement, the differential settlement between opposite abutments (i.e., bridge differential settlement), and the angular distortion were calculated for each of the five bridges (see table 3). The total vertical settlement and strain (including the GRS abutment and the foundation settlement) along with just the GRS abutment settlement and strain are shown in table 4.
Table 3. Movement information for five bridges.
Bridge |
Abutment |
Abutment Height |
Abutment Differential Settlement |
Uniformity of Abutment Settlement |
Bridge Differential Settlement |
Angular Distortion |
|---|---|---|---|---|---|---|
Vine Street |
North |
12.36 |
0.024 |
0.0007 |
0.009 |
0.00018 |
South |
10.36 |
0.015 |
0.0005 |
|||
Glenburg Road |
North |
13.22 |
0.020 |
0.0006 |
0.012 |
0.00039 |
South |
12.80 |
0.008 |
0.0002 |
|||
Huber Road |
North |
17.30 |
0.011 |
0.0004 |
0.01 |
0.00036 |
South |
16.16 |
0.021 |
0.0008 |
|||
Bowman Road |
East |
16.91 |
0.022 |
0.0007 |
0.019 |
0.00024 |
West |
16.47 |
0.003 |
0.0001 |
|||
Tiffin River |
North |
20.52 |
0.003 |
0.0001 |
0.033 |
0.00025 |
South |
18.00 |
0.005 |
0.0003 |
Table 4. Vertical settlement and strain information for five bridges.
Bridge |
Average Abutment Height |
Average Total Settlement |
Average |
Average GRS Settlement |
Average GRS Vertical Strain |
|---|---|---|---|---|---|
Vine Street |
11.36 |
-0.035 |
0.31 |
0.023 |
0.20 |
Glenburg Road |
13.01 |
-0.107 |
0.82 |
0.083 |
0.64 |
Huber Road |
16.73 |
-0.004 |
0.024 |
0.015 |
0.09 |
Bowman Road |
16.69 |
-0.07 |
0.42 |
0.047 |
0.28 |
Tiffin River |
19.26 |
-0.175 |
0.91 |
0.106 |
0.55 |
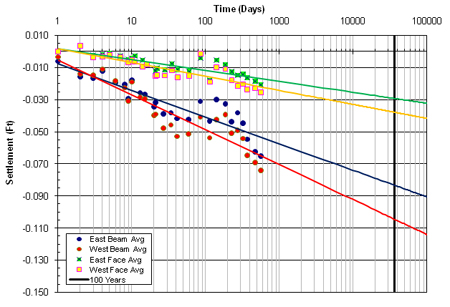
The long-term settlement can be forecasted by plotting the secondary settlement in log-time scale. For example, the settlement of Bowman Road Bridge is plotted in log-time scale with the appropriate trend lines included in figure 27. After 100 years (the service life of the bridge), the average predicted creep settlement is 0.09 ft for the bridge and 0.035 ft for the abutment walls. The difference between these two values, 0.055 ft, represents the creep settlement of the GRS abutment alone after 100 years.
Figure 27. Graph. Settlement versus log-time to predict creep settlement for the Bowman Road Bridge at 100 years.
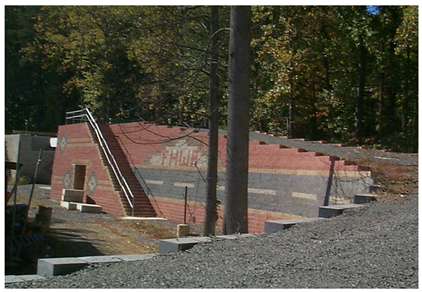
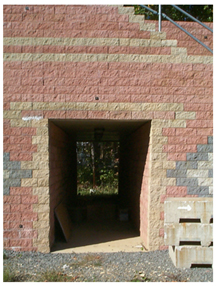
Another example comes from a long-term settlement study of a GRS-IBS structure built at FHWA's Turner-Fairbank Highway Research Center (TFHRC). This 12-year settlement study represents the longest settlement record of a GRS abutment. Within the embankment, a tunnel was constructed to serve several purposes, including measuring deformation, observing the versatility of GRS, understanding reinforcement strength on deformation, and providing a walkway to move people and equipment through the embankment (see figure 28 and figure 29). The overburden on the tunnel is equal to about 3,800 lb/ft2, about the same as a typical bridge load.
Figure 28. Photo. GRS-IBS tunnel at TFHRC.
Figure 29. Photo. Close-up of GRS-IBS tunnel at TFHRC.
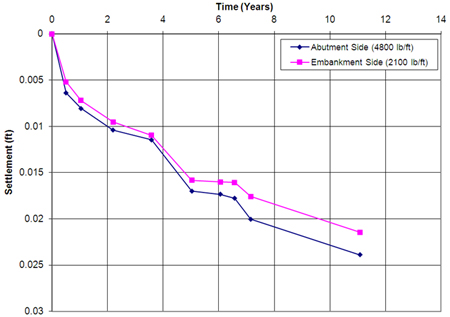
Settlement was measured on both sides of the tunnel wall: the abutment side and the embankment side. Each side of the wall had different reinforcement strengths. The abutment side was reinforced with 4,800 lb/ft geotextile, and the embankment side was reinforced with 2,100 lb/ft geotextile. The measurements over 12 years show that the side with 4,800 lb/ft reinforcement has settled about the same as the side with 2,100 lb/ft reinforcement (see figure 30). The settlement difference between the two sides is only about 0.0024 ft. The fabric strength did not play a role in the GRS deformation.
Figure 30. Graph. Settlement versus time for TFHRC tunnel.
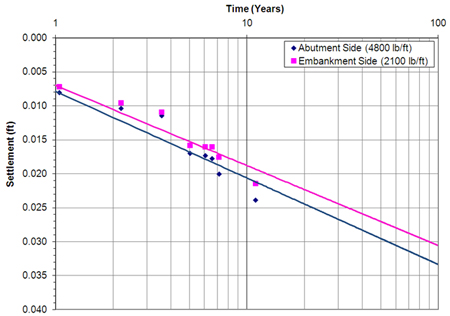
Figure 31 is a log-time scale plot of figure 30 used to provide an estimate of vertical deformation within the GRS abutment at 100 years. The plot predicts the settlement at 100 years on the abutment side of the tunnel walls at 0.033 ft and on the embankment side at 0.030 ft.
Figure 31. Graph. Settlement versus log-time to predict creep settlement for TFHRC tunnel at 100 years.
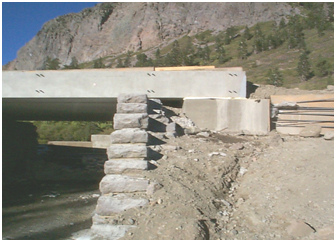
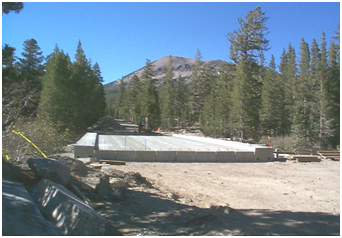
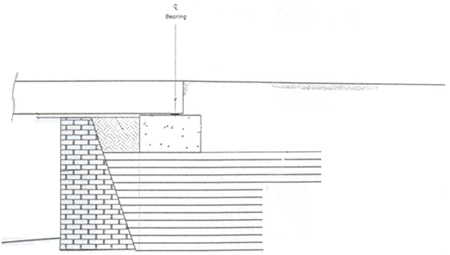
Several concrete box beam bridges were built by the Office of Federal Lands Highways and the U.S. Forest Service. The Lake Mamie and Twin Lake Bridges were built in Mammoth Lakes, CA, and have spans of 67 and 71 ft, respectively. Figure 32 and figure 33 are photos of these bridges. Figure 34 shows a cross sectional sketch of the GRS abutment behind the old stone abutment wall.(21) Only short-term settlement information is available for the bridges built in Mammoth Lakes, CA (see table 5).
Figure 32. Photo. GRS abutment behind historic stone abutment.
Figure 33. Photo. Concrete box bridge on GRS abutment in Mammoth Lake, CA.
Figure 34. Illustration. Cross section of GRS abutment behind historic stone abutment.
Table 5. Summary of in-service GRS abutments.
Bridge |
Date Built |
Abutment |
Average Total Settlement |
Differential Settlement |
Uniformity of Abutment Settlement |
Angular Distortion |
|---|---|---|---|---|---|---|
Lake Mamie |
Fall 2000 |
Both |
-0.013 |
No data |
No data |
No data |
Twin Lake |
Fall 2000 |
Both |
-0.021 |
No data |
No data |
No data |
Cecil Creek |
June 2005 |
A |
-0.098 |
0.013 |
0.0007 |
0.001 |
B |
-0.02 |
0.002 |
0.0001 |
|||
Big Lake |
June 2005 |
A |
0.007 |
0.040 |
0.002 |
0.0005 |
B |
-0.029 |
0.075 |
0.004 |
|||
Cut Off Creek |
June 2005 |
A |
0.078 |
0.050 |
0.003 |
0.0001 |
B |
0.072 |
0.001 |
0.00006 |
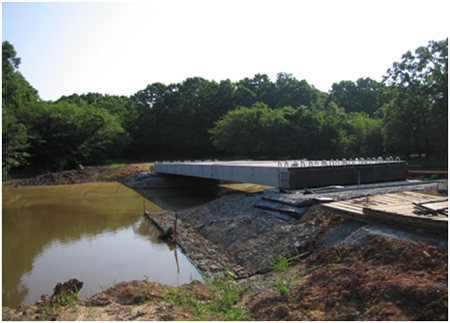
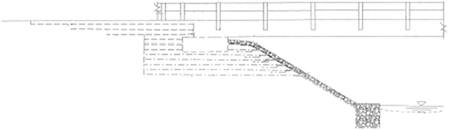
Three bridges were also built in the Ouachita wildlife refuge in Louisiana (see figure 35 and figure 36). Each bridge has a span of 76 ft. The bridges are typically submerged under water for 6 months each year. Table 5 provides the settlement data for these bridges after 147 days of beam placement. The settlement performance of these bridges was well within acceptable criteria.
Figure 35. Photo. Concrete box bridge on GRS abutment in Ouachita wildlife refuge.
Figure 36. Illustration. Cross section of GRS abutments in Ouachita wildlife refuge.
Lateral deformation has not been widely measured on in-service bridges because of difficulties in obtaining accurate long-term information. Previous GRS walls and abutments have performed well and have shown no reason for concern with lateral deformation. Theoretical calculations given in chapter 3 provide a method to determine the lateral deformation and strain based on an assumption of a zero loss of volume. The predicted average lateral deformation and lateral strain for the five previously discussed in-service bridges are shown in table 6.
Table 6. Predicted lateral deformations of five in-service bridges.
Bridge |
Average Abutment Height |
Width of Bridge Bearing Area + Setback |
Average |
Calculated Lateral Deformation |
Calculated |
|---|---|---|---|---|---|
Vine Street |
11.36 |
2.64 |
0.023 |
0.011 |
0.004 |
Glenburg Road |
13.01 |
2.14 |
0.083 |
0.027 |
0.013 |
Huber Road |
16.73 |
2.64 |
0.015 |
0.005 |
0.002 |
Bowman Road |
16.69 |
3.64 |
0.047 |
0.02 |
0.005 |
Tiffin River |
19.26 |
5.14 |
0.089 |
0.047 |
0.009 |
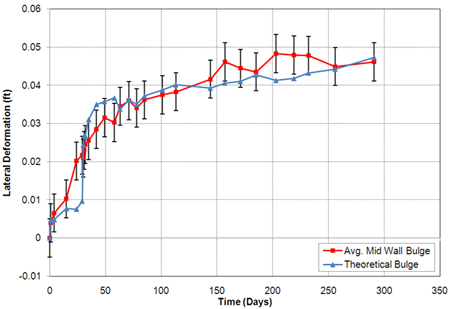
Of the five in-service bridges shown in table 3, lateral deformation was only measured for Tiffin River Bridge. Measuring the horizontal movement was difficult due to the seasonal movement of the survey pole. The pole foundation extended approximately 4 ft below the ground surface. In dry periods, the data suggest that the pole settled and tipped. The pole then rebounded after soil moisture returned to normal levels. Attempts were made to correct the pole location by using back-site readings. However, due to the fact that many of the measured movements were smaller than the apparent movement of the survey pole over the long term, it is difficult to get a precise absolute movement. This is particularly true for the lateral deformation movement of abutment wall faces. By comparing the distance between both abutment faces, however, the effect of pole movement is minimized. While this does not allow the movement of each abutment to be evaluated independently, it does provide a measure of the average wall maximum bulge between the two abutment wall faces. Figure 37 shows a comparison between the calculated and measured lateral deformation as previously explained for Tiffin River Bridge (equation 11). The theoretical calculation matches very closely, within the ±0.005-ft error of the EDM system.
Figure 37. Graph. Measured and calculated lateral deformation on the Tiffin River Bridge GRS abutment.
Thermal cycles occur on every bridge structure due to daily and seasonal temperature variations. The severity of the expansion and contraction depends on the coefficient of thermal expansion of the bridge. However, based on the experience of in-service GRS-IBS bridges with spans of up to 140 ft, the performance of GRS-IBS is not affected by thermal cycles. GRS-IBS accommodates movement related to thermal cycles, so the effect on the abutment is minimal.
GRS-IBS accommodates movement through the integrated transition behind the beam ends. The road base is wrapped with geosynthetic and is then well-compacted directly against the beam end. The wrapped face confines the soil and allows for the beam to contract without the fill behind the beam ends sloughing off to fill the void. As a result, excess pressures behind the beam during expansion are also avoided. The road base is not only wrapped vertically but also laterally to prevent lateral spread.
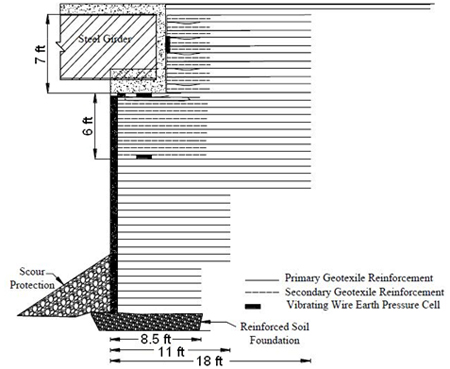
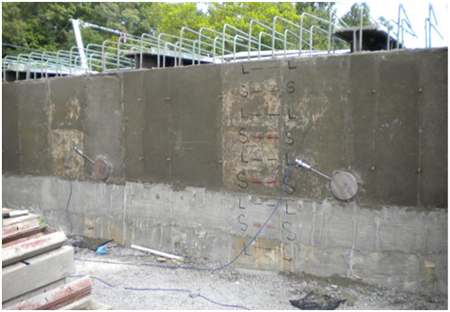
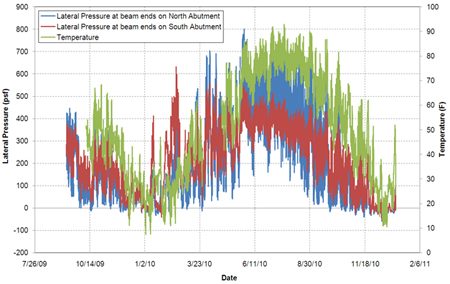
The performance of Tiffin River Bridge, the longest GRS-IBS steel bridge span (140 ft), has been monitored since construction.(22) Vibrating wire earth pressure cells were installed on the back wall of each abutment to measure lateral pressures between the superstructure and the integrated approach due to expansion and contraction of the steel girders (see figure 38 and figure 39). The average lateral earth pressure changes in magnitude with both daily and seasonal temperature effects (see figure 40). During the fall and winter (contraction), the lateral pressure decreased to about 62 lb/ft2. During the spring and summer (expansion), the lateral pressure increased to as high as about 700 lb/ft2.(22) After one thermal cycle, it appears that the lateral pressure is nonlinear with temperature and displays hysteretic behavior. Monitoring continues, however, to determine the effect after multiple thermal cycles.
Figure 38. Illustration. Instrumentation for Tiffin River Bridge.
Figure 39. Photo. Pressure cells behind back wall on Tiffin River Bridge.
Figure 40. Graph. Average lateral pressure on back wall for Tiffin River Bridge.