U.S. Department of Transportation
Federal Highway Administration
1200 New Jersey Avenue, SE
Washington, DC 20590
202-366-4000
Federal Highway Administration Research and Technology
Coordinating, Developing, and Delivering Highway Transportation Innovations
 | Report |  |
| This report is an archived publication and may contain dated technical, contact, and link information |
|
| Publication Number: FHWA-HRT-11-027 Date: JANUARY 2011 |
Publication Number: FHWA-HRT-11-027 Date: JANUARY 2011 |
As described in chapter 1, block pull-out and connection force is not an issue in GRS walls and abutments built with modular block facings because of the frequency of reinforcement between each layer of block. Many case studies have shown that a frictional connection between the modular blocks and the geotextile is compatible with deformations of the GRS composite mass. The facing blocks strain with the GRS mass, adjusting to lateral loads in order to maintain equilibrium with lateral thrust. In other words, if the GRS mass strains laterally 0.5 percent, then the facing will also displace that amount without attracting loads against the face.(9)
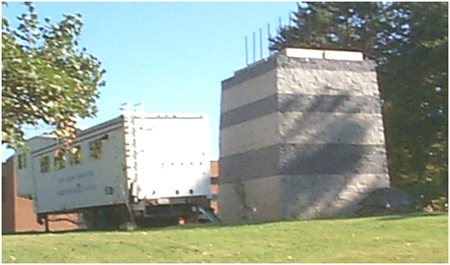
The compatibility of the frictional connection method has been illustrated through performance tests. After a vertical stress of 26 kips/ft2, the performance test for Defiance County, OH, showed that the modular facing blocks remained frictionally connected to the GRS mass.(1) Similar results were seen in other tests. For example, a GRS pier built at TFHRC was loaded to 19 kips/ft2 to show that the pier maintained its rectangular shape without the loss of any of the facing blocks (see figure 41). The frictional capacity between the blocks and the GRS mass was not exceeded even after extreme vertical loading conditions.
Figure 41. Photo. TFHRC pier test.
Nevertheless, it is important to understand the general capacity of the frictional connection method and the overall mechanics of the GRS system. For this reason, the following block pull-out test was devised to determine the amount of force required to mobilize a modular block out of the face of the wall (the pull-out force). The test was performed on blocks at different heights along the GRS wall to determine the relationship between the normal force on top of the block and the required pull-out force.
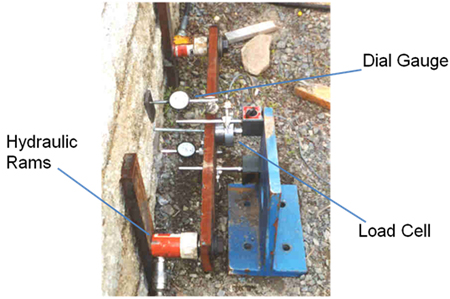
To evaluate the frictional capacity, block pull-out tests were conducted on an actual GRS wall to quantify the amount of force necessary to move the block relative to the geotextile (see figure 42). The test was performed on segmental retaining wall (SRW) blocks frictionally connected to a 2,400 lb/ft geotextile. The setup for the test is shown in figure 43. The block pull-out tests were performed for nearly every course of blocks on a 12-ft-high wall, as outlined in the following procedure. Note that the same setup procedure can also be used on CMU blocks.
Figure 42. Photo. Block pull-out test on GRS wall.
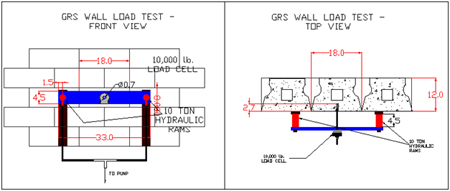
Figure 43. Illustration. Block pull-out test setup.
The test apparatus depicted in figure 42 and figure 43 includes the following:
The apparatus is connected to the block according to the following steps:
Once the test apparatus is set up and properly connected to the block, the following procedure can be used to determine the block pull-out force:
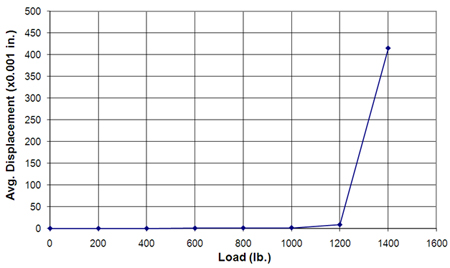
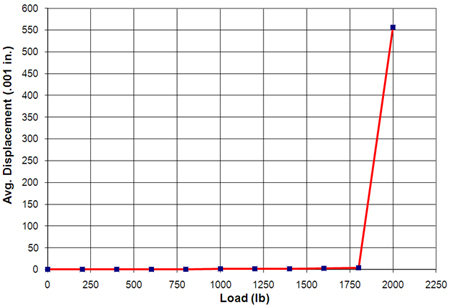
Block pull-out capacity was measured at various heights along the GRS wall (2, 3, 4, 7, 8, 9, 10, 11, 12, 13, 15, 17, and 18 rows down). The load-displacement behavior for each test was recorded. In all cases, the block did not displace until the frictional capacity was exceeded. For example, the load displacement behavior is shown in figure 44 for a block that was seven rows down from the top with a normal force equal to 425 lb on top of it. The same trend is shown in figure 45 for a block that was 11 rows down from the top with a normal force equal to 765 lb on top of it, except the force required to move the block was higher. The same trend was true for the remaining tests.
Figure 44. Graph. Pull-out test results for an SRW block seven rows from the top.
Figure 45. Graph. Pull-out test results for an SRW block 11 rows from the top.
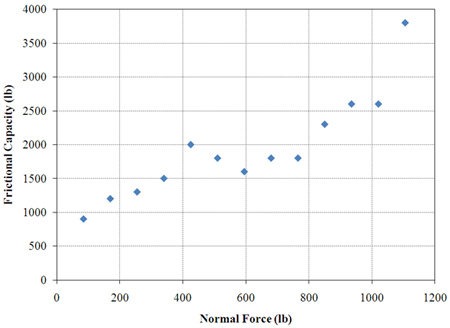
The results show that a fairly linear relationship exists between the normal force on top of the block, which corresponds to the number of blocks down from the top of the wall, and the amount of force necessary to initiate block movement (see figure 46). The pull-out capacity for the experiment was chosen by reviewing the load versus displacement for the value directly before the greatest change in displacement.
Figure 46. Graph. Pull-out test results in terms of normal force for SRW blocks.
The graph shows that the greater the normal force available due to the added weight of the blocks from above, the greater the block pull-out capacity. In a typical abutment, the thrust at the face is considerably lower (see chapter 1). Therefore, block pull-out and connection force is not a concern with GRS walls and abutments under normal conditions. It may, however, be a factor in designing for extreme events, seismic or impact. To add conservatism to the design and prevent any issues at the top of the wall (where the normal forces are the lowest), the top three courses of blocks are filled with a concrete fill mix and rebar to tie these blocks together.(1) It should be noted that although the pull-out tests were performed on SRW blocks, similar results would occur with CMU facing elements.