Post-Earthquake Reconnaissance Report on Transportation Infrastructure: Impact of the February 27, 2010, Offshore Maule Earthquake in Chile
CHAPTER 2. GEOLOGY, SEISMOLOGY, AND GROUND MOTIONS
2.1 BACKGROUND
The USGS Web site and a report provided by the Geotechnical Extreme Events Reconnaissance (GEER) team were used to provide necessary background information regarding the seismic and geologic setting for the sites specifically investigated by TIRT.(1,2) Additional information not available at the time of the USGS posting and the GEER report (e.g., boring logs, ground motion data, etc.) is also included in this chapter.
2.2 GEOLOGY AND SEISMOLOGY
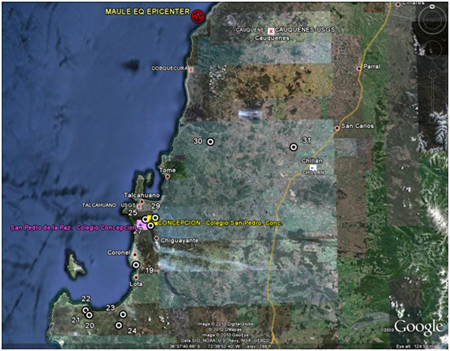
The offshore Maule earthquake occurred on February 27, 2010, at 3:34 a.m. (local time) at the boundary between the Nazca and South American tectonic plates.(1) The location of the earthquake's epicenter is shown in figure 3 relative to the sites investigated by TIRT, shown as white dots with black centers and white numbers. The earthquake epicenter, located at 35.909 °S, 72.733 °W, was approximately 208 mi (335 km) southwest of Santiago, 65.2 mi (105 km) northeast of Concepción, and 71.4 mi (115 km) west-southwest of Talca. The depth of the earthquake hypocenter was 22 mi (35 km).
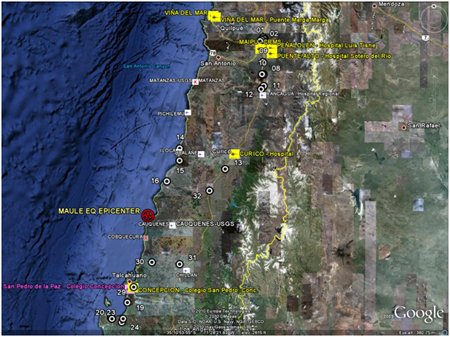
© Google, Europa Technologies, DMapas, and Inav/Geosistemas SRL
Figure 3. Map. Location of epicenter, seismic recording stations, and TIRT sites.
Chile has a long history of severe earthquakes along its approximately 1,860-mi (3,000 km) coastline. Since the beginning of the 20th century, five earthquakes of M8.0 or higher have been recorded in Chile: M8.2 in 1906, M8.2 in 1943, M8.0 in 1985, and an M8.2 foreshock that preceded an M9.5 earthquake in 1960. Since 1973, there have been 13 events of M7.0 or greater.
The February 27, 2010, earthquake originated about 140 mi (230 km) north of the source region (the point of initial rupture) of the M9.5 earthquake of 1960, the largest instrumentally recorded earthquake in the world. The 2010 earthquake was approximately 190 mi (300 km) south of the source region of the M8.2 earthquake of 1906 and approximately 540 mi (870 km) south of the source region of the M8.5 earthquake of 1922.
Figure 4 shows the spatial relationship between previous earthquakes (M6.5 or greater, 1900–1963 and M5.5 or greater, 1964–present) and the 2010 M8.8 offshore Maule earthquake (depicted by a yellow star) and its associated aftershocks (depicted by yellow circles). The points of initial rupture for the M8 or larger earthquakes are denoted by red circles with thick black borders. The estimated rupture zones of the 1922 M8.5 and 1960 M9.5 earthquakes are marked in white. These rupture zones were defined by the areal extent of aftershocks or by geological and macroseismic observations. The 2010 M8.8 earthquake ruptured the portion of the South American subduction zone between these massive historical earthquakes, with the 1906 and 1922 megaquakes to the north and the 1960 megaquake to the south. The offshore Maule earthquake rupture zone was over 370 mi (600 km) long and 81 mi (130 km) wide. The last time this portion of the subduction zone ruptured may have been the 1835 event experienced by Charles Darwin.
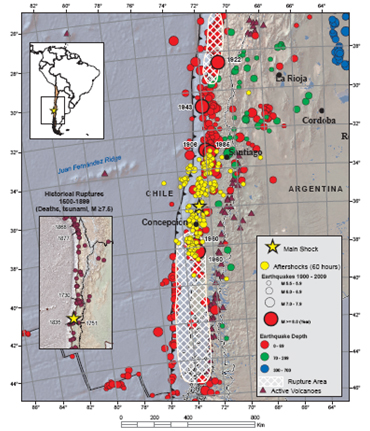
Figure 4. Map. Historic seismicity for Chile.(1)
The 2010 offshore Maule earthquake occurred as thrust faulting on the interface between two plates, with the Nazca plate moving down and landward below the South American plate. The slip rate between the two plates is estimated to be approximately 2.7 inches/year (70 mm/year).(3) This rate is much higher than the slip rate for the Cascadia subduction zone located along coastal Washington and Oregon (approximately 1.4 inches/year (35 mm/year)), which explains the more frequent occurrence of this type of event along the Chilean coastline.(4) Ruegg et al. estimated that at least 33 ft (10 m) of slip deficit had accrued on this segment of the plate boundary since the last time this portion of the subduction zone ruptured in 1835.(3) GPS measurements indicate that the actual horizontal movement of the overriding plate was as much as 12 ft (3.7 m) to the southwest at Concepción, 15 ft (4.7 m) at Constitución, and approximately 2 ft (0.5 m) at Santiago.
This type of earthquake is illustrated conceptually in figure 5. Overall, a tectonic plate descends, or "subducts," beneath an adjoining plate in a stick-slip fashion. Between earthquakes, the plates slide freely at great depth, but at shallow depth, they stick together. A key aspect of this type of earthquake is the buildup of stress at the stuck portion of the boundary. As the upper plate attempts to override the lower plate, it deforms and is uplifted until the stress is too great. At that point, the stuck portion of the boundary catastrophically ruptures, allowing the front portion of the upper plate to spring seaward and upward while the rest of the upper plate relaxes, causing subsidence. Field observations reported by GEER indicate that the coastline from the vicinity of the epicenter south to the Arauco peninsula experienced uplift up to approximately 7 ft (2 m), whereas areas north of Constitución to Bucalemu experienced subsidence of up to about 3 ft (1 m).(2) Observations made by TIRT at the sites investigated appear to confirm these findings. This type of coseismic deformation has historically been accompanied by the generation of tsunamis. For the offshore Maule earthquake, a tsunami that severely impacted the coast north of the epicenter was produced. As the area to the north of the epicenter also experienced significant coseismic subsidence, tsunami run-up was increased, resulting in greater onshore damage.
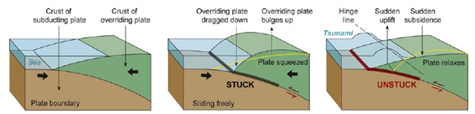
Figure 5. Illustration. Conceptual diagram of a subduction zone earthquake.(2,4)
Another key aspect of this type of earthquake is the tendency of such an event to produce many strong aftershocks as the plates adjust to the sudden change in stresses following rupture. The aftershocks themselves can produce a significant hazard to the structures and facilities damaged by the main shock, as well as to the people within or near the partially damaged structures. Figure 4 and figure 6 show maps illustrating the number and distribution of aftershocks, some of which approached M7.0. The cross section of the aftershock locations as a function of depth and distance in figure 6 illustrates the location of the rupture surface. The hypocenter of the main shock is marked with a star.
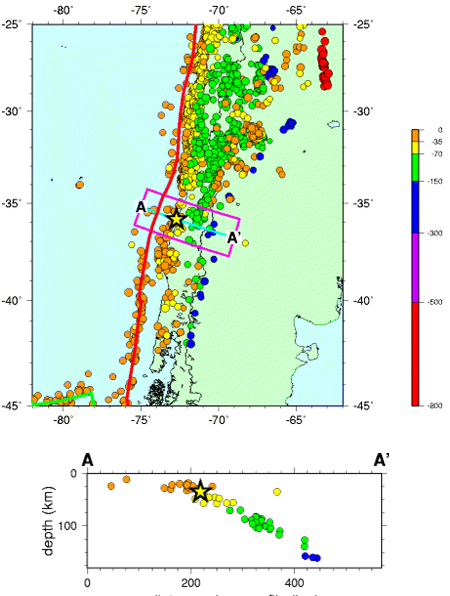
1 km = 0.621 mi
Figure 6. Illustration. Offshore Maule earthquake aftershock distribution with depth.(5)
2.3 GROUND MOTIONS
The actual ground motions experienced at a particular site depend on the soil type and density present, as well as the three-dimensional aspects of the local geologic structure beneath and around the site. In general, as soils become softer or looser, the ground motions tend to increase, especially at longer periods. Basin effects can also amplify ground motions at a particular site. As the team traveled throughout the region impacted by the earthquake, it was apparent that damage to transportation and other structures was concentrated in specific areas, with areas in between showing little or no damage. GEER reported similar observations and attributed the difference to the presence of softer silts and clays at the affected sites and, in some cases, to basin effects.(2)
At the time of this report, the available ground motion data from the offshore Maule earthquake was limited, and ground motion records were only available from some of the stations identified in figure 3, shown as small rectangles with blue accelerograms. White icons denote stations where no accelerogram was available. Yellow icons denote stations where an accelerogram was available but digital records of the ground motion were not available. Pink icons (only one, in Concepción) denote stations where digital records of the ground motion were available.
The available records, summarized in table 2, are uncorrected and may be influenced by the structures in which the measurements were taken. The ground motion records are from two different sources, Boroschek, et al. and the University of Chile Department of Geophysics.(6,7) Boroschek, et al. indicated that all ground motion monitoring equipment was in one-story structures, but in some cases, other types of structures were nearby.(6) All of these records require careful evaluation due to potential soil-structure interaction effects.(6,7) Specifically, Boroschek, et al. noted that the high accelerations at the Maipú site were being reviewed for soil-structure interaction effects. Soil classifications at each of these monitoring sites were being investigated at the time of this report.(6) Boroschek, et al. also cautioned that the quake data recorder (QDR) only recorded the first 100 s of motion.(6) However, the motion actually lasted about 140 s. Therefore, the last 40 s of motion is missing from these records. QDR equipment was used for all of the ground motion records in table 2, except Universidad de Chile Deptartamento de Ingeniería Civil (interior building); Estación Metro Mirador, Santiago; and Colegio San Pedro, Concepción. Examples of these ground motions and their respective response spectra (where available) are provided in figure 7 through figure 14.
Table 2. Summary of available earthquake records for the offshore Maule earthquake.(6)
Location of Monitoring Station |
Source of Information |
Maximum Horizontal Acceleration (g) |
Maximum Vertical Acceleration (g) |
Universidad de Chile, Depto.
Ing. Civil (interior building) |
RENADIC(6) |
0.17 |
0.14 |
Estacion Metro Mirador, Santiago |
RENADIC(6) |
0.24 |
0.13 |
CRS Maipú RM |
RENADIC(6) |
0.56 |
0.24 |
Hospital de Tisné RM |
RENADIC(6) |
0.30 |
0.28 |
Hospital Sótero de Río RM |
RENADIC(6) |
0.27 |
0.13 |
Hospital de Curicó |
RENADIC(6) |
0.47 |
0.20 |
Hospital de Valdivia |
RENADIC(6) |
0.14 |
0.05 |
Vina del Mar, Marga Marga |
RENADIC(6) |
0.35 |
0.26 |
Vina del Mar (Centro) |
RENADIC(6) |
0.33 |
0.19 |
Colegio San Pedro, Concepción |
Red Sismológica Nacional |
0.65 NS,
0.58 EW |
0.60 |
San Pedro de la Paz, Colegio Concepción |
USGS(8) |
0.65 NS,
0.61 EW |
0.58 |
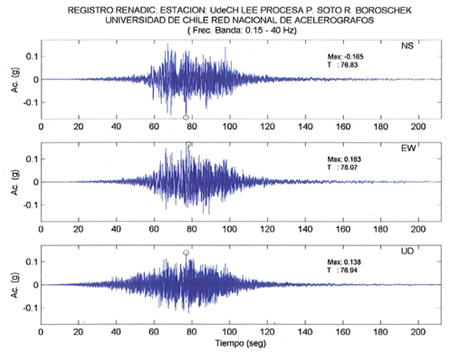
Figure 7. Illustration. Accelerogram from Universidad de Chile, Depto. Ing. Civil (interior building).(6)
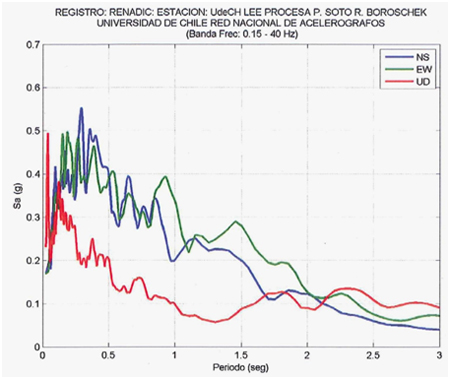
Figure 8. Illustration. Response spectra from Universidad de Chile,
Depto. Ing. Civil (interior building).(6)
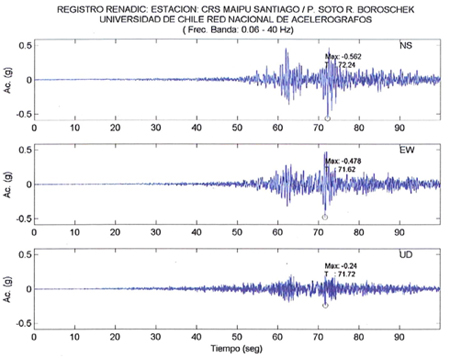
Figure 9. Illustration. Accelerogram from CRS Maipú RM.(6)
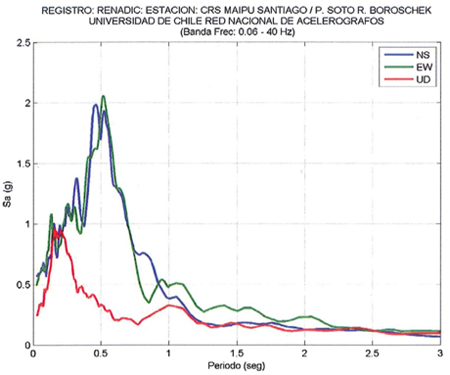
Figure 10. Illustration. Response spectra from CRS Maipú RM.(6)
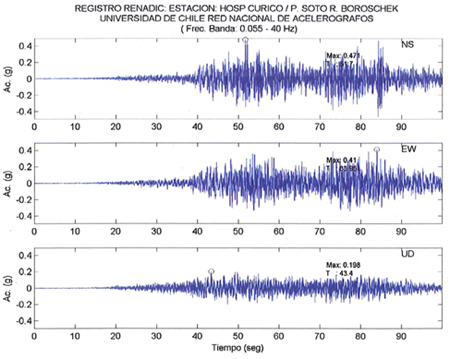
Figure 11. Illustration. Accelerogram from Hospital de Curicó.(6)
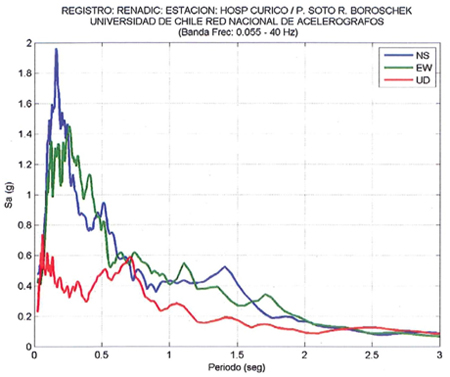
Figure 12. Illustration. Response spectra from Hospital de Curicó.(6)
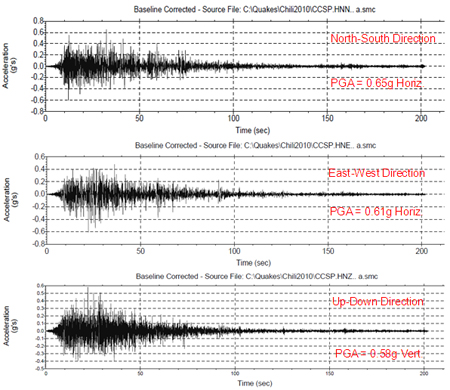
Figure 13. Illustration. Accelerogram from San Pedro De La Paz, Colegio Concepción.(8)
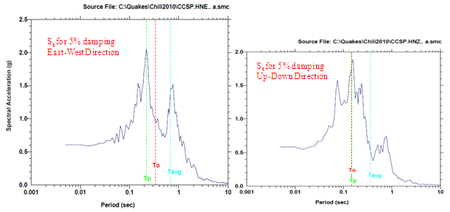
Figure 14. Illustration. Response spectra from San Pedro De La Paz, Colegio Concepción.(8)
Figure 13 is the only time history for which a digital file was available at the time of this report. For the east-west direction in that time history, the bracketed duration (i.e., A > 0.05 g) was 152 s and the duration of significant shaking based on normalized Arias intensity was approximately 76 s. Visually and in terms of peak values, this ground motion record is very similar to the one obtained at Colegio San Pedro.
Figure 15 through figure 19 are maps marked with accelerograms and TIRT structure sites to show the location of the ground motion recording stations relative to the structure sites visited. The symbols used in figure 3 are also used in these figures. See chapter 1 and chapter 3 for a more detailed description of each structure site.
© Google, Inav/Geosistemas SRL, DMapas, and GeoEye
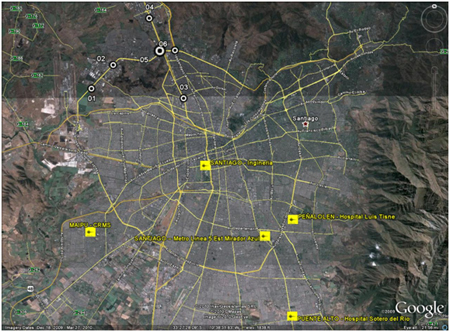
Figure 15. Map. Locations of ground motion sensors and structures visited by TIRT—Santiago vicinity.
© Google, Inav/Geosistemas SRL, DMapas, GeoEye, and DigitalGlobe
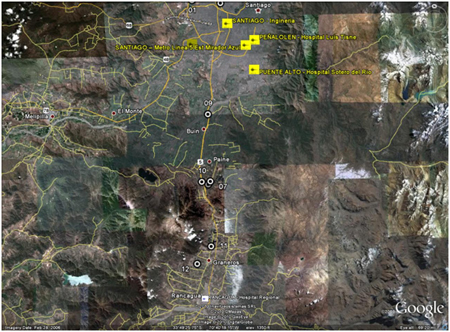
Figure 16. Map. Locations of ground motion sensors and structure visited by TIRT—Santiago to Rancagua.
© Google, Cnes/Spot Image, DMapas, GeoEye, and DigitalGlobe
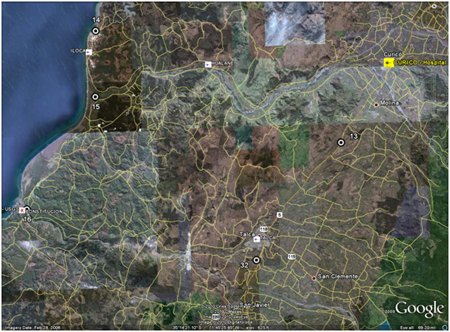
Figure 17. Map. Locations of ground motion sensors and structures visited by TIRT—Curicó, Talca, Iloca vicinity.
© Google, Inav/Geosistemas SRL, DMapas, and GeoEye
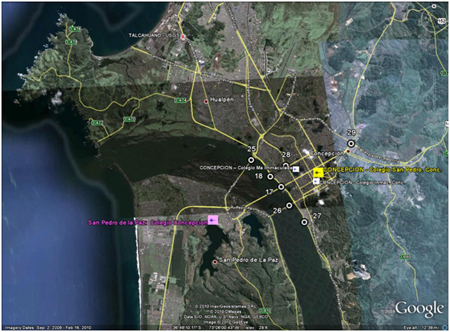
Figure 18. Map. Locations of ground motion sensors and structures visited by TIRT—Concepción vicinity.
© Google, DigitalGlobe, DMapas, and GeoEye
Figure 19. Map. Locations of ground motion sensors and structures visited by TIRT—Maule epicenter to Tubul vicinity.
GEER provided geologic information that can be used in combination with the subsurface information gathered by TIRT to preliminarily assess the potential effect subsurface conditions may have had on ground motion severity.(2) The subsurface information gathered by TIRT is reported in appendix A. For example, the GEER report indicates that relatively soft silts and clays and, in some cases, ash deposits are likely to be encountered in the western sector of Santiago, where structure sites 1–6 are located.(2) A boring log obtained for the original bridge design at sites 1 and 2 indicates that subsurface soils there consist of 16 ft (5 m) of soft to medium stiff clay underlain by more than 33 ft (10 m) of stiff to very stiff silty clay with layers of fine sand. Based on the AASHTO and National Earthquake Hazards Reduction Program (NEHRP) seismic site classification systems, these soils would likely be classified as Site Class E soils, and significant ground motion amplification would be expected. The eastern sector of Santiago, where most of the available earthquake ground motion measurements were taken, generally consists of sands and gravels. It could therefore be expected that, in general, ground motion measurements in the eastern sector of Santiago should be less severe than those obtained in the western sector because of better soil conditions in addition to being farther away from the earthquake epicenter. A comparison of the ground motions in figure 7 with those in figure 9 appears to support this conclusion—the peak accelerations in figure 7 (0.17 g) are considerably less than those in figure 9 (0.56 g). The other ground motion records obtained in the eastern sector of Santiago range from 0.24 g to 0.30 g, still considerably lower than the peak measured at CRS Maipú RM (see figure 9). The response spectra also seem to indicate the potential effect of softer soils in that the peak spectral acceleration is pushed out to longer periods and the spectral acceleration magnitude is two to four times higher than that of the eastern sites. Based on the location of the first six sites, a reasonable preliminary conclusion is that the acceleration time history and response spectra for CRS Maipú RM, shown in figure 9 and figure 10, are most representative of the ground motions that occurred at the first six bridge sites. Once subsurface geotechnical data for these earthquake ground motion monitoring sites becomes available and the soil-structure interaction effect is fully investigated, these preliminary conclusions can be confirmed.
The next set of structure sites, sites 7–10, are probably on the margin of the poorer soil conditions based on the geologic data published by GEER.(2) However, some geotechnical boring information is available at sites 7, 8, and 10 indicating the presence of at least 33 to 49 ft (10 to 15 m) of medium to stiff silty clays or sandy silts, with stiff to hard silts and clays and some dense sand or gravel layers at depth (see appendix A). Based on the AASHTO and NEHRP classification systems, these soils would likely be classified as Site Class D or E soils, and significant ground motion amplification would be expected. Again, the CRS Maipú RM ground motions (shown in figure 9 and figure 10) appear to be the most applicable to these structure sites with due consideration given to the cautionary issues previously discussed.
Sites 11–13 and 32 are far enough away from Santiago that closer ground motion records should be used. The only ground motion record available in this area is the one at Curicó (see figure 11 and figure 12). The GEER report does not provide specific geologic information, but deposits at Talca (south of Curicó) are likely to be alluvial and marine sediments and are probably highly variable.(2) Therefore, the strength of the ground motions in this region is likely to be highly variable, as indicated by the inconsistent damage to structures and facilities.
South of Talca and closer to the coast, the ground motion records in the interior may not be representative of the ground motions experienced, considering proximity to the epicenter and subsurface conditions present. Fortunately, two ground motion records are available in Concepción (see figure 13). According to GEER, Concepción has both poor soils (loose alluvial and marine deposits) and a geologic structure, due to major faults running through the area, that could contribute to amplification of ground motion (see figure 20 and figure 21).(2) Damage due to the offshore Maule earthquake was particularly severe in Concepción. The spatial distribution of the damage is apparently similar to the damage seen during the 1960 M9.5 event, trending along parallel linear zones. This similarity shows the effect geologic basin structure and soil deposits may have had on the ground motions. The location of the Colegio San Pedro monitoring station is shown in figure 21. This monitoring station is located in between two significantly damaged areas. Therefore, it is not clear if the Colegio San Pedro ground motion record, which is similar to the San Pedro de la Paz record provided in figure 13, represents the most damaged areas. Considering the high peak acceleration of 0.65 g in the horizontal direction and 0.60 g in the vertical direction, the long duration, and the similarity to the San Pedro de la Paz ground motion, a reasonable preliminary conclusion is that these two ground motion records are representative of what occurred in the significantly damaged areas. While it is unknown if there are any geologic basin issues for the sites farther south (e.g., sites near Tubul), the soil conditions are obviously poor and probably similar to conditions in parts of Concepción (see chapter 5). Therefore, this ground motion should be considered applicable to sites 17–29.
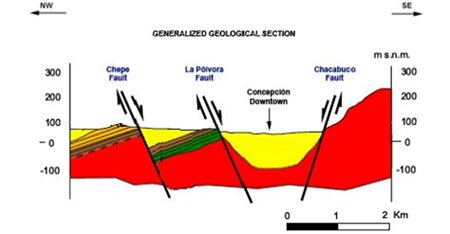
1 km = 0.621 mi
Figure 20. Illustration. Geologic cross section of Concepción.(2)
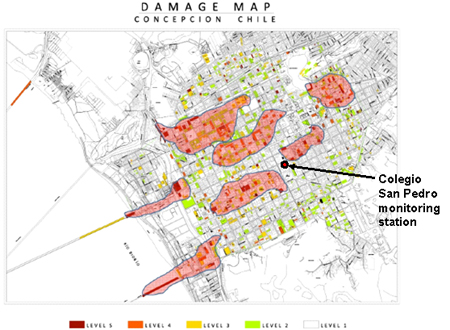
Figure 21. Map. Damaged sections in downtown Concepción.(2)
Not much information is available on the subsurface conditions of sites 15, 16, and 30–32, and there are no nearby ground motion records for those locations. Until more is known, a compromise between the Curicó and Concepción ground motions could be used for preliminary analyses.
Once more ground motion records and geotechnical subsurface data are available to confirm these conclusions (based primarily on geologic mapping), the ground motions most applicable to each structure site can be better assessed.
|


