Post-Earthquake Reconnaissance Report on Transportation Infrastructure: Impact of the February 27, 2010, Offshore Maule Earthquake in Chile
CHAPTER 5. GEOTECHNICAL PERFORMANCE OF TRANSPORTATION INFRASTRUCTURE
5.1 OVERVIEW
Geotechnical issues influencing the degree of damage to the transportation infrastructure include amplification of ground motions due to the presence of soft soil or basin effects, excessive lateral foundation flexibility due to soft or loose soil conditions, settlement, lateral ground movement, and ground failure. Settlement, lateral ground movement, and ground failure appeared to be primarily the result of soil weakening due to liquefaction but, in some cases, were due to seismically generated inertial forces acting on the soil mass for existing soil slopes that may have been marginally stable.
A significant portion of this chapter is devoted to the effect liquefaction can have on transportation infrastructure. Liquefaction is the significant loss of soil strength and stiffness resulting from the generation of excess pore-water pressure in saturated, predominantly cohesionless soils. Kramer provides a detailed description of liquefaction, including types of liquefaction phenomena, evaluation of liquefaction susceptibility, and effects of liquefaction.(12)
As the pore-water pressure in the soil builds up during liquefaction, loss of soil strength occurs. Then, settlement of the liquefied soil occurs as the excess pore-water pressures dissipate after the earthquake. The potential effects of strength loss and settlement include the following:
- Slope failure, flow failure, or lateral spreading. The strength loss associated with pore-water pressure buildup can lead to slope instability. If the soil liquefies, the soil strength reduces to a very low residual value, and the slope can become unstable. The lateral loads due to soil movement created by the unstable soil mass can cause bridge substructure distortion and unacceptable deformations and moments in the superstructure.
- Reduced foundation bearing resistance. The residual strength of liquefied soil is often a fraction of non-liquefied strength. This loss in strength can result in large displacements or foundation bearing failure.
- Reduced soil stiffness and loss of lateral support for deep foundations. This loss in soil strength can change the lateral response characteristics of piles and shafts under lateral load, making them much more flexible. This increases deformations and forces in the superstructure.
- Vertical ground settlement as excess pore-water pressures induced by liquefaction dissipate, resulting in downdrag loads on and a loss of vertical support for deep foundations. When liquefaction-induced downdrag occurs, it can cause significant foundation settlement, depending on the resistance of the soil at the tips of the foundation elements.(13)
In this chapter, these geotechnical issues are addressed for transportation facilities including bridges, pier structures, retaining walls, embankments, and roadway cuts.
5.2 GEOTECHNICAL OBSERVATIONS REGARDING BRIDGE AND PIER STRUCTURES
Of the 32 sites visited, 15 exhibited signs of liquefaction. Bridge performance tended to be poorer when liquefaction occurred than when it did not. The primary cause of transportation infrastructure performance problems resulting from liquefaction is the movement of the ground laterally and vertically in the vicinity of those facilities. However, liquefaction is not the only cause of ground movement during earthquakes. Relatively weak, sensitive clays can also lose strength during earthquakes, resulting in potentially large lateral ground movement that can have an impact on structures, walls, and roadway fills. Severe ground movements due to the presence of weak, sensitive clays were observed at 4 of the 32 sites (i.e., liquefaction was not the cause of the movements). There are still some cases of severe bridge damage or collapse among the 13 sites where neither liquefaction nor ground movement due to weak, sensitive clays appeared to have occurred. This damage was primarily due to structural weaknesses; though in many of those cases, performance problems may have worsened due to the presence of soft or loose soils.
Overall, the breakdown of observed geotechnical problems is as follows:
- Liquefaction: 15 sites (sites 15–22, 24–28, 30, and 31).
- Ground movement due to weak, sensitive clays: 4 sites (sites 7, 8, 10, and 12).
- Ground motion amplification likely but no ground movement due to liquefaction or weak, sensitive clays: 9 sites (sites 1–6, 11, 23, and 32).
The breakdown of the types of geotechnical issues and problems affecting the bridges visited is as follows:
- Excessive lateral dynamic foundation movements due to the presence of loose or soft soil resulting in structural damage or collapse (without liquefaction): Evidence was directly observable at 1 bridge site (site 8) but probably occurred at other bridge sites visited.
- Abutment fill settlement or lateral ground movement due to the presence of weak, sensitive clays: In all cases, it appeared that the lateral soil movement did not significantly impact the bridge (i.e., the bridge abutments did not move); 4 sites (sites 7, 8, 10, and 12).
- Abutment fill settlement or lateral ground movement due to liquefaction, but with minimal liquefaction-induced foundation settlement or ground failure-induced foundation lateral displacement and bridge damage: 8 bridge sites (sites 15, 16, 17 (southwest end), 18 (southwest end), 20, 21, 28, and 30).
- Bridge pier settlement or lateral movement due to liquefaction and ground failure resulting in significant bridge damage or collapse: 1 pier (wharf) and 10 bridge sites (sites 17 (northeast end), 18 (northeast end), 19, 21, 22, 24–27, and 31).
- Other geologic effects potentially impacting bridges, including regional ground uplift or subsidence and tsunami damage: 5 bridge sites (sites 20–22 for regional uplift and possibly others to a lesser degree, and sites 14 and 16 for tsunami).
5.2.1 Non-Liquefaction Geotechnical Issues Observed for Bridges
Bridge damage was generally more common in areas with poorer soils, resulting in greater amplification of ground motions. Bridges damaged in the Santiago area appeared to follow this pattern, with the heaviest damage observed in the western sector. As discussed in chapter 2, peak accelerations in the ground motions from the eastern side of Santiago were only one-third to one-half the peak accelerations measured in the western sector, based on the preliminary ground motion data available. This observation is similar to those summarized in GEER, not only for the Santiago area but also for other locations.(2) Depending on the variability of the soil profile below each bridge, the amount of amplification may have varied from bridge to bridge, even within a given bridge site. Furthermore, the extent of the damage depended on the bridge geometry, details used, and design code followed.
5.2.1.1 Bridge Sites 1–6, North and West Santiago
The bridges located on or in the vicinity of the northwestern portion of the Américo Vespucio, the beltway around the Santiago metro area, are examples of locations where ground motion amplification due to the presence of softer or looser soils was the primary geotechnical issue affecting the damage observed (see appendix A for boring logs that provide examples of subsurface conditions in the area). These include bridges at sites 1–6. Figure 92 and figure 93 show examples in which the superstructure was damaged or collapsed while the substructure was not significantly damaged. In these cases, weaknesses in the superstructure design (lack of shear restraint, inadequate bridge seat width, etc.) helped reduce dynamic stresses and damage in the substructure as the superstructure lost its connection to the substructure during the vigorous shaking.
The bridge design and details were similar for bridge sites 1–3. All of these bridges were likely supported on 4.9-ft (1.5-m)-diameter drilled shafts, with the exception of the footing-supported Lo Echevers bridges (see appendix A). Why some of these bridges suffered severe damage and others did not is unknown at this point, but it is possible that differences in soil conditions beneath these bridges may have resulted in different degrees of ground motion amplification and therefore differences in the observed bridge performance. That is, the stronger the ground motions at a site, the more likely that bridge damage occurred.
5.2.1.2 Bridge Sites 7–10, South Santiago
At the south end of the Santiago area, soft or loose to medium dense soils were present based on the available geologic maps and boring logs (see chapter 2 and appendix A). The boring log obtained at sites 7, 8, and 10 illustrate that the upper 38 to 58 ft (11 to 16 m) of soil consists of soft to stiff clays or loose to medium dense sandy silts and silty sands (AASHTO and NEHRP Site Class D or E), which would provide maximum amplification of ground motions, based on the AASHTO guidelines for seismic load and resistance factor design (LRFD).(14) However, this area is on the margin of a region with better soil conditions (granular medium-dense to dense soils), and therefore, subsurface conditions may be more varied, causing ground motion amplification and bridge performance to be more varied. In general, this applies to sites 7–12. For all of these bridges, the damage observed was primarily in the superstructure, with no apparent substructure damage. The foundations for the bridges at sites 7, 8, and 10 consisted of four 4.9 ft (1.5-m) diameter drilled shafts extending into the dense soil (about 36 to 98 ft (11 to 30 m) below roadway grade), based on as-built plans produced in 2000 and 2001 (see appendix A). Figure 185 shows an example in which the substructure was left intact with little or no damage. However, one of the foundations supporting one of the bridge abutments appears to be less vertical than would be expected, though no specific evidence of foundation damage (e.g., cracking) was observed. However, in one of the bridges (site 8, Avenida Chada overpass), dynamic lateral movement of the center pier shaft foundation had occurred (on the order of about 7.8 inches (200 mm)) and lateral foundation movement likely contributed to bridge superstructure damage (see figure 186). Figure 187 shows additional evidence that may point to the transverse rocking that occurred at the Avenida Chada overpass. The pavement crack shown in the figure is directly below the centerline of the bridge. While it is possible that the foundations supporting the bridges at all or most of the bridges at sites 1–10 exhibited significant lateral movement due to the presence of soft soils, it was not directly observable, except at site 8.
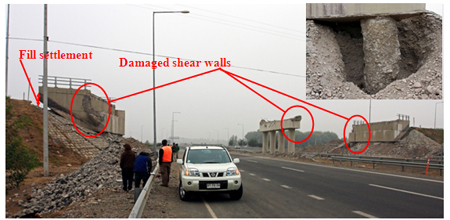
Figure 185. Photo. Damage at Romero bridge and shaft foundation supporting abutment (collapsed superstructure removed).
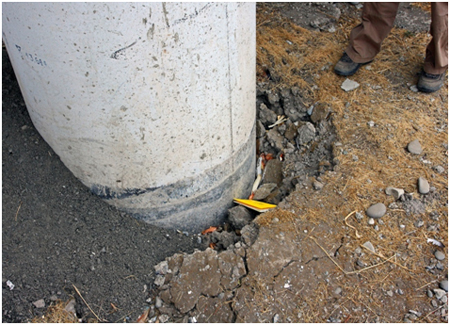
Figure 186. Photo. Interior pier of Chada structure with 5.8- to 7.8-inch (150- to 200-mm) gap in soil transverse to bridge centerline.
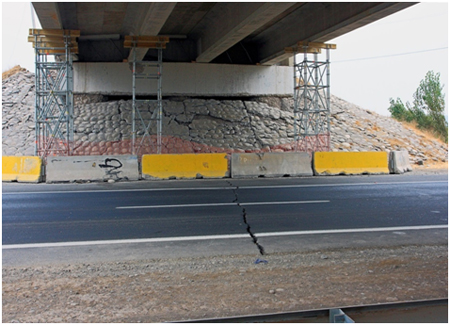
Figure 187. Photo. East abutment of Chada structure showing large pavement crack directly below bridge centerline.
Another problem that occurred at these bridge sites was settlement of the approach fills, where total approach fill settlement was on the order of 3 ft (1.0 m). However, for bridge sites 7 and 8, this settlement seems to be entirely from within the fill due to the fill slumping during shaking. The fill slumping did not appear to be caused by liquefaction. It is possible that during shaking, the base of the fill slid away from the embankment centerline due to some type of block failure, possibly at the boundary with relatively soft clay soils, allowing the embankment to slump. Figure 188 is a diagram of fill slumping, and figure 189 shows one of the actual abutment fills. The type of fill material used here and how well it was compacted is unknown.
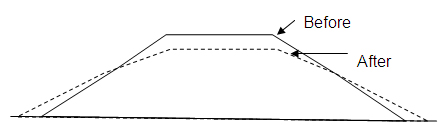
Figure 188. Illustration. Fill slumping observed for bridge sites 7 and 8.
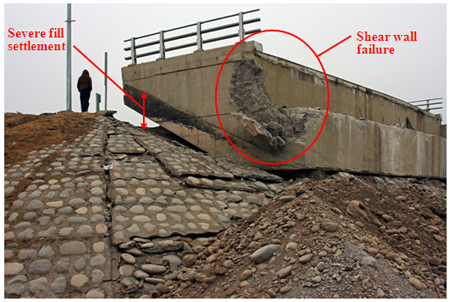
Figure 189. Photo. Fill slumping observed at Romero bridge.
Significant roadway fill settlement and lateral movement also occurred at bridge site 10 (see figure 190). However, the difference between this site and sites 7 and 8 is that at site 10, it appears the soil beneath the roadway embankment failed, possibly in bearing, though the failure appears to be fairly shallow. Lateral movements of over 7 ft (2 m) appear to have occurred, considering the distortion in the sign bridge, and uplift of the soil surface beyond the toes of the approach fill also appears to have occurred (see figure 191). Lateral movement of the fill and soil below the fill at site 10 is rather complex and will require further investigation to determine what really happened. However, based on the available boring log, the upper soils consist of weak and likely sensitive clays (see appendix A). These clays are probably the source of the fill stability problems observed at this site. In any case, the bridge abutment at site 10 appeared to be unaffected by the observed approach fill movement, although the superstructure for one of the bridges at this site collapsed.
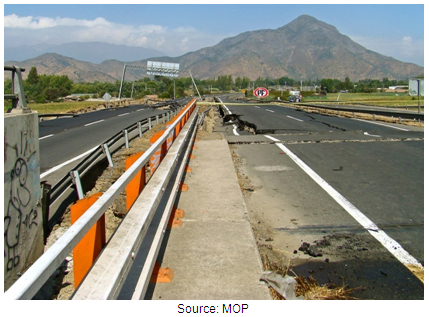
Figure 190. Photo. View of roadway fill failure from abutment of Route 5 railway crossing at Hospital.
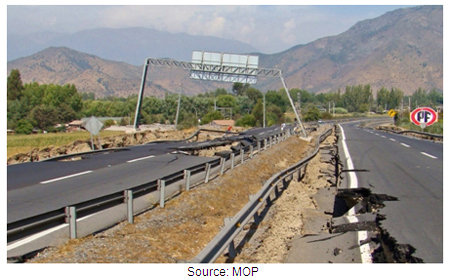
Figure 191. Photo. Close-up of approach fill failure and damaged sign bridge.
5.2.2 Liquefaction Impact on Performance of Bridge and Pier Structures
All of the following general conditions are necessary for liquefaction to occur:
- The presence of groundwater, resulting in a saturated or nearly saturated soil.
- Predominantly cohesionless soil that has the right gradation and composition. Liquefaction has occurred in soils ranging from low plasticity silts to gravels. Clean or silty sands and non-plastic silts are most susceptible to liquefaction.
- A sustained ground motion that is large enough and acts over a long enough period of time to develop excess pore-water pressure equal to the effective overburden stress, thereby significantly reducing effective stress and soil strength.
- Soil characterized by a density that is low enough for the soil to exhibit contractive behavior when sheared undrained under the initial effective overburden stress.(13,14)
Since detailed, site-specific subsurface data were not available for most of the sites visited, heavy reliance was placed upon visual surficial evidence that liquefaction had occurred to help interpret the structure performance observed. This section summarizes examples of those observations, how the liquefaction issue has been dealt with in the past, and the observed performance of various structures. That performance is interpreted with consideration of the local geology (and subsurface and ground water data if available), the likely extent of liquefaction, and the effect of the local topography on soil stability and deformation.
5.2.2.1 Signs of Liquefaction Observed
As previously mentioned, 15 of the bridge sites visited exhibited signs of liquefaction resulting from the offshore Maule earthquake. These liquefaction signs included lateral ground movement and cracking (i.e., lateral spreading or flow failure), ground settlement, and sand boils or otherwise ejected sand or silt in fissures. Structures at such sites tended to display the most damage and the poorest seismic performance due to the heavy demands such conditions placed on them, with a few notable exceptions. In some cases, surface expressions of liquefaction could not be directly observed (e.g., piers located in rivers), so liquefaction had to be inferred based on bridge performance observations such as settlement or tilted piers and columns that could be explained in no other way.
Examples of liquefaction signs and effects are provided in figure 192 through figure 199. Figure 192 shows lateral spreading that occurred at the Mataquito bridge site (site 15). Lateral movements of up to 7 to 8.2 ft (2 to 2.5 m) and vertical settlement of up to 3 ft (1 m) (average of 1.6 ft (0.5 m) across embankment near bridge abutment) appear to have occurred at the northeast end of the structure, involving the abutment fill and over 300 ft (100 m) of gently sloping ground to the river bank. However, as can be seen in figure 193, the lateral deformation directly beneath the bridge was less than the deformation just outside the edges of the bridge, indicating that the bridge foundations may have helped to restrain lateral movement of the soil. This also means that lateral soil loads may have been acting on the bridge foundations. Similar lateral spreading failures were observed at the opposite end of this bridge, although in that case, the abutment fill was not involved in the lateral spreading. Based on surface observations, it appears that these lateral spreading failures at the Mataquito bridge are relatively shallow in depth, probably on the order of 7 to 8.2 ft (2 to 2.5 m). A similar example of relatively shallow lateral spreading failure is provided in figure 194 for Ramadillas bridge (site 24), where the buildup of soil behind the bridge pier can be observed. Based on the pattern in the ground cracks, it appears that the soil was fluid enough to attempt to flow around the pier but was only partially successful in doing so.
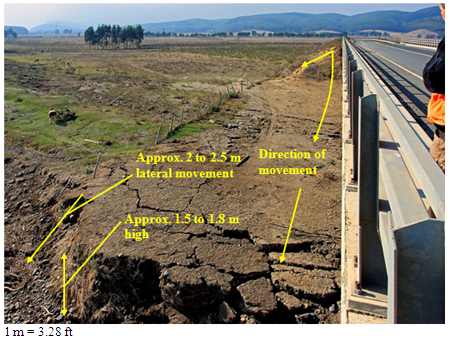
Figure 192. Photo. Lateral spreading at Mataquito bridge.
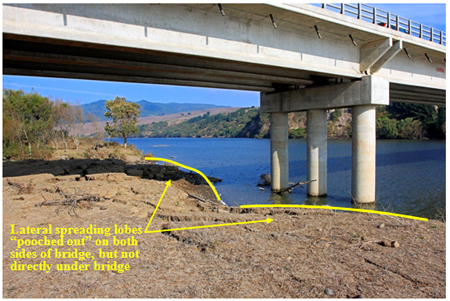
Figure 193. Photo. Lateral spreading at Mataquito bridge with lateral movement beneath and around bridge.
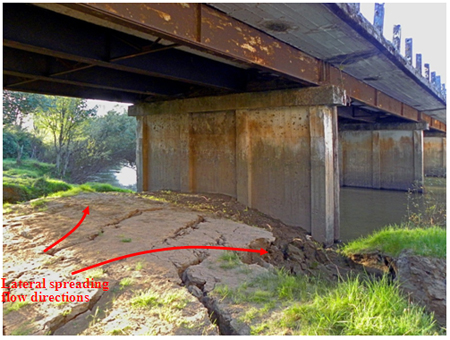
Figure 194. Photo. Lateral spreading and ground failure at old Ramadillas bridge.
Figure 195 and figure 196 provide examples of sand boils and ejected sand from ground fissures due to liquefaction. In figure 195, the southwest end of the Llacolen bridge, the ground water depth is relatively shallow (less than 3 to 7 ft (1 to 2 m)). In figure 196, La Mochita bridge, the ejection of sand through ground fissures due to elevated pore pressures from liquefaction appeared to be more vigorous, considering the greater depth to the water table (approximately 13 to 16 ft (4 to 5 m)).
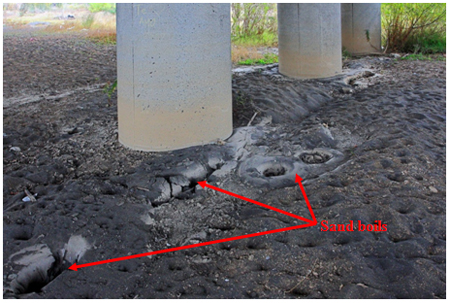
Figure 195. Photo. Sand boils at southwest end of Llacolen bridge.
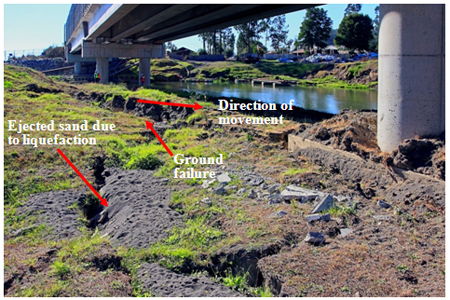
Figure 196. Photo. Ejected sand due to liquefaction and ground failure at La Mochita bridge.
Figure 197 and figure 198 provide examples of more severe ground failure caused by liquefaction. In these cases, the ground water needed for liquefaction was 7 to 16 ft (2 to 5 m) below the ground surface, and the remaining soil above that layer was non-liquefied crust. Due to the weakness of the liquefied soil, a slope failure ensued. This type of failure can cause the greatest damage to bridges due to the significant volume of stronger, heavier soil moving laterally into the bridge foundations and vertically along the foundations. Because the non liquefied crust is stronger than the liquefied soil, it is less able to flow around the foundations and is more likely to force the foundations to bear the full brunt of the lateral soil force.
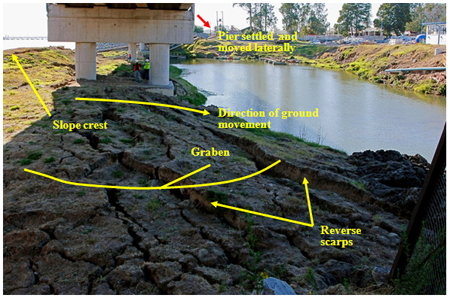
Figure 197. Photo. Severe ground failure at La Mochita bridge.
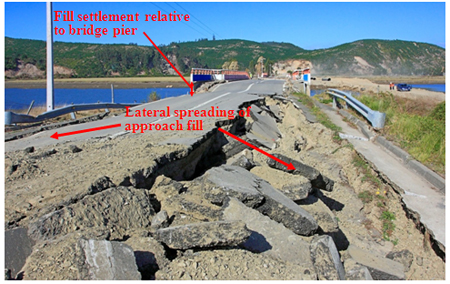
Figure 198. Photo. Lateral spreading and ground failure at Raqui 2 bridge.
Figure 199 shows an example in which a center pier in the middle of the river settled (about 1.9 to 3.1 inches (50 to 80 mm)), but, because of the water in the river, no specific evidence of liquefaction could be observed. It is likely that liquefaction is the cause of this kind of effect on the bridge, although it is also likely that the liquefied layer is not extensive because the amount of deformation in the foundation is relatively small.
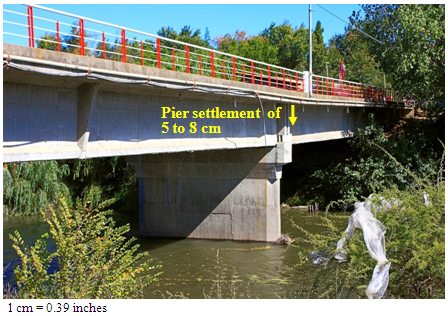
Figure 199. Photo. San Nicolás bridge center pier settlement probably due to liquefaction of soil layers beneath river.
5.2.2.2 Use and Performance of Ground Improvement to Mitigate Liquefaction Effects
According to engineers at MOP and Chilean universities, bridges and other transportation structures have historically not been designed to resist the effects of liquefaction. Until the 2010 offshore Maule earthquake, liquefaction had only been reported in limited areas of hydraulically placed fill, and the problems resulting from that liquefaction had been minimal. This was not the case for the Maule earthquake. Liquefaction problems were widespread and, in some cases, resulted in significant failures of structures and other facilities (see GEER for additional information).(2) The only ground improvement the team was made aware of to address liquefaction was deep dynamic compaction (DDC) conducted beneath some of the approach fills near the north end of the Juan Pablo II bridge in Concepción. Based on field observations at that site, the ground improvement was only partially successful, as shown in figure 200 and figure 201. DDC is generally not very effective for stabilizing deeper liquefaction in soils below the water table (i.e., water is virtually incompressible, and, in finer sandy or silty soils, the water does not have time to escape during DDC impacts, preventing reduction of pore volume). However, the specific limits of the DDC and the subsurface conditions are not known, so the apparent lack of success of the DDC cannot be fully investigated at this time.
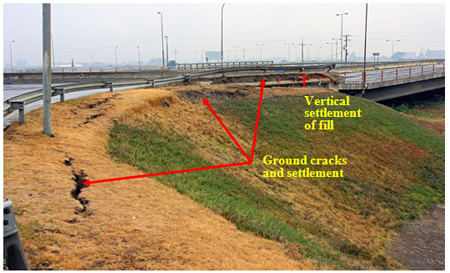
Figure 200. Photo. Ramps at Juan Pablo II bridge where existing ground was improved with DDC.
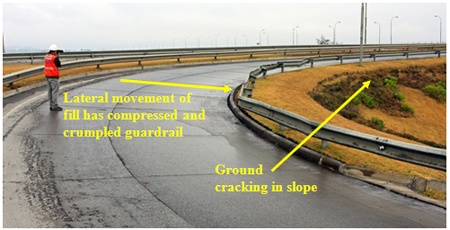
Figure 201. Photo. Lateral movement of fill in ramps at Juan Pablo II bridge.
5.2.2.3 Site-Specific Impacts of Liquefaction on Bridge Performance
Among the sites visited by TIRT, the impact of liquefaction on bridges and their approaches varied from no impact to structure collapse. The specific reasons why some bridges performed reasonably well despite signs of liquefaction cannot be determined without subsurface data to assess the depth of liquefaction and what should have been expected regarding settlement and lateral spreading or flow failure. However, it is possible to summarize the damage trends that are likely the result of liquefaction effects.
Liquefaction can result in vertical and lateral bridge foundation movements that exceed a bridge's ability to tolerate them as well as stresses in foundation and substructure elements that can result in component damage or failure. Liquefaction can reduce lateral soil stiffness (i.e., p-y curves), create downdrag loads on foundation elements due to liquefaction settlement, cause permanent lateral displacement of foundation and substructure elements, and increase lateral forces acting on foundation and substructure elements, which can cause the element to crack or fail. If ground improvement to prevent liquefaction is not conducted, the foundation elements must be designed to resist the loads placed on them due to liquefaction.
Specific descriptions of the effect liquefaction may have had on bridge performance for several of the sites visited are provided in the sections that follow.
5.2.2.3.1 Mataquito Bridge (Site 15): The Mataquito bridge provides an example of the performance impact caused by a relatively shallow lateral-spreading failure. In this case, the depth of lateral spreading appeared to be approximately 4.9 to 8.2 ft (1.5 to 2.5 m) based on the surficial expression of the soil movement. The bridge substructure/foundations were not significantly pushed laterally, and the affected bridge spans remained intact and functional. The Ramadillas bridge, though not discussed in detail here, provides a similar example of the effects of shallow lateral spreading (see figure 194).
For the Mataquito bridge, it appears that the abutment fill primarily moved parallel to and around the abutment wall rather than applying the full lateral force of the soil directly into the abutment. Ridging along the approach fill slope toe and longitudinal roadway pavement cracking appear to confirm that most of the soil movement was perpendicular to the roadway centerline (also identified in GEER).(2) Significant abutment fill settlement (approximately 1.6 to 3 ft (0.5 to 1 m)) also occurred, requiring some easily accomplished repair to the bridge approach fill (see figure 202 and figure 203). It also appeared that the soil was able to partially flow around the pier and foundation elements, possibly reducing the lateral loads enough that the foundations could resist them (see figure 192 and figure 193). As shown in figure 202 and figure 203, the bridge itself was virtually unaffected by the lateral spreading other than some minor abutment wall crushing where the abutment and bridge deck were shoved together either during shaking or as a result of very small lateral movement of the abutment. There was not enough movement or damage to affect bridge operation. Settlement of the soil around the interior piers was also observed (see figure 204) and appeared to be partly due to lateral spreading of the soil down slope as well as to possible deeper liquefaction-induced settlement that contributed only to downdrag forces on the foundations.
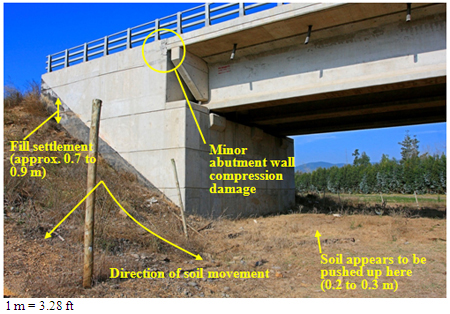
Figure 202. Photo. Soil settlement without bridge settlement at northeast abutment of Mataquito bridge.
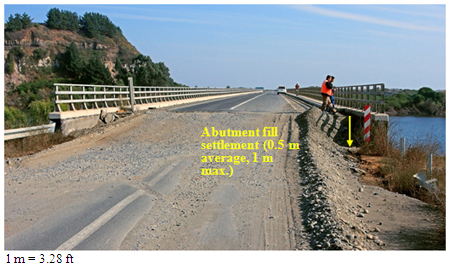
Figure 203. Photo. Lateral movement of fill in ramps at Juan Pablo II bridge.
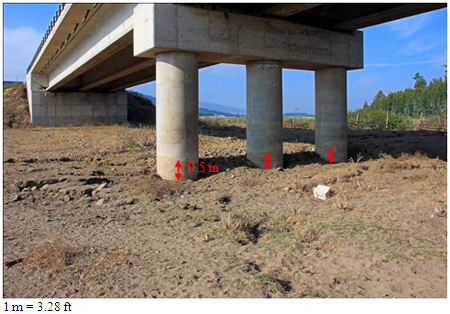
Figure 204. Photo. Soil settlement at interior pier at northeast abutment of Mataquito bridge.
Specific details regarding the foundations of the bridges were not available, but considering the recent construction date for the bridge (2007–2008) and the size of its columns, it is likely that the bridge was founded on drilled shafts (typical diameter of 4.9 ft (1.5 m)) that are deep enough to reach denser soil. This may explain why the bridge itself did not settle, but that hypothesis will need to be confirmed once bridge foundation details and soil subsurface information are available.
5.2.2.3.2 Raqui 1 bridge (Site 20): The Raqui 1 bridge is somewhat transitional with regard to the effects of liquefaction. The primary impact of liquefaction for this bridge was abutment fill settlement, though evidence of relatively minor lateral spreading below the abutment fills was present. Figure 205 shows approximately 3 ft (1 m) of fill settlement at the northwest abutment. The southeast abutment shows a similar amount of settlement. However, figure 206 shows that some lateral movement of the northwest abutment may have occurred (approximately 2.9 to 3.9 inches (75 to 100 mm)), severe enough to cause crushing of the abutment wall against the bridge girders and deck but not to shut down the bridge once the abutment approach fills were rebuilt to match the bridge deck elevation. A small concrete gravity wall adjacent to the abutment also displaced and tilted laterally down slope toward the river (see figure 206). It also appeared that more lateral movement occurred on one edge of the northwest abutment than on the other, indicating that some twisting of the abutment occurred. The abutment wall crushing could be partially due to strong shaking of the superstructure, forcing the bridge girders and deck into the abutment. However, the abutment wall crushing, signs of abutment fill displacement, twisting of the abutment, and lateral movement of the gravity wall adjacent to the abutment indicate that abutment movement toward the river occurred, likely due to liquefaction. It appeared that the southeast abutment did not move due to the liquefaction and lateral spreading. The difference in the liquefaction effects at the two abutments may be due to the presence of more gently sloping ground around the approach fill for the southeast abutment than for the northwest abutment (see figure 207). There was some evidence that the direction of slope movement was perpendicular to the roadway centerline, especially a few meters or more away from the abutment (see figure 208). However, since the approach fills had been restored to the bridge deck elevation before the team's arrival, some of the slope failure cracking and movement patterns had been covered by new fill. The age of the bridge, the subsurface conditions, and the foundation details were not available to TIRT. Therefore, additional investigation is needed to more accurately assess the bridge performance.
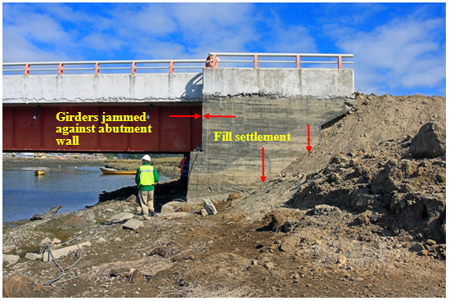
Figure 205. Photo. Abutment fill settlement at northwest abutment of Raqui 1 bridge.
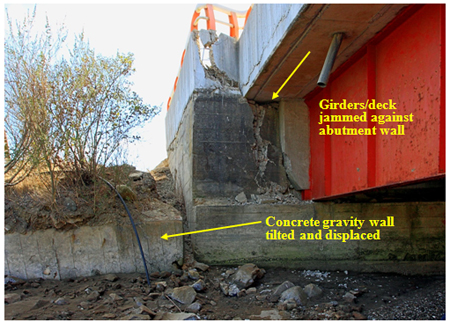
Figure 206. Photo. Abutment and girders shoved into each other and deck at the northwest abutment of the Raqui 1 bridge.
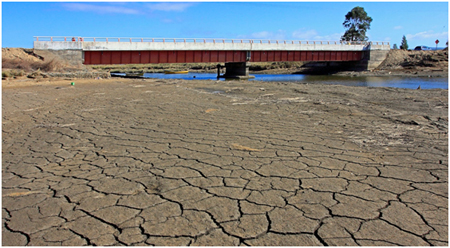
Figure 207. Photo. Raqui 1 bridge viewed from north side.
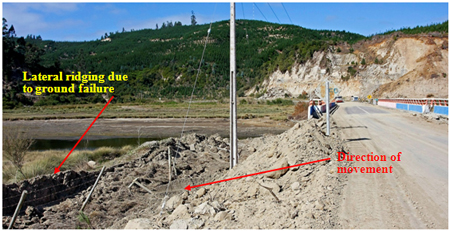
Figure 208. Photo. Evidence of ground failure perpendicular to roadway centerline at northwest approach of Raqui 1 bridge.
5.2.2.3.3 Llacolen Bridge (Site 17): Figure 195 illustrates another case where liquefaction obviously occurred (sand boils and evidence of minor lateral spreading). In this case, the southwest end of the Llacolen bridge, the liquefaction had very little impact on the bridge both in terms of foundation settlement and lateral movement of the foundations and abutment.
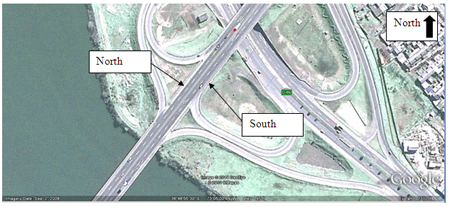
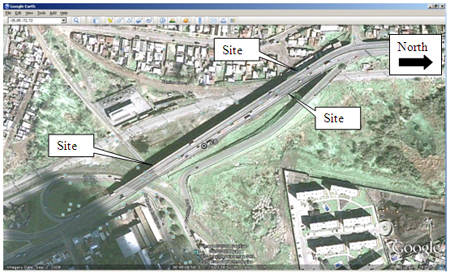
At the northeast end of the Llacolen bridge, the liquefaction impacts were far worse. The biggest problem for the Llacolen bridge, as well as for other Biobío River crossings and structures, was lateral movement of the foundations within the liquefaction-induced slope failure areas (see figure 209 for an overview of the river crossings and figure 210 through figure 213 for the Llacolen bridge). In general, most of the liquefaction-induced slope failure problems occurred along the northeast side of the river, where the river channel is incised more steeply. Very few liquefaction-induced problems occurred along the southwest side of the river even though there was clear evidence that liquefaction had occurred, probably due to the very flat ground conditions on that side of the river (see figure 195).
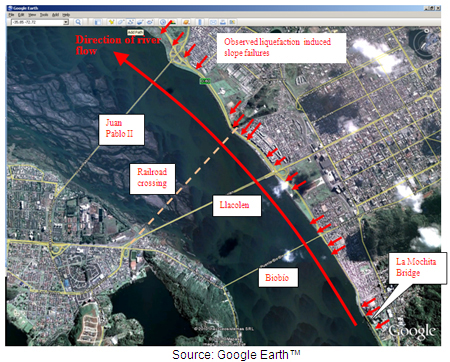
© Google, Inav/Geosistemas SRL, DMapas, and GeoEye
Figure 209. Map. Aerial view of Biobío River and crossings.
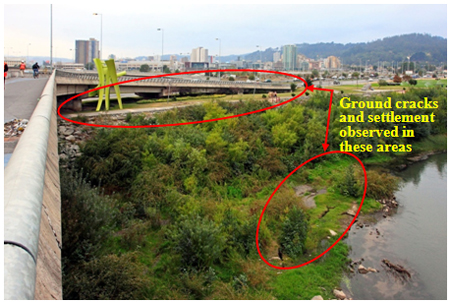
Figure 210. Photo. Evidence of slope instability due to liquefaction
at northeast abutment and approaches of Llacolen bridge.
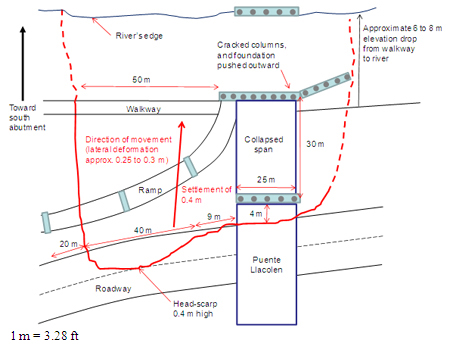
Figure 211. Illustration. Plan view of liquefaction-induced slide at northeast abutment of Llacolen bridge.
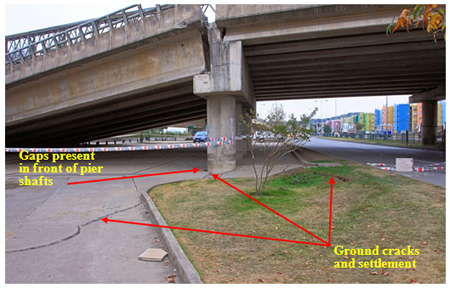
Figure 212. Photo. Settlement due to liquefaction-induced slope instability at northeast end of Llacolen bridge.
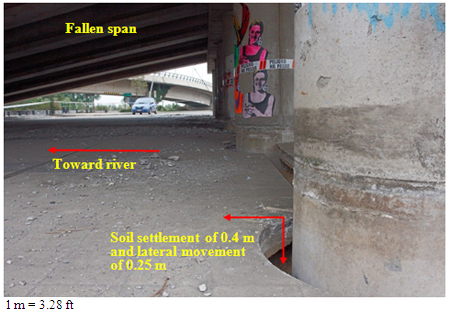
Figure 213. Photo. Settlement and lateral ground movement of interior pier at northeast end of Llacolen bridge.
At the northeast end of the Llacolen bridge, the liquefiable layer was probably near the river level. As the liquefiable layer weakened during shaking, the weight of the non-liquefiable soil caused the strength of the liquefied soil to be exceeded, resulting in a slope failure. As the soil moved laterally and downhill, it increased lateral stresses acting on the foundations, pushing them downhill and increasing bending stresses in the columns. The lateral movement caused a span to fall off its seat and collapse as well as excessive bending stresses to be placed on the pier columns, causing the columns to crack at a point of maximum stress in combination with weakness caused by a construction joint at that location. Similar observations and conclusions were made by the GEER team.(2) This happened for several of the columns shown in figure 214 and figure 215. It is not completely clear whether the columns cracked as a result of lateral movement of the slope caused by liquefaction or if once the pier moved and the span fell, the impact of the falling span on the ground immediately behind the cracked columns was the final effect that cracked the columns. In either case, the lateral ground movement significantly increased the lateral stress on the bridge foundations and columns.
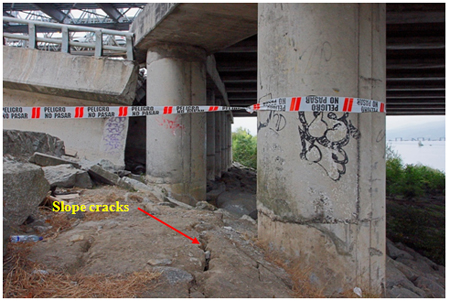
Figure 214. Photo. Settlement and lateral ground movement of interior pier at northeast end of Llacolen bridge.
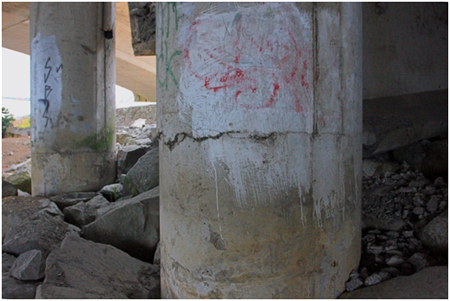
Figure 215. Photo. Settlement and lateral ground movement of interior pier at northeast end of Llacolen bridge.
The shaft foundations supporting the bridge were approximately 98 ft (30 m) deep and were probably bearing in dense soil. This kept the liquefaction settlement from dragging the foundations down, limiting the liquefaction impact to lateral movement of the foundations. This was not the case for the Juan Pablo II bridge, where shallower (59-ft (18-m)-deep) caisson foundations that probably did not bear on dense soil were used. Foundation settlement did occur for the Juan Pablo II bridge, though only at specific piers (see discussion in section 5.2.2.3.5).
Additional photos and details regarding the Llacolen bridge and the impacts of liquefaction on that bridge are provided in GEER.(2)
5.2.2.3.4 Chepe Railroad Bridge Over Biobío River (Site 18): A railroad bridge built in 1889 near and parallel to the Llacolen bridge also suffered damage to one of its piers due to lateral movement and settlement caused by liquefaction in the vicinity of the northeast river bank. It appeared that the 7-ft (2-m)-diameter steel pipe pile concrete-filled foundation and column displaced laterally about 2 ft (0.7 m) and that the ground around the foundation settled approximately 4.3 ft (1.3 m) (see figure 177). The roadway that this bridge crosses also settled approximately 4.3 ft (1.3 m) and moved laterally approximately 1.6 to 2 ft (0.5 to 0.7 m), though the wall top also rotated inward towards the roadway (see figure 216). The wall itself appeared to settle only about 1 to 1.3 ft (0.3 to 0.4 m). The roadway and walls formed a seal to keep groundwater out of the roadway (see chapter 4 for additional details). The liquefaction-caused settlement broke that seal, which will need to be repaired before the river level rises. Even with so much deformation, these structures did not collapse despite being seriously damaged.
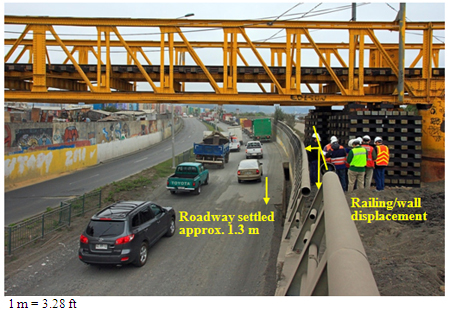
Figure 216. Photo. Wall settlement due to slope movement and instability caused by liquefaction at northwest end of Chepe railroad bridge.
5.2.2.3.5 Juan Pablo II Bridge (Site 25): Juan Pablo II bridge, another crossing of the Biobío River parallel to Llacolen bridge in Concepción, was built in 1973. This bridge was also impacted by liquefaction-induced slope failure as well as liquefaction-induced settlement and downdrag. The 1973 bridge foundations consisted of 59-ft (18-m)-deep hand-excavated caissons. Severe liquefaction-induced settlement of foundations occurred at several locations across the length of the bridge (1.6 ft (0.5 m) or more), but many of the piers exhibited no discernable settlement. Notably, a shaft-supported wall supporting fill between the approach bridge and the main river-crossing structure settled very little, whereas the bridge approach pier settled more than 3 ft (1 m), and the soil surrounding the end of the wall and the bridge pier also settled more than 3 ft (1 m) (see figure 217 and figure 218). This difference is likely due to differences in the two structures and the amount of load they carry. It was noted that the shaft-supported wall is much newer than the bridge ramp structure and therefore may be designed to more stringent standards, as it is unlikely that the soil would be so vastly different over such a short distance. Figure 219 through figure 221 show the bridge settlement.
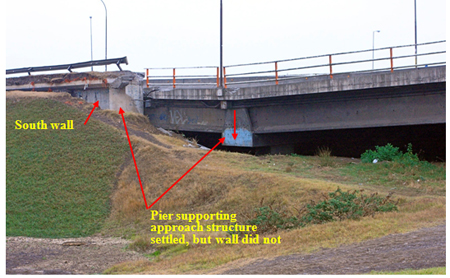
Figure 217. Photo. Settlement of approach structure for Juan Pablo II bridge.
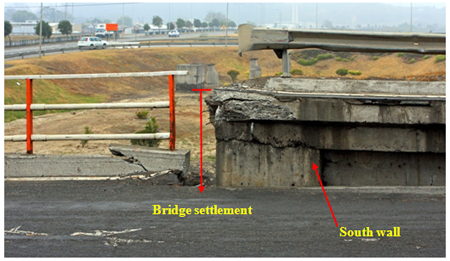
Figure 218. Photo. Close-up of settlement of approach structure for Juan Pablo II bridge.
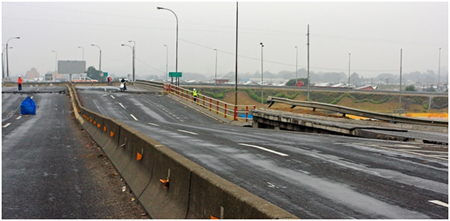
Figure 219. Photo. Roadway settlement due to settlement of approach structure pier foundations for Juan Pablo II bridge.
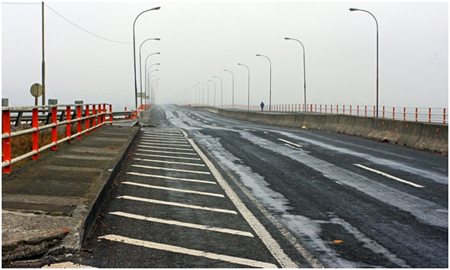
Figure 220. Photo. Roadway settlement due to settlement of mainline pier foundations for Juan Pablo II Bridge.
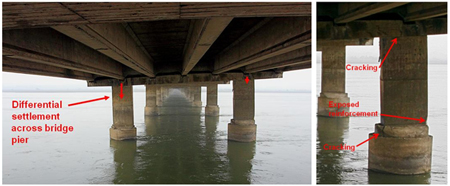
Figure 221. Photo. Liquefaction-induced differential settlement of mainline pier foundations supporting Juan Pablo II bridge.
The mainline Juan Pablo II Bridge abutment at the river bank suffered damage due to the lateral forces caused by liquefaction-induced slope instability. Figure 222 and figure 68 through figure 71 illustrate the damage that occurred. The damage to the column in figure 68 through figure 71 illustrates the severe bending stresses and lateral force to which the column was subjected when the northeast riverbank slope moved laterally due to loss of soil strength caused by liquefaction.
Although the bridge did not collapse due to these severe differential settlements and lateral slope movements, it was seriously damaged and efforts were already underway to design and build a replacement structure. Preparations for test hole drilling were being made during the TIRT visit.
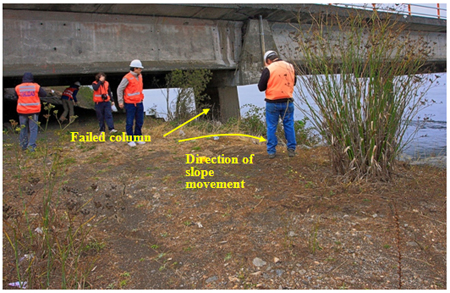
Figure 222. Photo. Damage to pier columns for mainline Juan Pablo II bridge.
Note that GEER also provided a detailed account of reconnaissance of this structure and the damage that occurred due to liquefaction impacts. Additional photos and measurements for that structure are provided in GEER's report.(2)
5.2.2.3.6 Old Biobío River Bridge (Site 26): The old Biobío River bridge was built in the 1920s, replaced in 1943, and no longer in service at the time of the earthquake. Spans and some of its substructure units collapsed in the earthquake, probably due to a combination of inadequate structural resistance and shallow foundations (see figure 138, figure 223, and figure 224). Various types of deep foundations were used in various sections of the bridge. It appeared that pile foundations were used for the northeast half of the bridge, although it was not clear if all the original timber pile foundations used to support the 1920s structure were replaced with steel pipe piles in the 1943 replacement structure. Therefore, the northeast portion of the bridge could be supported by both timber and steel pipe piles. Based on input from a Chilean consultant, the piers near the southwest end of the bridge appeared to be supported by twin shaft foundations or twin hand-dug oval caissons (33 to 39 ft (10 to 12 m) deep, although it is possible that the foundations were tipped in relatively dense soils). Scour problems and deep liquefaction or soft soils that allowed more foundation movement during shaking may have contributed to the weakening and collapse of the structure, though the specific role of liquefaction in this collapse cannot be confirmed until more subsurface data becomes available. However, ground failure and lateral soil movement were observed at the bridge abutment for this structure on the northeast bank of the Biobío River, and the abutment pier wall appeared to be tilted toward the river (see figure 137, figure 225, and figure 226).
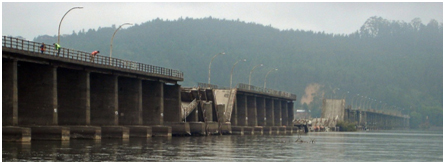
Figure 223. Photo. View of collapsed spans from northeast river bank of Biobío River.
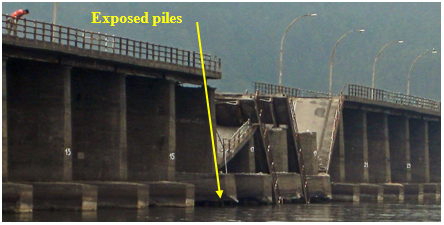
Figure 224. Photo. Close-up of old Biobío River bridge showing exposed pile foundations.
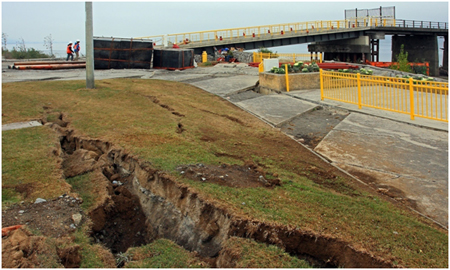
Figure 225. Photo. Ground failure near northeast abutment of old Biobío River bridge.
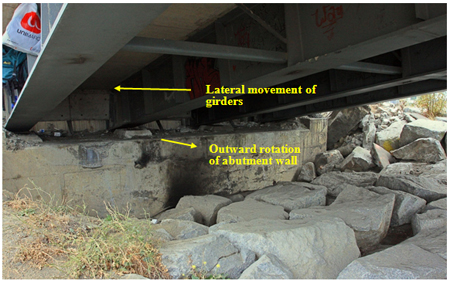
Figure 226. Photo. Tilting of northeast abutment pier wall of old Biobío River bridge.
5.2.2.3.7 La Mochita Bridge (Site 27): Significant ground failure due to liquefaction also occurred at the La Mochita bridge, located beside the Biobío River just south of the three Biobío River crossings. The north approach fill to this structure and the soil surrounding the interior piers exhibited the most severe ground failure. Figure 227 through figure 229 show examples of the north approach fill damage, and figure 196 and figure 197 show ground failure at the interior piers. The presence of ground water is a key ingredient for liquefaction to occur, and the ground water regime at this site was complicated by the presence of a dredging operation that pumped water from the river into a pit adjacent to the north approach fill, possibly raising the ground water levels in that approach fill (see figure 229). Seepage, possibly from water in the dredging spoils pit, was observed in the riverbank slope about 7 to 10 ft (2 to 3 m) above the river level in this area. This may have increased the severity of the ground failure observed in the north approach fill. However, the severity of the ground failure did not seem to be as great at the bridge abutment as it was 82–660 ft (25–200 m) north of the abutment (see figure 227 and figure 228). This may have been one of the reasons why the north bridge abutment was not significantly displaced due to this liquefaction-induced soil movement.
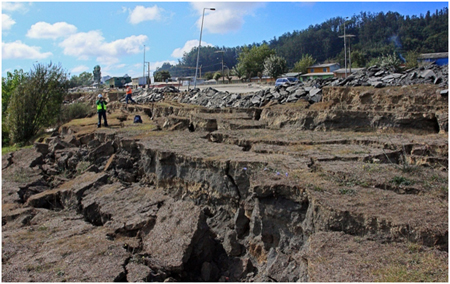
Figure 227. Photo. Ground failure of north approach fill for La Mochita bridge.
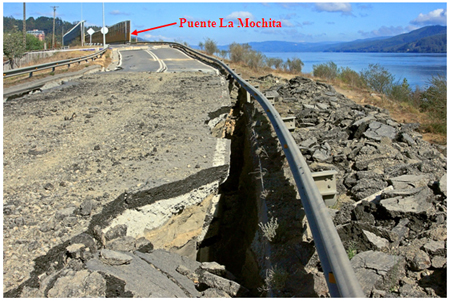
Figure 228. Photo. La Mochita bridge north approach fill liquefaction-induced ground failure.
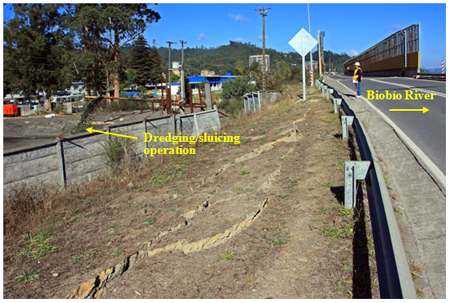
Figure 229. Photo. La Mochita bridge north approach fill and edge of dredging pit.
Ground failure due to liquefaction at the bridge location was most obvious at the interior piers (see figure 196 and figure 197). While it appeared that the direction of movement was generally eastward, away from the main river channel, the presence of reverse scarps and vertical movement of blocks of soil appeared to indicate the formation of a graben at and just west of the piers. This indicates that most of the ground movement at the interior piers was vertical with limited lateral movement. This may explain the relatively small lateral movement of the interior piers in spite of the apparently larger lateral slope movements. In any case, as can be seen in figure 197, the interior pier settled and tilted eastward, away from the river. The interior piers are believed to be supported on four 4.9-ft (1.5-m)-diameter drilled shafts, but this needs to be verified. Figure 230 shows the effect of the pier settlement on the elevation of the bridge deck.
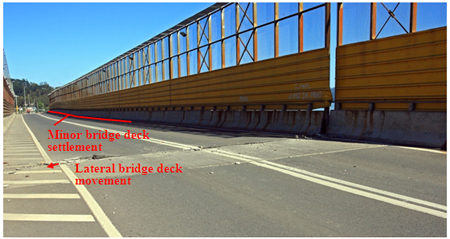
Figure 230. Photo. La Mochita bridge deck and girder lateral movement.
The bridge superstructure (girders and deck) also slid laterally toward the east up to 1 ft (0.3 m), with more movement at the south abutment than at the north abutment, possibly due to a combination of strong shaking and the tilting of the interior pier (see figure 230 through figure 232). It appeared that the abutments did not move. Note that one of the outside bridge girders almost slipped off the abutment seat (see figure 232). Overall, while the ground failure was significant (lots of movement with a thick non-liquefied crust), this bridge did not collapse. However, it was laterally displaced and suffered damage.
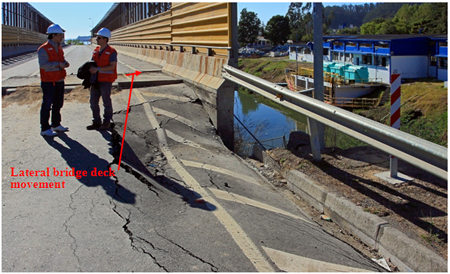
Figure 231. Photo. La Mochita bridge deck and girder lateral movement and approach fill settlement.
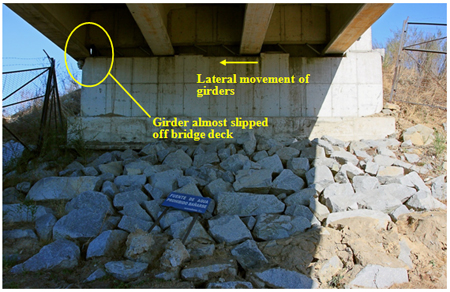
Figure 232. Photo. La Mochita bridge lateral bridge deck and girder at south abutment.
Additional observations and measurements regarding the ground failure and bridge movements, including photos, are provided in GEER. The overall conclusions made by GEER are consistent with the observations of TIRT.(2)
5.2.2.3.8 Raqui 2 and Tubul Bridges (Sites 21 and 22): Examples of severe bridge damage due to liquefaction combined with inadequate structural resistance include the Raqui 2 and Tubul bridges. For the Raqui 2 bridge, damage caused by liquefaction included severe failure and large-scale settlement of the approach fills (see figure 198 and figure 233) and collapse of the interior bridge spans resulting from movement and tilting of the interior pier foundations (see figure 234 and figure 235). It was not clear if the lateral displacement of the interior piers was due to some type of lateral soil movement or permanent displacement due to the combination of weak liquefied soils and lateral inertial forces induced by shaking of the bridge superstructure. Even though severe failure of the abutment fills occurred (likely due to liquefaction), it appeared that the abutments themselves did not move significantly. Based on the lateral ridging observed along the approach fill side slope toes and the roadway cracking pattern, it appeared that most of the lateral soil movement was in the direction perpendicular to the roadway centerline, which could explain why the abutments did not appear to have moved laterally.
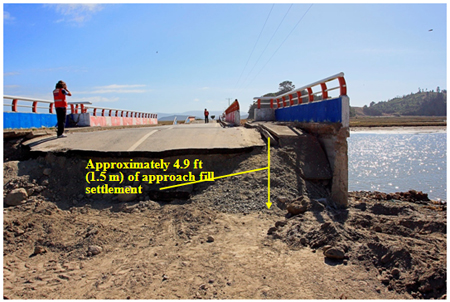
Figure 233. Photo. Southeast approach fill damage at Raqui 2 bridge.
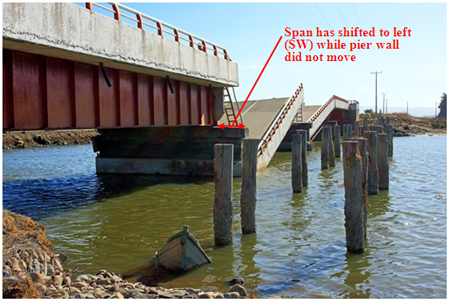
Figure 234. Photo. Collapsed and shifted spans at Raqui 2 bridge as viewed from base of southeast abutment.
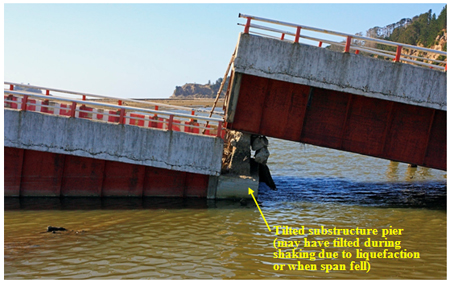
Figure 235. Photo. Collapsed and shifted spans at Raqui 2 bridge due to liquefaction.
Damage caused by liquefaction for the Tubul bridge was similar to that observed at the Raqui 2 bridge, though more lateral movement of the abutments due to lateral spreading forces appeared to have occurred. Ground cracking and deformation indicative of lateral spreading toward the river was observed at both ends of the bridge. Damage observed included liquefaction-induced ground failure, large-scale settlement of the approach fills (see figure 236 through figure 240), and shoving of the bridge girders approximately 5.9 inches (150 mm) into the north abutment, resulting in some crushing of the abutment wall at the girder locations (see figure 240 and figure 115). The south abutment pile cap was also damaged (see figure 239). It is possible that the north abutment was pushed into the girder to cause the abutment wall crushing. Alternatively, the girders supported by the interior piers could have been shoved into the north abutment due to a combination of lateral movement of the south abutment and strong shaking (see chapter 4).
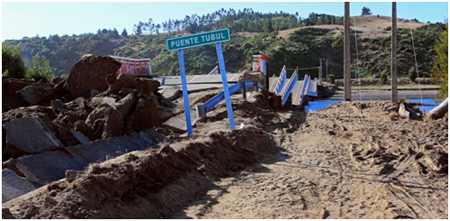
Figure 236. Photo. South approach fill damage and collapsed spans at Tubul Bridge.
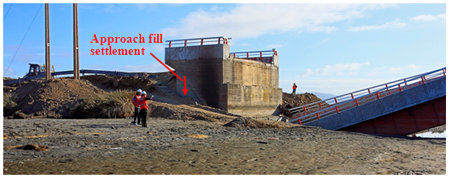
Figure 237. Photo. Settlement of fill beside the south abutment of Tubul bridge.
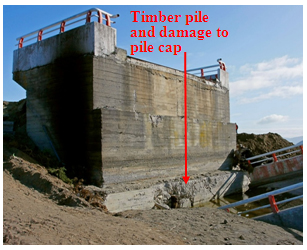
Figure 238. Photo. Overview of damage to south abutment of Tubul bridge.
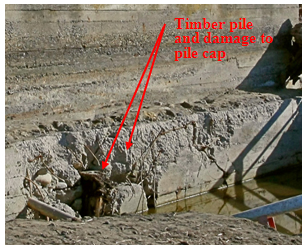
Figure 239. Photo. Close-up of exposed pile and pile cap damage on south abutment of Tubul bridge.
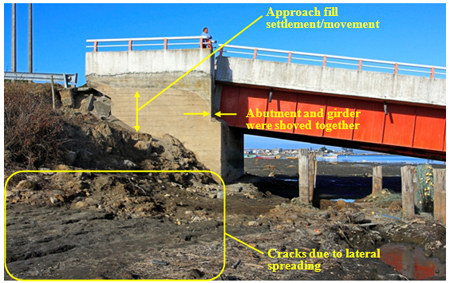
Figure 240. Photo. Overview of Tubul bridge north abutment.
The exposed pile cap of the Tubul bridge south abutment was obviously damaged, possibly due to lateral movement toward the north (see figure 239). It is not clear if the exposed timber pile was embedded in the pile cap as part of the abutment foundation or was a remnant of a foundation from an older bridge that ended up getting included in the pile cap when it was constructed. Specific foundation details for this bridge were not available, although it is likely that this bridge was supported on piles. In any case, it appears that the presence of the timber pile in combination with lateral movement of the abutment due to lateral spreading forces may have forced the exterior concrete pile cap to break and come loose. Additionally, the approach fill settlement and lateral movement appeared to be more severe at the south abutment than at the north abutment, providing further support that the collapse may have initiated at the south end of the bridge. Regarding the interior piers of the Tubul bridge, damage or collapse of the pier walls appeared to be the primary problem. The pile caps appeared to not have moved, at least in the lateral direction. However, some of the pile caps were not visible (they were under water or mud) and therefore could have settled or moved laterally (see figure 241).
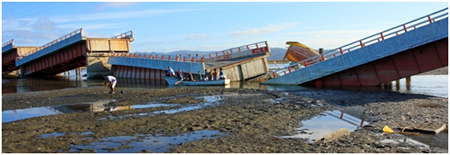
Figure 241. Photo. Tubul bridge collapsed spans and substructure.
The age of these bridges, the subsurface conditions, and the foundation details were not available to TIRT. Therefore, additional investigation is needed to more accurately assess the observed bridge performance.
5.2.2.3.9.Puerto de Coronel Muelle (Site 19): Deep liquefaction combined with lateral soil movement can cause severe foundation element bending. This was exemplified at the Puerto de Coronel Muelle, located south of Concepción but north of Arauco. The foundations supporting the pier (wharf) structure were pushed laterally and displaced (see figure 242 and figure 243). Since the foundations were deep (steel 28- to 40-inch (711 to 1,016 mm) open-ended pipe piles driven to a depth of approximately 160 ft (50 m)), the piles were probably fairly well fixed near the bottom. Based on the boring logs available, loose sands are present in the top 49 to 66 ft (15 to 20 m) below the ground surface. Therefore, liquefaction likely occurred to significant depth and contributed to the foundation displacements and degrees of bending observed. The yellow line in figure 243 traces the bending and twisting observed in the girder that was attached to the pile foundation. See GEER for additional details regarding the effect lateral spreading had on these and similar structures in the vicinity.(2)
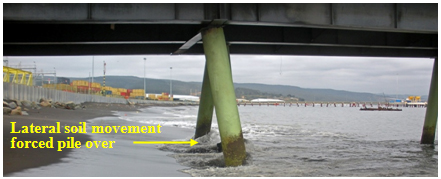
Figure 242. Photo. Puerto de Coronel Muelle foundation displacement and bending.
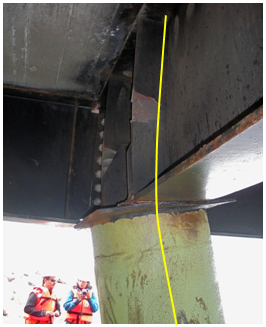
Figure 243. Photo. Close-up of Puerto de Coronel Muelle foundation displacement and bending.
5.2.2.4 Summary of Liquefaction Performance for Bridges and Other Structures: In summary, the primary effects of soil liquefaction on bridges and pier structures included foundation and approach fill settlement, loss of lateral foundation support, and lateral foundation movement due to lateral spreading and liquefaction-induced slope failure. Foundation settlement in particular was highly variable, ranging from 0 to 3 ft (0 to 1 m) or more, even for piers that were next to each other (e.g., Juan Pablo II bridge). Foundation settlement depends not only on the thickness of non-liquefiable crust (affecting downdrag unit friction on the foundations) and thickness of liquefiable soil (affecting magnitude of soil settlement) but also on the ability of the soil at the foundation tips to resist deformation and provide the needed bearing resistance. Note that even with such severe differential settlement, bridge collapse did not occur.
Lateral displacement of abutment walls and interior piers appeared to occur primarily when a significant crust of non-liquefied soil slid on top of a liquefied soil layer and when the slope was wide enough to significantly reduce or eliminate three-dimensional effects. Table 5 summarizes the approximate slope geometry and performance of bridge abutments and interior piers. The table entries are in general order of increasing severity of soil and structure movements and damage. The information in the table demonstrates that abutments that form the terminus of a long, narrow fill tend to be mostly unaffected by liquefaction and lateral ground movement, assuming that the abutment is supported by a reasonably robust foundation. In general, site observations confirmed that most of the soil movement was perpendicular to the roadway fill centerline and not directly into the abutment wall. Overall, bridge abutments did well in this earthquake, even when liquefaction and resulting ground settlement or failure was severe. However, where the bridge abutment, interior pier, or pier structure foundations were located on a broader slope such as would occur adjacent to a river or ocean waterfront, liquefaction-induced ground failure and lateral soil movements did result in lateral displacement or overstress and failure of the foundations and substructure. A possible reason for this difference in performance is the ability of the soil to either flow around the foundations or to otherwise follow the path of least resistance or greatest driving force. This depended on the thickness and fluidity of the failed soil mass and the slope and bridge geometry. The greatest driving force is likely to be in the direction where three-dimensional effects have the smallest influence and smallest contribution to the resistance to movement.
Table 5. Summary of performance for abutments and interior piers on slopes affected by liquefaction-induced ground movement or settlement.
Site No., Name, and Abutment/Pier Location |
Estimated Abutment
or Slope Height |
Estimated Ground Geometry
at Abutment/Pier Vicinity |
Observed Abutment/Pier
Deformation and Performance |
17. Llacolen bridge, SW abutment and land side piers |
1 to 2 m |
~ 3-degree slope (see figure 195) |
No movement or significant damage |
20. Raqui 1 bridge, SE abutment |
3.5 m |
Two-lane approach fill on gently sloping ground
(see figure 207) |
No movement/significant damage to abutment. 1 m of approach fill settlement and lateral spreading perpendicular to the roadway centerline. |
15. Mataquito bridge, both abutments |
7 to 8 m |
Gently sloping to river (~ 5 degrees) (see figure 192, figure 193, and figure 202 through figure 204) |
NE abutment shows minor crushing on abutment wall. If lateral movement occurred, it was less than 20 mm. SW abutment did not move |
27. La Mochita ridge, both abutments |
9 to 12 m transverse to abutment toward river |
Steeply sloping (~ 25 degrees) to river transverse to bridge abutment wall; rip-rapped ~ 25-degree slope below abutment to river-level north abutment and to 3 to 4 m high ridge below bridge centerline at south abutment (see figure 197 and figure 228 through figure 232). |
No abutment movement or significant damage; fill settlement at abutments varied from 0.3 m to 0.8 m. Lateral movement of approach fills perpendicular to roadway centerline. |
20. Raqui 1 bridge, NW abutment |
4 m |
Moderately sloping to river (~ 7-degree slope)
(see figure 207) |
Abutment fill settled about 1 m. Abutment may have moved laterally 75 to 100 mm and twisted. Small adjacent wall parallel to abutment wall tilted and moved laterally. |
27. La Mochita bridge, interior pier |
3 to 5 m |
Ground slopes perpendicular to bridge centerline and away from main river channel (see figure 197) |
Pier moved laterally about 100 to 150 mm, and vertically about 50 to 100 mm. Movement was down slope away from Biobío River main channel. |
19. Puerto de Coronel Muelle, pier on sloping shoreline |
4 to 5 m |
General slope toward ocean at ~ 10 degrees |
Pile foundations moved laterally down slope about 0.5 to 0.7 m. |
21. Raqui 2 bridge, both abutments and interior piers |
4 m |
Two lane approach fill on gently sloping ground (see figure 198, figure 233, and figure 234) |
No abutment movement but some minor damage, approach fill settlement up to 1.5 m, and lateral spreading perpendicular to the roadway centerline. Interior spans collapsed and piers tilted laterally. |
18. Chepe railroad bridge over Biobío River, NE river bank pier |
7 to 8 m |
Pier located at top of river bank; geometry is complex (see figure 176 and figure 216) |
Pier moved laterally 0.7 m; ground around pier settled 1.3 m. |
26. Old Biobío River bridge, NE abutment and interior piers |
6 to 7 m |
Abutment on river bank slope (~ 25 degrees) (see figure 225 and figure 226) |
Abutment wall tilted down slope about 150 mm. Direction of ground movement is toward river. Some interior piers collapsed. |
17. Llacolen bridge, pier on slope below NE abutment |
5 to 6 m at 20-degree slope, then less than 10 degrees with 2-m drop to river edge |
Ground slopes down to river (see figure 210 through figure 214) |
Pier on river bank moved laterally about 0.25 to 0.3 m and vertically about 0.3 to 0.4 m, causing columns to crack all the way through and approach span to move off bridge seat and collapse. |
22. Tubul bridge, north abutment and interior piers |
4.5 to 5 m |
Fill behind abutment extends out from edges of bridge (wider than needed for two lanes); slope is 25 to 30 degrees (estimated) then flattens to 10 degrees or less in short section to river (see figure 240) |
Abutment may have moved laterally about 150 mm, but it is also possible that girders were shoved into abutment due to a combination of pier wall failures, strong shaking, and lateral movement of south abutment. Approach fill settled over 1 m. Interior piers collapsed. |
22. Tubul bridge, south abutment |
5 m |
Two-lane approach fill on ~ 10‑degree sloping ground (see figure 236 through figure 240) |
Approach fill settled up to 1.5 m with lateral spreading primarily perpendicular to the roadway centerline, but turning toward river away from the abutment. Front of pier cap was damaged at timber pile location, possibly due to lateral abutment movement of 100 mm or more. Interior spans collapsed. |
25. Juan Pablo II bridge, pier on slope below NE abutment |
6 to 7 m |
Pier is located mid-slope; slope drops steeply to river (~ 30 degrees) (see figure 222 and figure 68 through figure 71) |
Pier column on river bank slope moved laterally 0.3 m or more and column failed, but span did not collapse. Interior piers suffered severe differential settlement of up to 1 m. |
1 m = 3.28 ft
1 mm = 0.039 inches
The current design philosophy in North America is to stabilize bridge abutments to prevent liquefaction, especially for the case of bridge abutments that form the terminus of relatively long approach fills not located on top of a broader slope (e.g., a riverbank). This design philosophy may be overly conservative and costly if large approach fill settlement can be tolerated for a no-collapse scenario. The approach fills can be simply and quickly rebuilt, as was done at several bridges observed by TIRT. It appeared that three-dimensional effects had a significant impact on the stability and movement of bridge abutments and piers subjected to liquefaction. Of course, these conclusions about liquefaction effects are preliminary until more subsurface and structure/slope geometry data are available and analyzed. The conclusions provided herein are based on surficial observations, limited information about the subsurface conditions, and limited or visually estimated ground slope geometry.
5.2.3 Effect of Regional Ground Uplift Observed for Bridges
As discussed in chapter 2, one result of subduction zone earthquakes is regional uplift and subsidence. The effects of regional uplift were especially prevalent south of Concepción, in the vicinity and south of Arauco, where regional uplift of approximately 7 ft (2 m) was observed. This especially affected harbors and waterways, leaving ships on sand and gravel bars. It also left beaches, estuaries, and wetlands without the water necessary to support plant and aquatic life. Fishing villages that had close access to navigable waterways lost access, requiring new access ways to be built.
Examples of the impact of rapid uplift are shown in figure 244 and figure 245. These figures show dry ground that was once wet and boats hung up on old timber pilings that were once almost fully submerged. However, the team was not able to confirm that these boats ended up on the pilings as the result of the earthquake. Figure 117 shows additional evidence of the pre-earthquake water level. One possible effect of the rapid uplift was to create rapid drawdown conditions, increasing the instability of sloping ground that was once partially or fully underwater. These remnant pore pressures could have combined with liquefaction effects to further decrease the stability of affected slopes, making them more likely to fail and to experience greater lateral deformations. This scenario needs further study once more subsurface data is obtained. The effect of rapid uplift on the bridge itself is unknown at this point. However, if the rapid uplift created the potential for differential movement between piers, the rapid uplift could have created additional problems for a bridge already in distress due to strong ground motions and liquefaction-induced forces or loss of foundation support. These near-fault effects need further consideration.
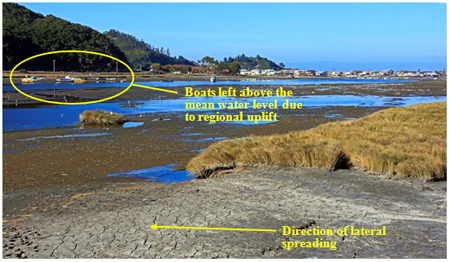
Figure 244. Photo. View northeast from Tubul bridge south abutment showing areas left dry and boats left above the new mean water level.
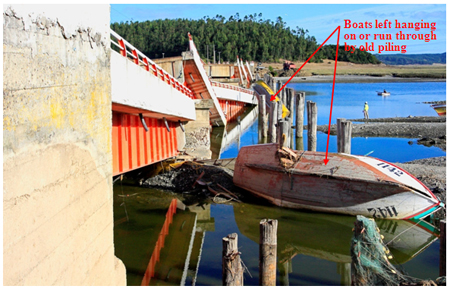
Figure 245. Photo. Tubul bridge with boats run through by old timber pilings.
5.3 GEOTECHNICAL OBSERVATIONS REGARDING RETAINING WALL PERFORMANCE
In general, walls have performed very well in past earthquakes. Examples include soil nail walls and mechanically stabilized earth (MSE) walls in the 1989 Loma Prieta earthquake in California, MSE walls in the 1994 Northridge, CA, earthquake, and MSE walls and modern reinforced concrete gravity walls the 1995 Kobe, Japan, earthquake. (See references 15–18.) Koeski, et al. provide a summary of the performance of various types of walls, focusing on geosynthetic reinforced structures, in these and more recent earthquakes.(19) The largest earthquakes have shown some differences in performance between relatively rigid walls such as concrete gravity walls and more flexible, MSE-type walls, with the MSE type structures tending to outperform the concrete gravity structures, especially older concrete gravity structures. While some damage to walls has occurred in past earthquakes, the damage has typically included minor movement (4 inches (100 mm) or less) or outward tipping of the wall, cracking of wall facing elements, wall corners or full-height joints opening up and allowing backfill to spill through, unsecured blocks at the wall top toppling off, and on rare occasions, collapse. Instances of wall collapse in past earthquakes were almost always limited to older walls that would not meet current design standards (especially unreinforced masonry and concrete walls) and, in a few cases, newer walls that were not designed to standards or were already in serious distress before the earthquake due to design or construction problems.
This section presents observations regarding the performance of retaining walls. Many of the 32 sites visited had bridge embankment approaches that were either sloped embankments or retaining walls. In addition, many sites used retaining walls to confine the soil under the bridge abutment. For the most part, the retaining walls observed consisted of either CIP concrete cantilever walls or MSE walls. The MSE walls observed were constructed of either precast panels with metallic reinforcement or dry cast modular blocks with geosynthetic reinforcement.
Traditionally, CIP walls have been used to confine the approach fill near a bridge abutment. MSE construction is a newer technology that has been used around the world since the 1960s as an alternative to CIP walls. The advantage of MSE walls include cost, rate of construction, and tolerance to settlement. In Chile, MSE walls have be used since 1995 (site 28 includes the first MSE walls built in Chile). The team observed a combination of CIP and MSE walls at many of the sites visited. In most cases, MSE walls were only used to retain the embankment approaches and not under the abutment. Under the abutment, CIP concrete walls were typically used. Table 6 lists the sites where retaining walls were observed and includes brief descriptions. Figure 246 through figure 260 show photos of each of the walls.
Table 6. Summary of sites with retaining walls.
Site No. |
Site Name |
Wall Description |
Wall Height (m) |
1 |
Américo Vespucio/
Miraflores |
MSE wall (steel reinforcement, precast panel faced) approaches with CIP abutment wall |
6 to 7 |
2 |
Américo Vespucio/
Lo Echeveres |
MSE wall (steel reinforcement, precast panel faced) approaches with CIP abutment wall |
6 to 7 |
3 |
14 de la Fama |
MSE wall (steel reinforcement, precast panel faced) approaches with CIP abutment wall |
6 to 7 |
5 |
Quilicura railway overcrossing |
CIP concrete abutment and approach walls |
5 to 6 |
6a |
Américo Vespucio/
Independencia eastbound |
MSE wall approaches with CIP abutment walls, both precast panel with steel reinforcement and modular block with geogrid reinforcement |
6 to 7 |
6b |
Américo Vespucio/
Independencia westbound |
CIP concrete back-to-back semi-gravity walls for approach ramps |
6 to 7 |
9 |
Maipú River bridge |
Concrete block gravity wall |
9 to 11+ |
11 |
Estribo Francisco Mostazal (Avenida Independencia) |
MSE (modular block and geogrid reinforcement) abutment walls. Walls directly support abutment loads from the bridge. |
6.5 to 7.5 |
18 |
Chepe railroad bridge over Biobío River |
CIP concrete wall supporting cut for depressed roadway |
5 |
21 |
Raqui 2 |
Approach ramps use CIP walls for the embankment and abutment |
4 |
25 |
Juan Pablo II |
Shaft-supported CIP walls retaining embankment fills |
2 to 3 |
28 |
21 de Mayo |
MSE wall (steel reinforcement, precast panel faced) approaches and CIP abutment walls |
8 to 10 |
29 |
Rotonda General Bonilla |
MSE wall (modular block face with geogrid reinforcement) approaches and CIP abutment wall |
4.5 to 5 |
32 |
Muros Talca (SW) |
MSE wall (modular block facing and geogrid reinforcement) approaches and CIP abutment wall |
8 to 9.5 |
1 m = 3.28 ft
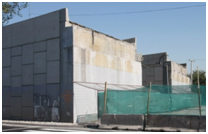
Figure 246. Photo. Retaining wall at Américo Vespucio/Miraflores.
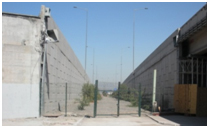
Figure 247. Photo. Retaining wall at Américo Vespucio/Lo Echevers.
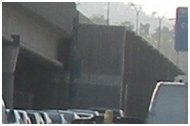
Figure 248. Photo. Retaining wall at 14 de la Fama.
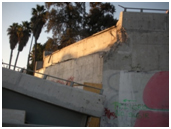
Figure 249. Photo. Retaining wall at Quilicura railroad overcrossing.
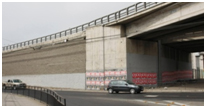
Figure 250. Photo. Retaining wall at Américo Vespucio/Independencia eastbound.
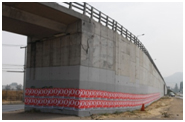
Figure 251. Photo. Retaining wall at Américo Vespucio/Independencia westbound.
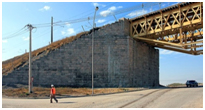
Figure 252. Photo. Retaining wall at Maipú River bridge.
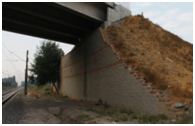
Figure 253. Photo. Retaining wall at Estribo Francisco Mostazal (Avenida Independencia).
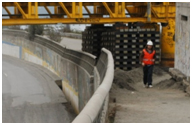
Figure 254. Photo. Retaining wall at Chepe railroad bridge over Biobío River.
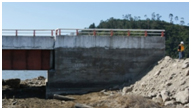
Figure 255. Photo. Retaining wall at Raqui 2.
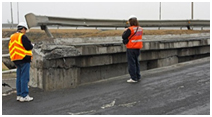
Figure 256. Photo. South retaining wall at Juan Pablo II.
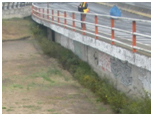
Figure 257. Photo. North retaining wall at Juan Pablo II.
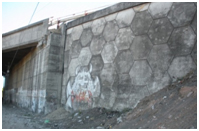
Figure 258. Photo. Retaining wall at 21 de Mayo.
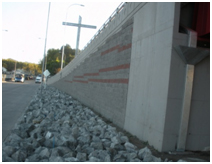
Figure 259. Photo. Retaining wall at Rotonda General Bonilla.
Figure 260. Photo. Retaining wall at Muros Talca (SW).
In general, all of the observed retaining walls performed well. There was little to no wall movement or damage, with the exception of sites 6, 18, 25, 28, and 32. Other than these sites, the wall facing, top-of-wall details, pavement, and other ancillary components showed no signs of distress due to the earthquake, even though some of the bridges associated with these walls experienced significant damage or even complete collapse of the superstructure. Although the retaining walls at sites 6, 18, 25, 28, and 32 experienced deformations or damage, they continued to perform their function of retaining soil and maintaining a grade separation. It is expected that these walls could be rehabilitated and placed back into service. A specific description of the problems observed at these five sites and their probable causes are provided in the paragraphs that follow.
The retaining walls at Américo Vespucio/Independencia (site 6) performed very well except for the detailing at the top of the modular block walls. The top two to three block layers and the cap block appeared to have been placed as a parapet above the ground surface at the wall top to hide a surface water drainage ditch (see figure 261). These blocks were unsupported and therefore only had self weight and the connection system to resist the horizontal loads. The horizontal force generated due to the earthquake and possibly from the concrete barrier behind the drainage ditch pushed the blocks and caused them to topple.
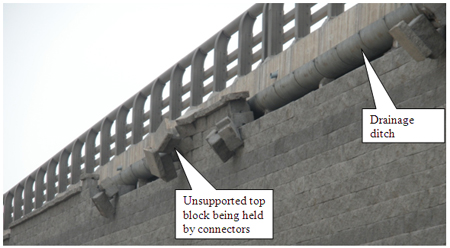
Figure 261. Photo. Toppling of coping at Américo Vespucio/Independencia.
The Chepe railroad bridge over the Biobío River (site 18) is a complex system, as shown in figure 176. A CIP cantilever wall supports a cut to form a depressed roadway. The ground water level is above the depressed roadway elevation at times, depending on the water level in the river. In effect, the roadway and walls in this section form a tub to keep the ground water out of the roadway. The soil below and behind the wall settled and moved toward the river, probably due to liquefaction-induced slope failure (see figure 262 and figure 263). This condition is consistent with observations at other sites along this side of the Biobío River. Due to the liquefaction-induced soil movement, the wall moved downward approximately 1 to 1.3 ft (0.3 to 0.4 m) and the top of wall rotated into the depressed roadway section. Furthermore, the seal between the roadway and wall was broken, which will allow water into the depressed roadway when the river rises.
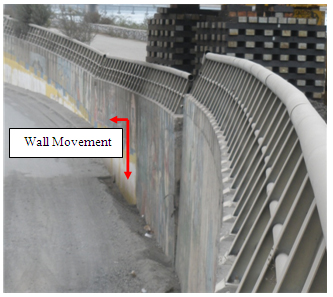
Figure 262. Photo. Wall movement near Chepe railroad bridge due to lateral spreading and settlement.
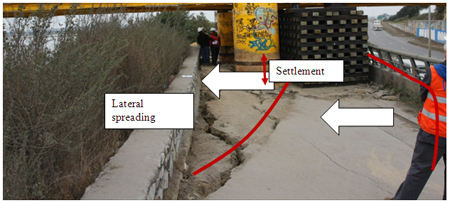
Figure 263. Photo. Wall settlement and rotation due to lateral spreading and settlement.
While the wall was in immediate need of repair, it is notable that the wall was still performing its function of retaining the soil from impacting the depressed roadway despite the severe movement caused by liquefaction. This demonstrates that even in the severe case of liquefaction below the wall, the wall can still function and not collapse. Note that the temporary support of the bridge superstructure placed after the earthquake may be contributing to the lateral loading of the wall. This indicates that even though the wall was damaged, it has some reserve capacity.
The approach for the Juan Pablo II bridge (site 25) was discussed in section 5.1 and illustrated in figure 217 through figure 219. In addition to bridge damage, there were two CIP walls retaining the embankment fill between bridge spans (identified as north and south walls in figure 256, figure 257, figure 264, and figure 265). The embankment between bridge spans settled due to liquefaction, and the bridge pier near the south wall also settled approximately 3 ft (1 m). The slopes in front of these walls moved laterally, likely due to liquefaction (see figure 200 and figure 201). It appears that the north wall and the embankment settled together more than 3 ft (1 m). Although the soil in front and behind the south wall settled, the wall itself did not settle because it was founded on deep foundations. This wall was built during a later construction project that added the entrance and exit ramps heading east. The north wall was completed in the original construction. Both walls continue to perform as intended after the earthquake, though the north wall would likely need to be replaced to raise the roadway back to its original grade.
© Google, GeoEye, and DMapas
Figure 264. Map. Retaining walls near Juan Pablo II bridge.
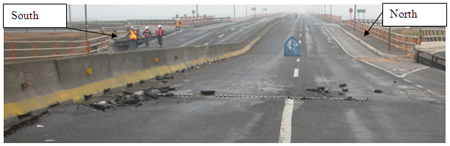
Figure 265. Photo. Wall settlement near Juan Pablo II bridge due to
liquefaction-induced settlement.
The retaining walls at Vía Elevada 21 de Mayo (site 28) are a combination of MSE walls used to retain approach and embankment fills and CIP concrete abutment and curtain walls. These walls were built in 1995 and are probably the first MSE walls built in Chile. These MSE walls were used as a substitute for CIP concrete walls included in the construction contract through a value engineering proposal made by the contractor prior to construction.
The MSE walls are composed of precast concrete panel facing and steel bar mat soil reinforcement. There are a total of five walls on this site, and with the exception of the wall corners and full height joints between the MSE walls and the curtain walls, they performed very well.
Three wall locations within Vía Elevada 21 de Mayo experienced deformation and are highlighted in this discussion (see figure 266). All three wall locations exhibited damage associated with wall top, full height joint, and corner details. Corner details for MSE walls are an issue because they tend to attract seismic loads and ensuring that the joint will stay together can be difficult. The performance issues were primarily with the joints opening up and fill escaping. Both bridges associated with the walls at this site also experienced damage but did not collapse. However, an older bridge parallel to these bridges did collapse.
© Google, GeoEye, DMapas, Inav/Geosistemas SRL, and Europa Technologies
Figure 266. Map. Vía Elevada 21 de Mayo.
Based on the design calculations available, the MSE walls at this site were designed using a horizontal acceleration coefficient of 0.4 g and were designed in general accordance with the AASHTO Standard Specifications available at that time. The high acceleration coefficient used to design these walls was a bit surprising because the official implementation of the 0.4 g ground acceleration for coastal areas did not occur until 2002. It is not known if the adjacent bridges were designed for 0.4 g. Based on the wall calculations, the soil reinforcement length used was approximately 90–100 percent of the wall height, likely the result of using a 0.4 g acceleration coefficient. The corner and full height joints where the walls connected to the bridge curtain walls were not designed as robustly for connectivity between adjacent panels as would typically be done today; this appears to have contributed to the performance problems observed.
Wall site 28A is a 30-ft (9-m) wall tiered perpendicular to the road alignment (see figure 267). The wall appears to have rotated out, allowing backfill to escape out of the reinforced fill at the full-height joint between the curtain wall and the MSE wall. Potential issues could be related to inadequate soil reinforcement embedment lengths or poor placement and compaction of fill due to the tight geometry caused by the presence of the wall corner, abutments, and foundation elements. The uniform rounded nature of the sand backfill used (a coefficient of uniformity of less than 2 based on available laboratory test data on the backfill) may also have contributed to reduced pullout resistance, especially during shaking. Based on eye-witness accounts of the wall construction in 1995, the backfill soil was extremely difficult to compact to a firm condition because of the uniform nature of the soil. Although tiered walls are aesthetically pleasing and can help reduce stress on the lower portion of the wall, the use of such complex wall geometry can lead to poor performance if not designed, detailed, and constructed correctly.
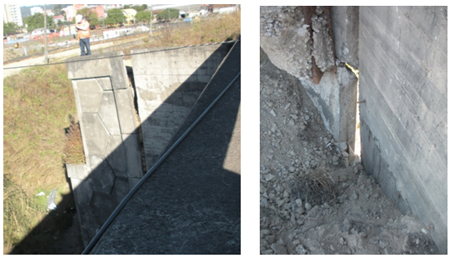
Figure 267. Photo. Tiered wall corner tilting outward at wall site 28A.
Wall site 28B, a 33-ft (10-m)-high wall, is similar to wall site 28A in that the wall rotated outward, although not as severely (see figure 268). The cause of the problem is also similar to wall site 28A, a combination of inadequate soil reinforcement embedment due to the severe bridge skew (the acute enclosed angle between the abutment wall and MSE wall is approximately 25 degrees) and the use of uniform rounded sand. The combination potentially resulted in reduced pullout resistance, especially near the wall top where soil confining stress is relatively low, and in lack of a positive connection at the full-height joint between the curtain wall and the MSE wall panels. Modern technique to design such acute corners is to create a bin structure, making sure that the soil reinforcement is tied across to both sides of the acute angle. Since that was apparently not done, the soil reinforcement near the acute corner was too short, allowing pullout failure to occur and the panels to move during the earthquake.
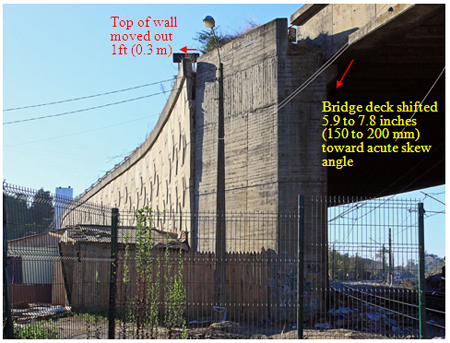
Figure 268. Photo. Wall corner tilting outward at wall site 28B.
The deformation at wall site 28C was the most severe of the three (see figure 269 through figure 272). Similar to wall site A, the wall is tiered, but instead of rotating, the lower wall slid and rotated, moving laterally outward near the lower wall top approximately 1 to 1.3 ft (0.3 to 0.4 m) (see figure 269) and possibly 0.49 to 0.7 ft (0.15 to 0.2 m) near the wall base (estimated based on tilt of wall face). This is the only wall observed by TIRT that exhibited signs of translational movement, with the exception of the wall at site 18 that moved laterally due to liquefaction-induced lateral spreading of the soil it retained. Because the upper tier was founded on the fill of the lower tier, the upper tier moved downward once the fill retained by the lower wall spilled out through the gap between the lower wall and the curtain wall. Figure 270 shows the back side of the upper wall, where the loss of the fill exposed the soil reinforcement behind the panels. The reinforcement, panel connection, and lack of geotextile between the MSE wall and curtain wall can be seen. The function of the geotextile is to prevent fill from escaping through the joint. In this case, the gap was probably too large for the geotextile to keep the fill from spilling. The geotextile was used at the panel-to-panel joints. The movement of the corner panels was observed at the other corners of these walls, although to a lesser degree.
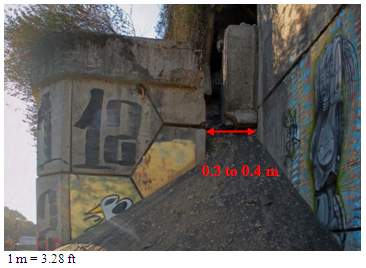
Figure 269. Photo. Lateral movement of lower wall top at wall site 28C.
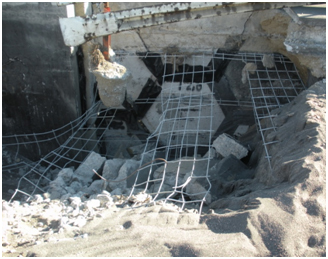
Figure 270. Photo. Back side of upper wall at wall site 28C.
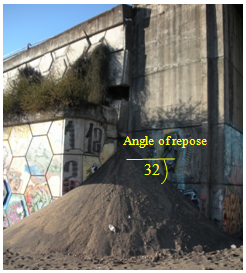
Figure 271. Photo. Fill material from tiered wall at wall site 28C.
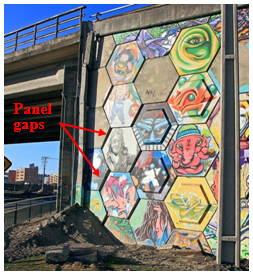
Figure 272. Photo. Differential settlement at wall site 28C.
As shown in figure 271, the fill was a uniform medium-coarse sand with an angle of repose of approximately 32 degrees. This type of material may have contributed to poor soil-structure interaction with the reinforcement. If this was not considered in the wall design, it may have caused a lower pullout resistance than anticipated.
Figure 272 shows the wall at the opposite abutment. In this case, the wall appears to have differentially settled, causing the panels to shift and separate and allowing some backfill soil to spill out.
The specific cause of the excessive lateral movement and differential settlement at this location may have been the liquefaction of the loose sandy soil below the wall. The available borings at the site indicate that the water table is approximately 7 ft (2 m) below the ground surface and loose, liquefiable sand extends to a depth of approximately 16 ft (5 m) (see appendix A). Soft organic silt extends another 3 to 7 ft (1 to 2 m) below the loose sand, below which the sands become dense to very dense. What appeared to be ejected sand (sand boils) was present near these walls as was some localized ground cracking and cracks in the roadway pavement, as shown in figure 273. With regard to lateral movement on the lower wall, the width of the reinforced soil zone (approaching 100 percent of the wall height) was likely more than adequate to resist the seismically induced lateral earth pressures behind the wall. Therefore, liquefaction is the most likely explanation for the lateral movement. During wall construction, 7.8 inches (200 mm) of settlement of the walls and fill occurred due to the loose sand and organic silt layer below the walls. Construction photos of the walls show what appear to be gaps in the panels that were likely caused by differential settlement that occurred during construction. However, it is also likely that liquefaction settlement below the wall may have worsened the panel distortion.
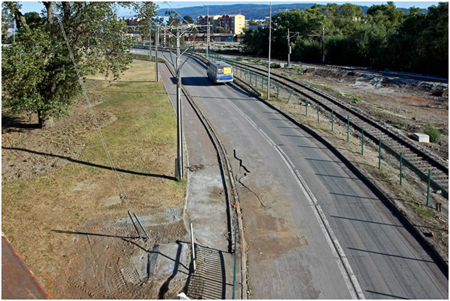
Figure 273. Photo. Possible liquefaction features near wall site 28C.
The Muros Talca site (site 32) consists of four geogrid reinforced modular block MSE walls approximately 30 ft (9 m) high with a 1.5H:1V to 2H:1V unreinforced slope on top. The MSE walls abut to a CIP concrete abutment wall. A plan view of the bridge and walls is provided in figure 274. The northeast corner wall experienced severe cracking of the facing blocks and an outward lateral deformation of approximately 4 inches (100 mm). The face block cracking pattern is shown in figure 275 and figure 276, with a linear distribution of the cracks on a 45 degree angle. The southwest corner also had some cracked blocks with a similar pattern but to a much lesser degree. This appears to be another example of a wall corner (or very tight radius in the wall alignment) having problems resisting seismic loading. The significant wall height, especially for a vertical wall, puts a lot of demand on the blocks even for static loading. Combining the wall height plus soil surcharge with a tight radius in the wall alignment and severe seismic loading caused a severe demand on the facing blocks. Some additional evaluation of this wall is needed to fully understand the effect that seismic loading had on this wall and the mode of facing failure. However, even though the wall facing was sheared by the demands placed on it, the wall did not collapse and is still functional, though facing repair will be needed.
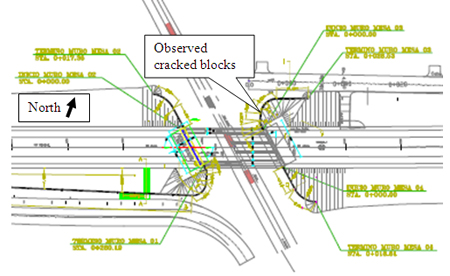
Figure 274. Illustration. Plan view of wall at Muros Talca.
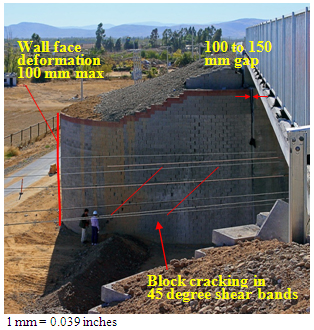
Figure 275. Photo. Wall with steep top slope at Muros Talca.
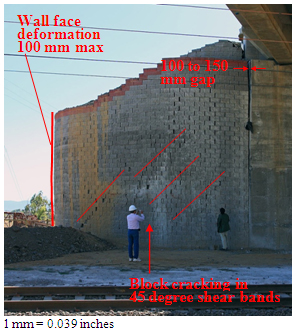
Figure 276. Photo. Wall with cracked block pattern at Muros Talca.
Finally, it should be noted that the wall at Estribo Francisco Mostazal (site 11) is a geogrid reinforced modular block wall directly supporting the abutment and bridge foundation loads (see table 6). This type of abutment wall is what is referred to as a "true" MSE bridge abutment. The MSE abutment walls at site 11 performed very well, exhibiting no signs of lateral or vertical movement due to the earthquake. While the bridge suffered some relatively minor damage (see figure 277), the damage was not caused by the walls but was probably due to the severe bridge skew angle (similar to other bridges observed by TIRT and described in chapter 4) combined with the bridge tending to slide down hill, as it was located on a downhill roadway grade.
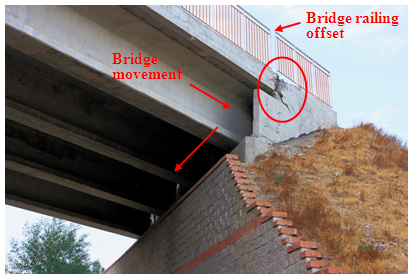
Figure 277. Photo. Bridge supported on footing on top of block-faced geogrid wall at Estribo Francisco Mostazal.
In summary, the walls observed at the 32 sites visited by TIRT performed well, although a few walls did suffer some damage. In most cases, damage was minor and repairable. Of the walls that deformed laterally, movement tended to be greatest near the wall top with little, if any, lateral movement at the wall base, indicating that resistance to sliding is likely much greater than assumed in design. The most significant wall performance problems were primarily the result of inadequate details at the corners and full-height joints and at the wall top due to inadequate coping details. These performance problems point to the importance of using details that ensure good connectivity between adjacent panels across a joint, which, for even current design codes such as the AASHTO LRFD bridge design specifications, should be better described. However, in spite of these performance problems, all of the walls met the no-collapse criterion typically applied for seismic design, including those walls that were subjected to the effects of liquefaction.
|


