Development and Field Testing of Multiple Deployment Model Pile (MDMP)
CHAPTER 7. ANALYSIS OF THE MDMP TEST RESULTS
7.8 Static-Cyclic Load Tests
A slow (pseudo-static) cyclic load test was performed following the completion of
the excess pore pressure dissipation process. All static load tests that were conducted during the dissipation process were performed as tension tests by pulling the MDMP upwards. The final load test, including the static-cyclic load tests, was performed as a compression test by pushing the pile downward. The displacement versus the loads recorded in all load cells and the net load on the friction sleeve are presented in Figures 96 and 97 for MDMP tests NB2 and NB3, respectively. The displacements presented in Figures 96 and 97 refer to measurements at the surface. The MDMP was at a fully extended slip joint position at the end of the tension test series. As such, the final load tests began by pushing the pile down until the slip joint was completely closed (a distance of approximately 50.8 mm (2 in)) and then the cyclic load test was carried out over an additional 25.4 mm (1 in) of penetration. During the movement along the initial 50.8 mm (2 in), before the slip joint was closed, the lower portion of the pile was not loaded and the measured loads reflected the friction developed along the upper part of the pile (1625.6 mm (64 in) long). After about 50.8 mm (2 in) of displacement (see Figures 96 and 97), the lower portion of the pile (1143 mm (45 in) long) was engaged and the measured loads reflected the friction along the entire pile and the tip resistance.
The shear transfer recorded during the final load
test of MDMP test NB2 was described in Tables 34 and 35. Table 34 details the discrete
load-displacement relationships at the various stages and Table 35 presents
average values. Tables 36 and 37
describe the respective information for the final load test for NB3. The observed behavior in Figures 96 and 97
was reasonable and is discussed in detail in section 6.5. The absolute measured values, however, were
in sharp contrast to the forces measured in the sequential pull-out tests
presented in Figures 58 and 61. The
peak forces along the friction sleeve in the final pull-out tests were
approximately 5.65 kN (1270 lb) and 5.43 kN (1220 lb) for MDMP tests NB2 and
NB3, respectively, whereas for the push tests, these forces were 2.61 kN (588
lb) and 1.17 kN (263 lb). No clear
explanation exists and although the reversal of the shear direction may be a
reason for some degradation, it cannot explain this large reduction.
Table 34. Shear Transfer Recorded During NB2 Final Load Test.
Event |
Displacement
(mm/in) |
Force Along the
Friction Sleeve (kN/lb) |
Peak After Initial Push |
3.0 / 0.12 |
2.61 / 588 |
Before Slip Joint Is Compressed |
51.5 / 2.03 |
1.72 / 387 |
After Slip Joint Is Compressed |
52.7 / 2.08 |
1.98 / 446 |
At End of Initial Push |
79.7 / 3.14 |
1.94 / 437 |
Peak After 2nd Push |
80.6 / 3.17 |
2.05 / 461 |
At End of 2nd Push |
98.4 / 3.88 |
1.54 / 347 |
Peak After 3rd Push |
98.8 / 3.89 |
1.81 / 407 |
At End of 3rd Push |
117.6 / 4.63 |
1.45 / 325 |
Peak After 4th Push |
117.8 /4.64 |
1.68 / 378 |
At End of 4th Push |
138.0 /5.44 |
1.41 / 317 |
Peak After 5th Push |
138.6 / 5.46 |
1.69 / 381 |
At End of 5th Push |
152.1 / 5.99 |
1.41 / 317 |
 |
Figure 96. Final Load Test for MDMP Test NB2. |
 |
Figure 97. Final Load Test for MDMP Test NB3. |
Table 35. Average Shear Transfer Recorded During NB2 Final Load Test.
Case |
Residual Force (kN/lb) |
Peak Force (kN/lb) |
average |
std. dev. |
average |
std. dev. |
All Events |
1.58 / 355 |
0.21 / 48 |
1.97 / 443 |
0.35 / 78 |
Without Slip Joint |
1.55 / 348 |
0.23 / 51 |
1.97 / 443 |
0.39 / 88 |
Excluding First Loading |
1.45 / 326 |
0.06 / 14 |
1.81 / 407 |
0.17 / 39 |
Table 36. Shear Transfer Recorded During NB3 Final Load Test.
Event |
Displacement
(mm/in) |
Force Along the
Friction Sleeve (kN/lb) |
Peak After Initial Push |
0.8 / 0.03 |
1.17 / 263 |
Before Slip Joint Is Compressed |
50.9 / 2.00 |
0.73 / 164 |
After Slip Joint Is Compressed |
51.9 / 2.04 |
1.06 / 238 |
At End of Initial Push |
76.8 / 3.03 |
0.64 / 144 |
Peak After 2nd Push |
77.1 / 3.03 |
1.00 / 225 |
At End of 2nd Push |
96.3 / 3.79 |
0.62 / 138 |
Peak After 3rd Push |
96.4 / 3.80 |
0.90 / 203 |
At End of 3rd Push |
109.6 / 4.31 |
0.58 / 129 |
Peak After 4th Push |
109.9 / 4.33 |
0.84 / 188 |
At End of 4th Push |
121.1 /4.77 |
0.60 / 135 |
Peak After 5th Push |
121.4 / 4.78 |
0.90 / 203 |
At End of 5th Push |
137.1 / 5.40 |
0.58 / 131 |
Table 37. Average Shear Transfer Recorded During NB3 Final Load Test.
Case |
Residual Force (kN/lb) |
Peak Force (kN/lb) |
average |
std. dev. |
average |
std. dev. |
All Events |
0.62 / 140 |
0.06 / 13 |
0.98 / 220 |
0.12 / 28 |
Without Slip Joint |
0.60 / 136 |
0.03 / 6 |
0.96 / 216 |
0.13 / 29 |
Excluding First Loading |
0.59 / 133 |
0.02 / 4 |
0.91 / 205 |
0.07 / 15 |
7.9 Shaft Resistance and Design Parameters
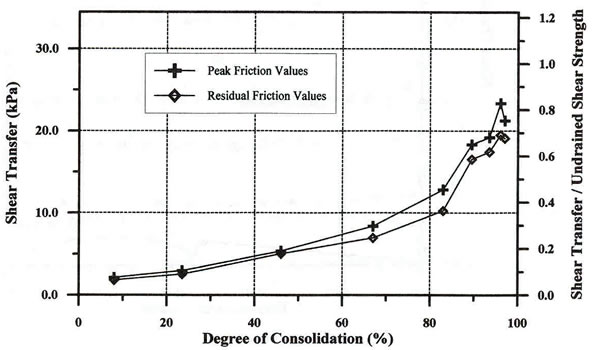
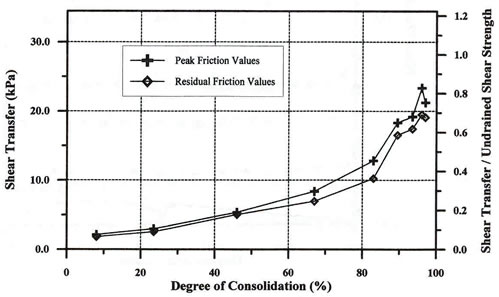
Figures 98 and 99 present the shear transfer along the friction
sleeve for MDMP tests NB2 and NB3, respectively. Both figures present the
build-up of the shear transfer with time, assuming that the actual shear took
place along the pile surface (see sections 6.3.2 and 6.3.3 for details). Figures
100 and 101 present the variation of the peak and residual shear transfer
as a function of the degree of consolidation for MDMP tests NB2 and NB3, respectively.
Figure 102 presents the evaluated undrained shear strength of the subsurface
based on various field and laboratory tests as presented by Paikowsky and
Chen (1998). The data in Figure 102 suggested that the undrained shear strength
of the clay reasonably ranged between the values proposed by the SHANSEP parameters
based on DSS tests and those obtained from the CPT. Using these values, the
undrained shear strength at the elevation of NB2 (-2.0 m) ranged between 23.0
kPa (0.24 tsf) and 33.5 kPa (0.35 tsf), and at the elevation of NB3 (-5.1
m) ranged between 19.2 kPa (0.20 tsf) and 37.3 kPa (0.39 tsf). The average
representative value for tests NB2 and NB3 was identical and equal to 28.2
kPa (0.30 tsf). This representative undrained shear strength was used for
normalizing the shear transfer measured along the shaft as shown on the left
vertical axes in Figures 100 and 101. The obtained ratio was typically denoted
by a, used in the design procedure known as the  method (Bowles, 1988 after Tomlinson, 1971) and was presented on the right
vertical axis in Figures 100 and 101. The maximum obtained ratio of approximately
0.8 generally agreed well with the reduction of the peak adhesion factor (p)
when considering high embedded length over diameter ratio (Tomlinson, 1986).
Tomlinson suggested the use of p
= 1.0 for a Cu/
method (Bowles, 1988 after Tomlinson, 1971) and was presented on the right
vertical axis in Figures 100 and 101. The maximum obtained ratio of approximately
0.8 generally agreed well with the reduction of the peak adhesion factor (p)
when considering high embedded length over diameter ratio (Tomlinson, 1986).
Tomlinson suggested the use of p
= 1.0 for a Cu/ sv'
of 0.2 to 0.35 and a reduction factor of 0.7 for an embedded length over width
ratio greater than 120 (equivalent to 9.1 m (30 ft) of penetration for the
MDMP). sv'
of 0.2 to 0.35 and a reduction factor of 0.7 for an embedded length over width
ratio greater than 120 (equivalent to 9.1 m (30 ft) of penetration for the
MDMP).
 |
Figure 98. Shear Transfer Along the Friction Sleeve for MDMP Test NB2. |
 |
Figure 99. Shear Transfer Along the Friction Sleeve for MDMP Test NB3. |
 |
| Figure 100. Shear Transfer Along the Friction Sleeve as a Function of the Degree Consolidation for MDMP Test NB2. |
 |
| Figure 101. Shear Transfer Along the Friction Sleeve as a Function of the Degree Consolidation for MDMP Test NB3. |
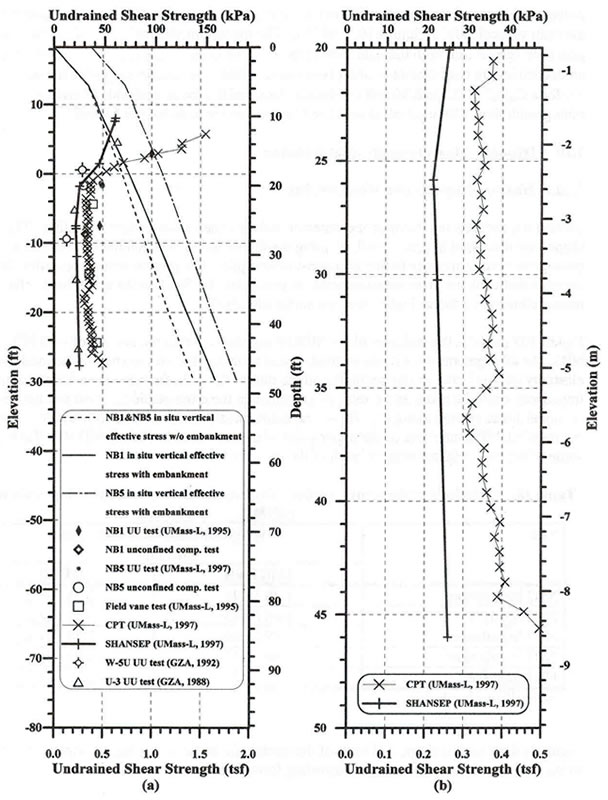 |
Figure 102. Undrained Shear Strength of the BBC at the Newbury Test Site: (a) Vairation With Depth Along With Results of Different Testing and (b) Details of CPT and SHANSEP Parameteres Between the Depts of 6.1 and 13.7 m (20 to 45 ft) (based on Paikowsky and Chen, 1998). |
|


