U.S. Department of Transportation
Federal Highway Administration
1200 New Jersey Avenue, SE
Washington, DC 20590
202-366-4000
Federal Highway Administration Research and Technology
Coordinating, Developing, and Delivering Highway Transportation Innovations
| TECHBRIEF |
| This techbrief is an archived publication and may contain dated technical, contact, and link information |
| Publication Number: FHWA-HRT-14-024 Date: December 2013 |
Publication Number: FHWA-HRT-14-024 Date: December 2013 |
PDF files can be viewed with the Acrobat® Reader®
FHWA Publication No.: FHWA-HRT-14-024 |
Currently, all State and local agencies responsible for the maintenance of suspension bridge cables base their maintenance plan mainly on previous experiences and on information from limited inspections. Usually, the exterior covering of the cable is visually inspected biannually. If deterioration problems are suspected and if the maintenance budget allows, then indepth inspections are conducted. The cable is then unwrapped at a few locations along the cable length and is wedged into its center. Next, a visual inspection of the wires’ conditions is performed, and in some cases, a few wires are cut and removed for laboratory testing.
Unfortunately, current visual inspections do not provide an adequate amount or sufficiently reliable data, indicating the need for innovative non-destructive testing (NDT) and sensing technologies that can provide an immediate, comprehensive, and reliable assessment of cable conditions and their evolution with time either directly or through measuring-related variables (i.e., temperature, humidity, etc.).
The objective of this research project was twofold: (1) to install a network of sensors that can monitor the internal environment of main cables and provide information that can be used to indirectly assess the cable’s deterioration conditions and their evolution over time (indirect sensing method and (2) to explore and possibly further develop the most recent and promising NDT technologies for direct detection of the corrosion damage inside main cables of suspension bridges (direct sensing method).
A complete literature review and a series of validation tests of the available corrosion monitoring techniques and sensors were conducted. The goal was to find out about the state of the art of the currently available sensor technologies, especially corrosion monitoring techniques, and to see whether these sensors/technologies could be applied to the monitoring of main cables in suspension bridges. The following sensors/technologies were considered worthy of further investigation:
The main lesson learned from the literature review was that no single means of corrosion detection (sensors or technologies) is ideal or suitable for assessing all possible forms of corrosion-induced damage. The key point is the peculiarity of the structural element (in this case, the cable) under consideration. For example, there are many sensors available on the market that can measure temperature and relative humidity, but only a few of those can be used in a bundle of over 10,000 steel wires subjected to strong compaction forces with difficult accessibility to the core. Hence, the sensor/technology selection must be performed as carefully as possible to avoid failure of the monitoring system in service.
Indirect Sensing Methods/Technologies
LPR Sensors
LPR sensors provide an estimate of the corrosion rate by measuring the polarization resistance of the sensor. The main advantages of these sensors are that they are small and flexible and can be easily inserted between wires. Nonetheless, particular care must be taken to protect the electrodes from direct contact with metal to prevent shortening the circuit. In this study, LPR sensors were extensively tested in a series of cyclic accelerated corrosion tests either alone or embedded in bundles of bridge wires.
CMASs
CMASs were chosen as a corrosion rate monitoring sensor due to their geometry (a cylinder with a similar diameter as a bridge wire so that it fits perfectly inside the wire bundle). These sensors are made of filaments of either steel or zinc, and each filament acts as either an anodic or a cathodic area. The filaments are externally connected by an instrument that is capable of measuring the electron flow and, subsequently, converting the flow into a non-uniform corrosion rate using Faraday’s Law.
BM or Galvanic Sensors
This type of sensor is basically a galvanic probe. For the sensors used in this study, the reference electrode was represented by a filament of copper, while the sensing electrode was a filament of either steel or zinc. In the presence of a corrosive environment, the current measured in the two electrodes is an indication of how much the sensing electrode is corroding under the polarized condition.
Temperature-Relative Humidity Sensors
Precon HS2000V humidity sensors were used in this study to measure temperature and relative humidity inside the main cable with an accuracy of ±2 percent. This sensor combines capacitive-polymer sensing technology with a novel measurement method, eliminating the need for temperature correction and calibration by the user. It covers a standard temperature range of 32 to 158 °F with a temperature output range of -22 to 212 °F and can operate within a humidity range of 0 to 100 percent.
Direct Sensing Methods/Technologies
AE
AE testing is a powerful method used for examining the behavior of materials deforming under stress. AE may be defined as a transient elastic wave generated by the rapid release of energy within a material when the local stresses around a discontinuity reach levels close to yielding. The high level of stresses can cause cracks to grow and fibers to break as well as many other modes of active damage in the stressed material.
MS
MS technology is based on a phenomenon in metals known as “magnetostriction” in which the presence of a magnetic field induces small changes to the physical dimensions of ferromagnetic materials and vice versa. When a pulse of electrical current is applied to a coil around a component of ferromagnetic material, a time-varying magnetic field is applied to the component, which in turn generates a pulse of elastic waves that propagates in both directions along the length of the component. Conversely, when the propagating elastic pulse reaches a receiving coil, it causes a change in the magnetic induction of the material via the inverse MS effect and consequently an electric voltage that can be amplified, conditioned, and processed. When damage occurs in a component, the propagating elastic waves are reflected back, and complex wave interference patterns arise, which can be analyzed to assess the location and amount of damage.
Combination of AE and MS Technologies
As part of the development of a corrosion condition detection system for suspension cable bridges, a study on the potential combination of the AE and MS technologies to detect wire breaks and consequent reduction of the cable’s cross section was performed. The principal idea behind the AE-MS is that a baseline measurement of the present state of the cable can first be established. Then, by interrogating the system periodically, any variation of the wave propagation characteristics of the system can be related to a certain type of damage. In this type of measurement, the MS generates an elastic wave that propagates along the cable, and its propagation characteristics are established by analyzing the response of the AE sensors to the propagating acoustic wave. If damage appears in the cable, the propagation characteristics of the cable change in the vicinity of the damaged area and thus the characteristics of the acoustic signal propagating along the cable. In this way, an array of AE passive sensors serves as continuous online monitoring detectors of wire brakes or other type of damage in combination with MS.
MMFM
MMFM is currently being used for the condition assessment of suspenders, but prior to this study, it had never been applied to a main cable of a suspension bridge. The fundamental principle of this technology is that when a steel wire, rope, or cable is longitudinally saturated by a strong magnetic field, the magnetic flux in the wire, rope, or cable is proportional to the wire’s, rope’s, or cable’s cross-sectional area. When a magnetic field moves along the length of the cable, then the measured variation of the magnetic flux at a given location may be correlated to the change in cross-sectional area at that location. In this study, this technology was successfully tested on the full-scale cable mockup. It is recommended to test such a technology on more deteriorated cables.
Full-Scale Cable Mockup
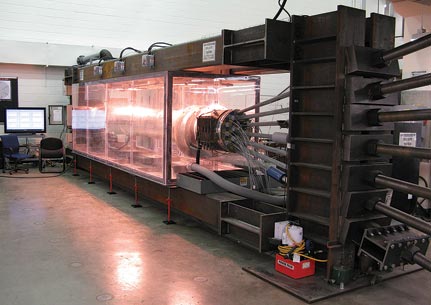
One of the main tasks was to evaluate the selected sensors and technologies on a full-scale cable specimen to recreate as closely as possible in-service conditions. To accomplish this objective, a 20-inch-diameter, 20-ft-long cable specimen was fabricated in the Carleton Laboratory at Columbia University. The setup consisted of a cable specimen made up of 73 127-wire hexagonal strands for a total of more than 9,000 0.196-inch-diameter steel wires. Of the 73 hexagonal strands, 7 were 35 ft long and were subjected to tension, while the remaining 66 strands, which were 20 ft long, were unloaded. This cable specimen was placed in a loading frame, and the long strands were subjected to a load so to induce stresses up to 100 ksi. The total length of the experimental setup was over 35 ft. An environmental chamber was built around the specimen (see figure 1), which was designed to expose the cable to controlled environmental conditions (i.e., simulated rain, heating, and cooling) to accelerate corrosion of the cable specimen, thereby assessing the functionality of the sensor network.

Figure 1. Photo. Cable specimen with environmental chamber.
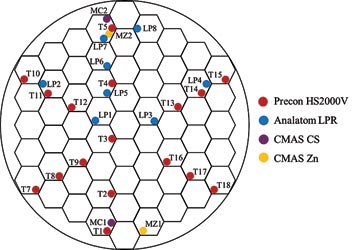
A total of 72 sensors were installed in the cross section of the cable. Figure 2 provides a schematic representation of the locations where sensors that successfully performed during the tests were placed. Sensors were placed along three diameters inclined at a 60-degree angle with respect to each other. Such distributions allow for measurements that are distributed along the radial direction in order to have a three-dimensional distribution of the variations of the various parameters (e.g., temperature, humidity, etc.). The sensors were hard wired, and the electrical wires were run out of the center of the cable at two vertical locations.

Note: CS = Carbon steel and Zn = Zinc.
Figure 2. Illustration. Schematic locations of sensors in cable mockup cross section.
After the cable mockup was built, a series of cyclic corrosion tests was performed to test the sensors in order to design the monitoring system for main cables of suspension bridges. These tests consisted of subjecting the cable specimen to cycles with varying durations of rain, heat, and cooling. Each experiment lasted for days. At the end of each test, data were analyzed, and changes of the test conditions were made if necessary. The total duration of this experimental phase lasted about 1 year.
Results from Accelerated Cyclic Tests
The data collected by the sensors during the entire environmental campaign were analyzed to assess the capability and reliability of the sensor monitoring system.
Temperature and Relative Humidity Sensors
The temperature measurements recorded by the Precon HS2000V sensors provided an accurate and reliable picture of the temperature distribution inside the cross section of the cable. The largest temperature increases and fluctuations were recorded in the outer level of the cable’s upper section because of the proximity of the sensors to the heat sources. The temperature variations within the cable’s cross section diminished moving further away from the heat source.
The interpretation of the relative humidity data was more complex because general trends were not as identifiable for the relative humidity data. This is because water can penetrate inside the cable from many different locations, spread between the wires, and reach the sensors at different times. However, it was found that relative humidity levels varied significantly across the mockup cable cross section, especially in the outer layers. Sensors located closer to the cable surface recorded elevated relative humidity levels, while those closer to the cable center recorded substantially lower levels.
Corrosion Rate Sensors
Some of the LPR sensors recorded corrosion rates above noise values, with a strong correlation with the corresponding temperature measurements. In fact, corrosion rate values recorded by LPR sensors appeared to follow distinct cyclic trends associated with temperature, while initial rate levels were affected by relative humidity. Similarly, the CMAS sensors identified cyclic fluctuations in corrosion rate readings as well as the fluctuations of the surrounding environmental variables.
The other sensors considered in this testing phase did not show the same sensitivity as those of the LPR and CMAS sensors. The recorded measurements were consistently below the noise threshold which could be due to either a reduced sensitivity of the sensor or to a lack of corrosion activity in the proximity of the sensor itself.
Analysis of Wire and Sensor Conditions
In an effort to directly determine the effects of cyclic corrosion testing, the cable mockup specimen was unloaded and disassembled. Once the wrapping was removed, a general inspection of the cable was performed. It appeared that the cable was heavily covered by a white powder, which was a mix of salt residue and zinc oxide. In a couple of spots along the length of the cable, small pockets of water were found. Heavy corrosion appeared where the wires exited the cable. The neoprene strap that served as a protection for the electric wires kept the wires in a wet environment for a long time (stage 4 uniform corrosion). Areas of high ferrous corrosion occurring underneath the stainless steel straps were easily identifiable in the south central location, whereas the north side of the cable seemed to have experienced little to no ferrous corrosion under the stainless steel straps. With regard to the conditions of the wires underneath the cable bands, they experienced various amounts of corrosion.
In the interior of the cable, the majority of the wires showed substantial salt deposits accompanied by deterioration of the zinc coating. Areas of salt deposition and zinc coating corrosion did not show any particular pattern and seemed to follow the potential path of the water that penetrated inside the wrapping.
With regard to the sensor conditions, almost all of the sensors appeared to have survived the cable compaction. Few corrosion rate sensors suffered extensive damage.
The last phase of the project called for the installation of the developed integrated system of sensors and technologies on a real cable of one suspension bridge in New York City. In agreement with the New York City Department of Transportation, cable D of the Manhattan Bridge was chosen. Built in 1912, this suspension bridge has 4 main cables, each made of 37 strands of 256 wires each for a total of 9,472 wires bundled in a cable with a 21-inch diameter.
The developed sensor system was installed on two 19.7-ft panels of cable D on the Brooklyn side span between panel points 13 and 15. The main cable was wedged at 4 groove positions along the circumference, and 38 sensors (19 per panel) were installed. The sensors were wired to a data acquisition system located at roadway level with wireless modem, which in turn transferred the data to a secured server. Once the sensors were installed, the cable grooves were closed, and the cable rewrapped with neoprene wrapping. The collection of data lasted for almost 11 months, after which all the sensors and the data acquisition system were removed.
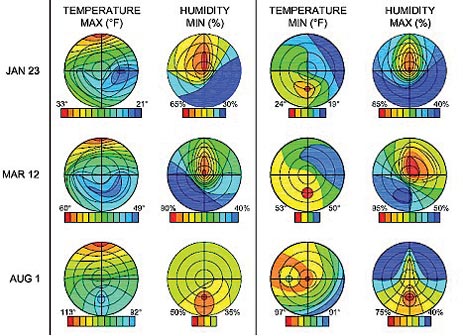
From the data analysis of the various sensor measurements, it appeared that all the sensors performed well and provided unique and valuable information. An example is provided in figure 3, where the distribution of the maximum and minimum daily temperature and relative humidity over the cable’s cross section are presented for different seasons.

Figure 3. Illustration. Distribution of temperature and relative humidity throughout the cable cross section during winter, spring, and summer.
The main conclusions of this research project include the following:
In conclusion, this study demonstrates that it is possible to measure corrosion activity inside the main cables of suspension bridges. The information provided by such a system can be used to make more reliable estimations of the safety factor and remaining service life of such important structural elements as well as to help bridge engineers in conducting more efficient and cost effective inspections.
Researchers—This study was performed by Columbia University, Parsons Transportation Group, and Physical Acoustics Corporation.
Distribution—This TechBrief is being distributed according to a standard distribution. Direct distribution is being made to the Divisions and Resource Center.
Availability—This TechBrief may be obtained from the FHWA Product-Distribution Center by email to report.center@dot.gov, fax to (814) 239-2156, phone to (814) 239-1160, or online at https://www.fhwa.dot.gov/research.
Key Words—Suspension bridge cable, Corrosion, Corrosion sensor, Acoustic emission, Main flux method, Magnetostriction, Remote monitoring.
Notice—This document is disseminated under the sponsorship of the U.S. Department of Transportation in the interest of information exchange. The U.S. Government assumes no liability for the use of the information contained in this document. The U.S. Government does not endorse products or manufacturers. Trademarks or manufacturers' names appear in this report only because they are considered essential to the objective of the document.
Quality Assurance Statement—FHWA provides high-quality information to serve Government, industry, and the public in a manner that promotes public understanding. Standards and policies are used to ensure and maximize the quality, objectivity, utility, and integrity of its information. FHWA periodically reviews quality issues and adjusts its programs and processes to ensure continuous quality improvement.