U.S. Department of Transportation
Federal Highway Administration
1200 New Jersey Avenue, SE
Washington, DC 20590
202-366-4000
Federal Highway Administration Research and Technology
Coordinating, Developing, and Delivering Highway Transportation Innovations
 |
| This report is an archived publication and may contain dated technical, contact, and link information |
|
Publication Number: FHWA-HRT-10-037
Date: October 2010 |
||||||||||||||||||||||||||||||||||||||||||||||||||||||||||||||||||||||||||||||||||||||||||||||||||||||||||||||||||||||||||||||||||||||||||||||||||||||||||||||||||||||||||||||||||||||||||||||||||||||||||||||||||||||||||||||||||||||||||||||||||||||||||||||||||||||||||||||||||||||||||||||||||||||||||||||||||||||||||||||||||||||||||||||||||||||||||||||||||||||||||||||||||||||||||||||||||||||||||||||||||||||||||||||||||||||||||||||||||||||||||||||||||||||||||||||||||||||||||||||||||||||||||||||||||||||||||||||||||||||||||||||||||||||||||||||||||||||||||||||||||||||||||||||||||||||||||||||||||||||||||||||||||||||||||||||||||||||||||||||||||||||||||||||||||||||||||||||||||||||||||||||||||||||||||||||||||||||||||||||||||||||||||||||||||||||||||||
Step Frequency Ground Penetrating Radar Characterization and Federal Evaluation TestsAppendix E: Certified Laboratory Test Report: Follow-up TestThe following certified laboratory test report contains supporting documentation and results of the testing performed for the research initiative in this report. The authors of this current study have not edited or changed the test report in this appendix except to remove more than one instance of company logo within the document and to format the report.
Test report no. :133876/2 Item tested : B1823CH Type of equipment : 3d-radar Geoscope Client : 3d-Radar AS Nemko is granted accreditation byNorwegian Accreditation under registration number TEST 033. FCC test firm registration # 994405 Federal Highway Administration/Department of Transportation Step Frequency Ground Penetrating Radar Characterization and federal Compliance Tests
2009-10-27
Authorized by : .............................................. Geir Antonsen Technical Verificator Contents
5. TEST EQUIPMENT AND ANCILLARIES USED FOR TESTS 6. PHOTO OF EUT AND TEST SET UP GENERAL INFORMATIONTesthouse InfoName: Nemko A/S Address: Nemko Kjeller Telephone: +47 64 84 57 00 Fax: +47 64 84 57 05 E-mail: comlab@nemko.com FCC test firm registration #: 994405 Number of Pages: 93 Client InformationAddress: KlÂ: buveien 196 B, N-7037 Trondheim, Norway Telephone: + 47 72 89 32 02 E-mail egil@3d-radar.com Contact: Name: Egil Eide Phone: + 47 72 89 32 02 E-mail: egil@3d-radar.com Manufacturer (if other than client)Name: Address: Telephone: Fax: Contact: Name: Phone: E-mail: TEST INFORFMATIONTested Item
Description of Tested Device(s) Step frequency Geo Radar. Test EnvironmentNormal test condition at the test sites
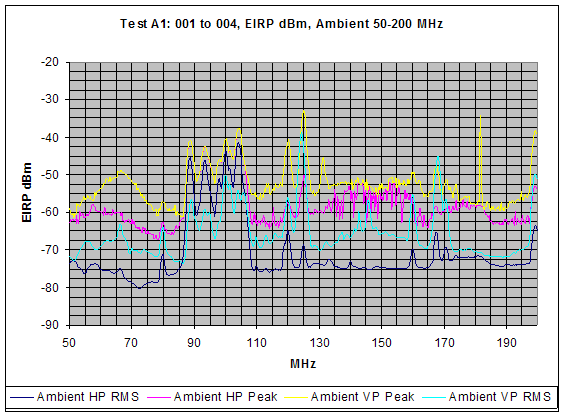
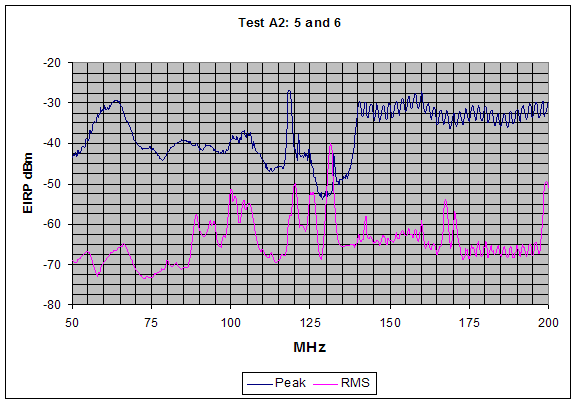
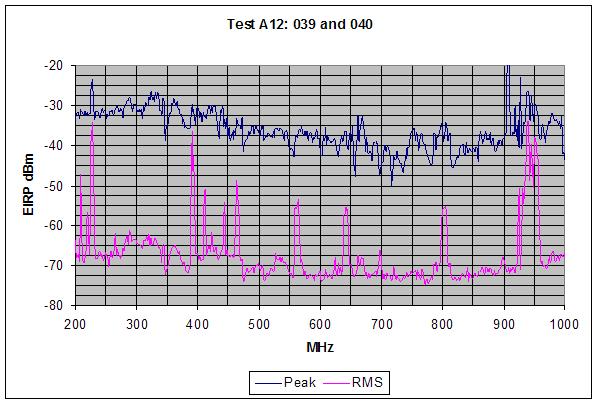
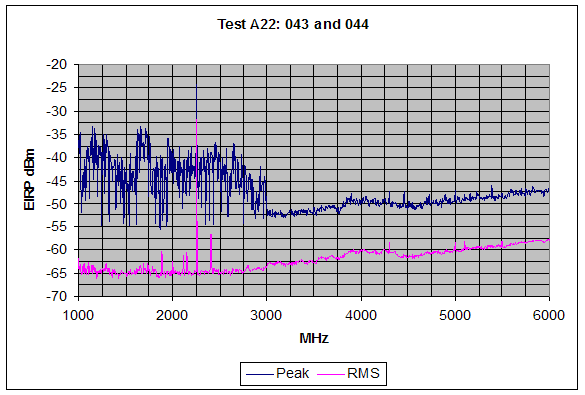
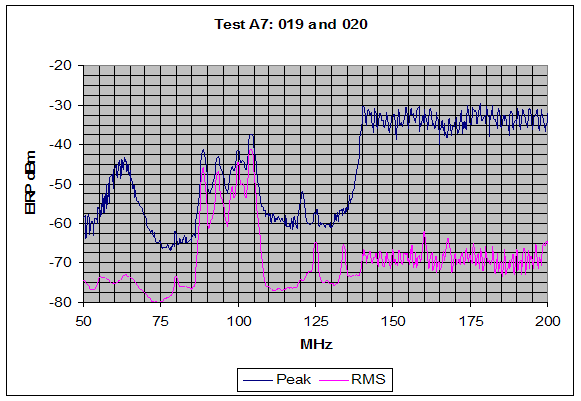
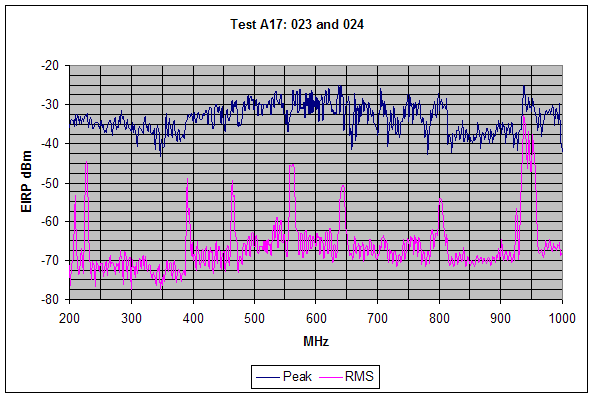
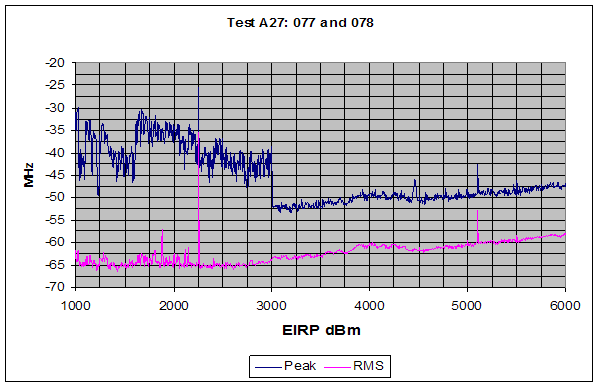
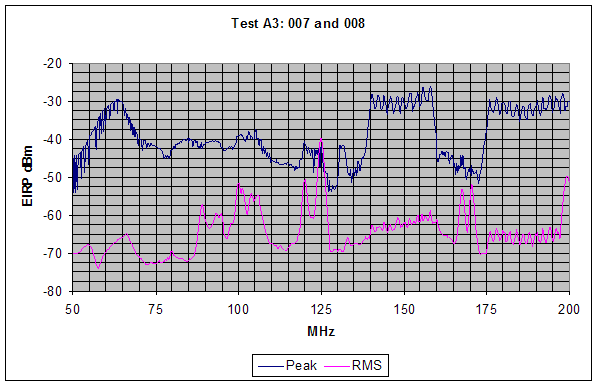
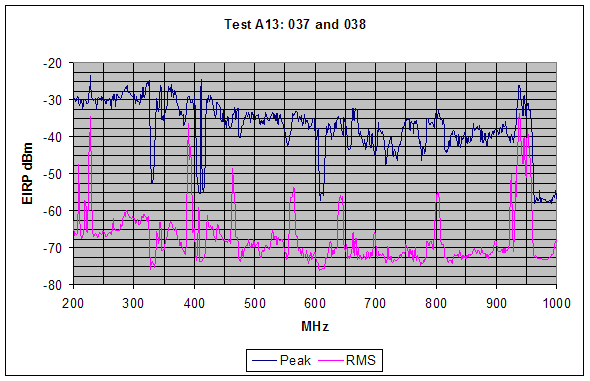
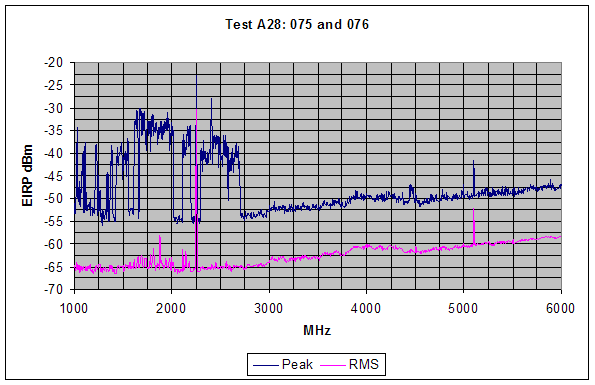
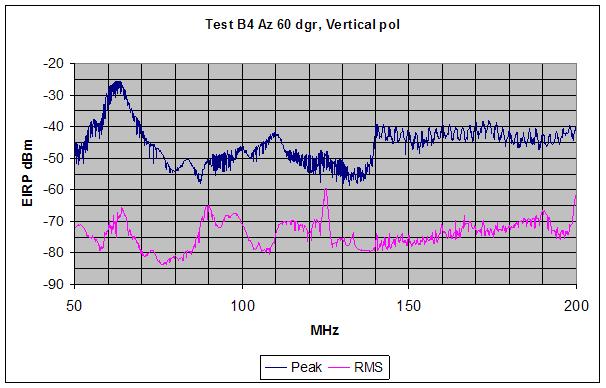
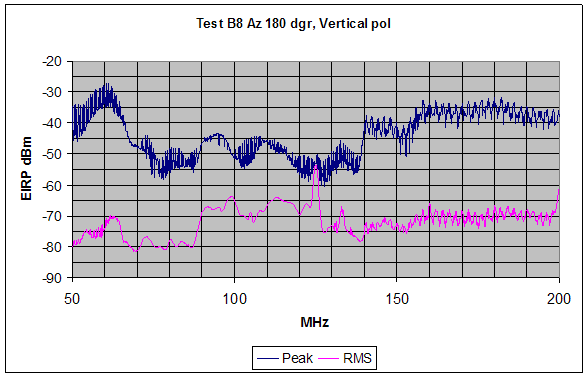
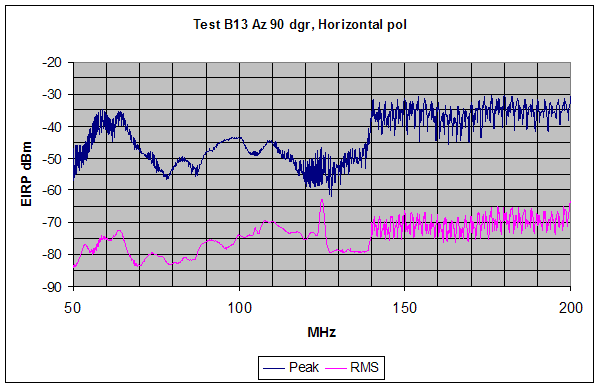
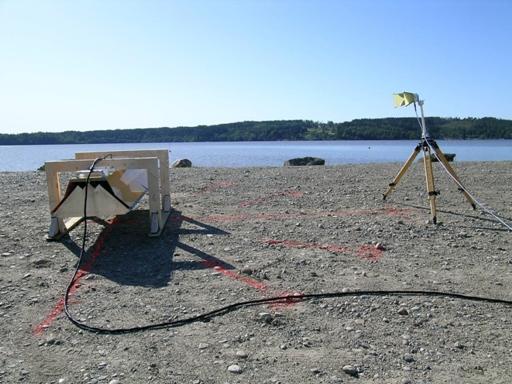
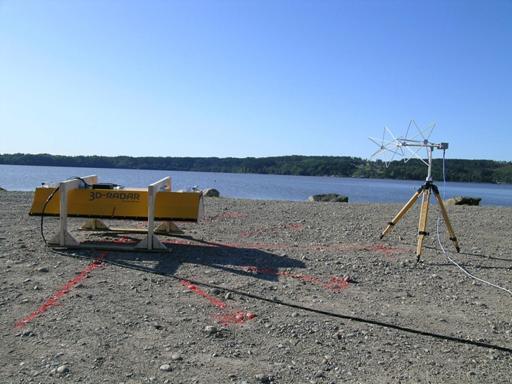
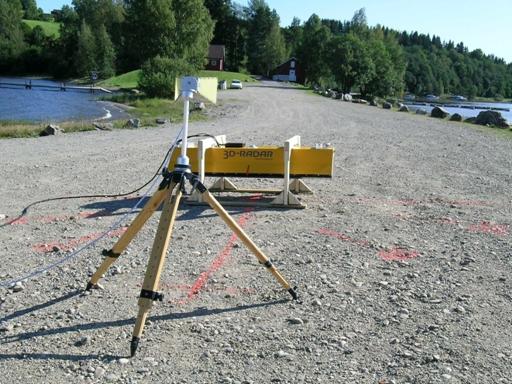
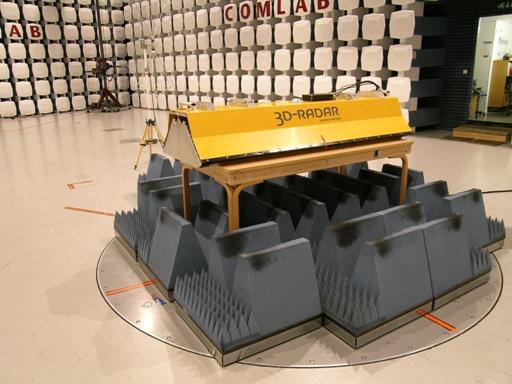
The values are the limit registered during the test period. Test PeriodItem received date: 2009-09-10 Test period: 2009-09-10 – 2009-09-11 Standards and RegulationsFederal Highway Administration/Department of Transportation Step Frequency Ground Penetrating Radar Characterization and Federal compliance Tests July 2, 2009 Test Engineer(s)Egil Hauger Additional informationTest MethodsDescribed in the relevant basic standards. Test EquipmentList of used test equipment, see clause 7. THIS TEST REPORT APPLIES ONLY TO THE ITEM(S) AND CONFIGURATIONS TESTED. TESTED BY : DATE: 2009-10-20 Test Engineer Nemko Group authorizes the above named company to reproduce this report provided it is reproduced in its entirety and for use by the company's employees only. Any reproduction of parts of this report requires approval in writing from Nemko Group. Any use which a third party makes of this report, or any reliance on or decisions to be made based on it, are the responsibility of such third parties. Nemko Group accepts no responsibility for damages suffered by any third party as a result of decisions made or actions based on this report. OTHER COMMENTSGeneral:The outdoor test was performed in rural area with no surroundings reflecting objects, see photo on fig 29 to 31. The indoor test was performed in a semi-anechoic chamber with dimensions 22 Â' 13 Â' 9,5 meters (l Â' w Â' h m), see photo on fig 32. EUT (Equipment Under Test):EUT size 2,5x0,75x0,75 m See photo fig 30 to 33. List of ports:Signal ports: Signal cable Internal antenna Power ports: 12 V dc EMISSION MEASUREMENTSOutdoor testTest set up: The outdoor measurements were performed in rural area with no reflecting objects in the surroundings, see photo on fig 29 to 31. The weather was dry with temperature around 12-15 oC. The ground was sand with some smaller stones. The test equipment was more that 5 m away from the radar. All tests were stored as data file with frequency and EIRP in dBm. Effective radiated power was calculated using Friis free space transmission formula with a distance of 3 m. This equals the formula presented in the test specification: EIRP (dBm) = dBµV/m – 95,2 Test antennas used: 50 – 200 MHz: Biconic antenna 200 – 1000 MHz: Log.periodic antenna 1000 – 6000 MHz: Horn antenna All antennas were calibrated by National Physical Laboratory NPL UK. The conversion factors converting the measured values to EIRP in dBm including cables and pre.amplifier were calibrated before the test and stored in the test equipment. Measurement instruments set up: Resolution bandwidth 1 MHz Video bandwidth 3 MHz Sweep time 15 sec Detector Peak and RMS All test files with frequency and EIRP are enclosed. Some of the files with the most interesting frequency spectra are converted to Excel and shown below. See fig 1 to 13.
Fig 1
Fig 2
Fig 3
Fig 4
Fig 5
Fig 6
Fig 7
Fig 8
Fig 9
Fig 10
Fig 11
Fig 12
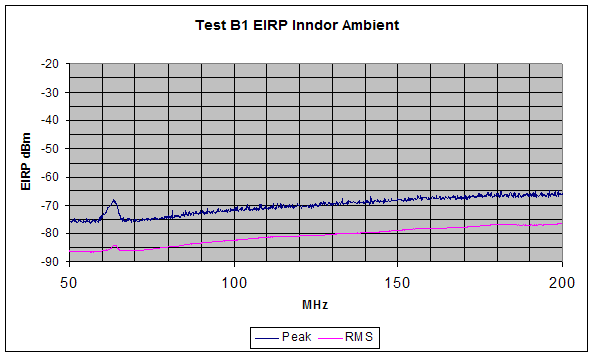
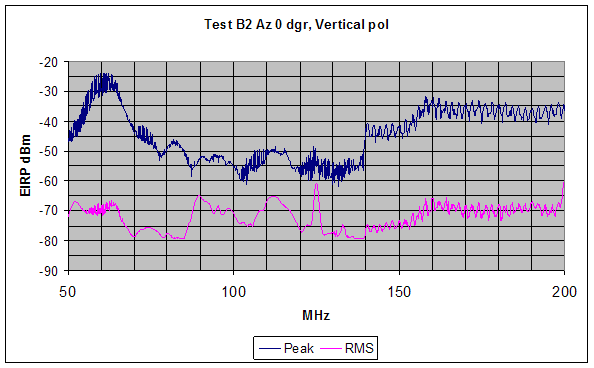
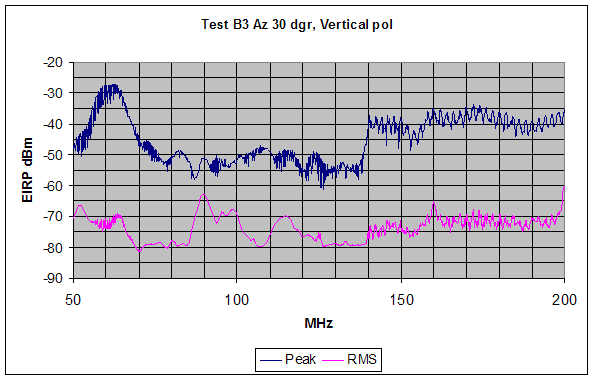
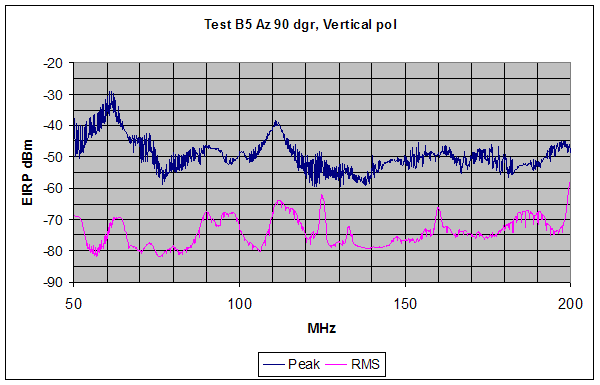
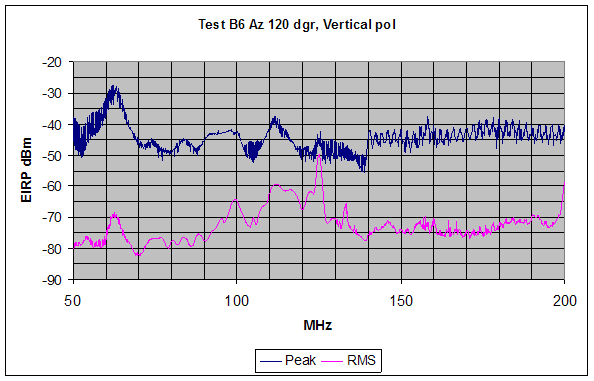
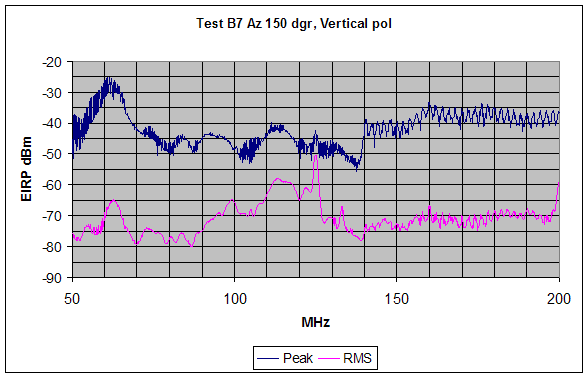
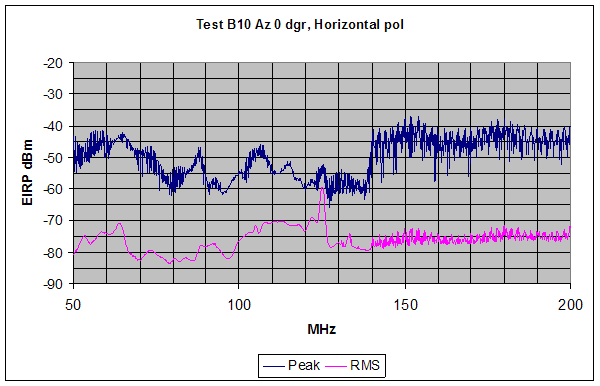
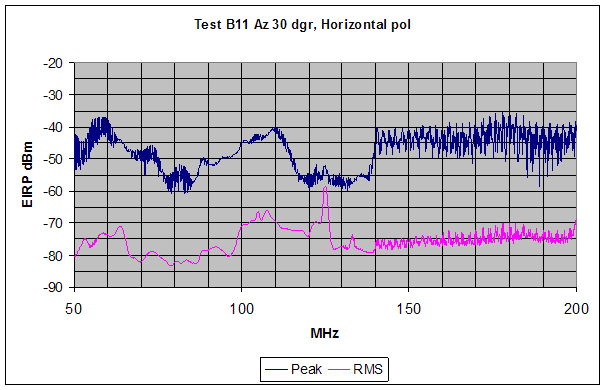
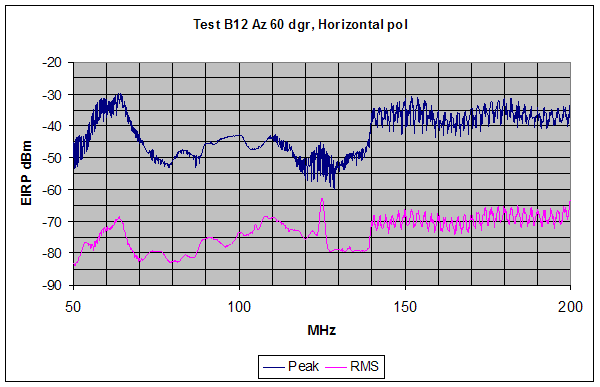
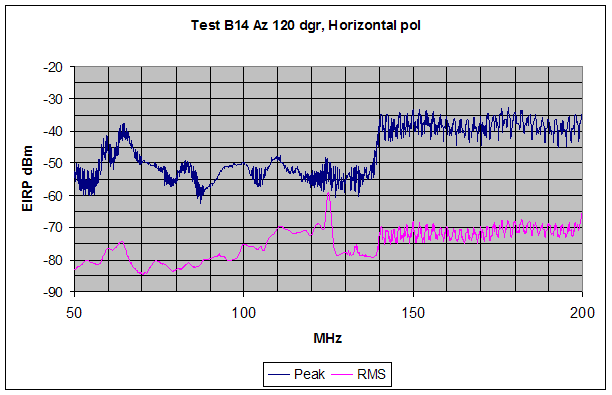
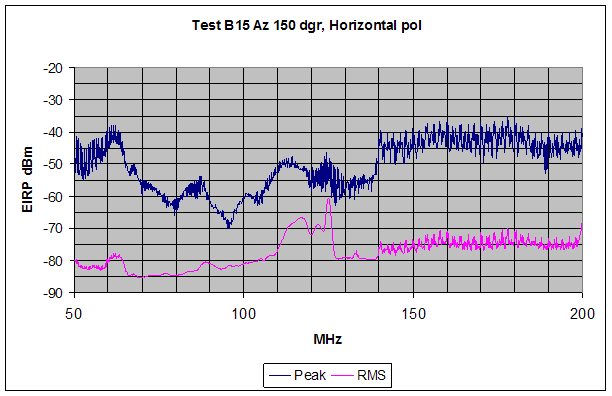
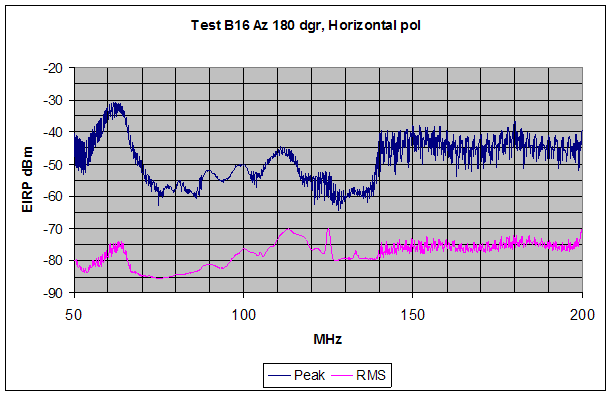
Fig 13 Indoor testTest set up: The test is performed in a semi anechoic chamber with a size of 22 Â' 13 Â' 9,5 meters The EUT was placed on a table with a height of 80 cm. on a turntable. Absorbers with ferrite tiles were placed below the table to prevent reflection from the floor. The receiver antenna height was 2 m, both with horizontal and vertical polarisation with a distance of 3 m to EUT. The EUT was rotated in 30 dgr step from 0 to 180 dgr., see photo on fig 32. Quasi-Peak measurement with 3 m test distance: 120 kHz BW
Sveep measurement:
See fig 14 to 28.
Fig 14
Fig 15
Fig 16
Fig 17
Fig 18
Fig 19
Fig 20
Fig 21
Fig 22
Fig 23
Fig 24
Fig 25
Fig 26
Fig 27 Fig 28. TEST EQUIPMENT AND ANCILLARIES USED FOR TESTS To facilitate inclusion on each page of the test equipment used for related tests, each item of test equipment and ancillaries such as cables are identified (numbered) by the Test Laboratory.
PHOTO OF EUT AND TEST SET UP
Fig 29 Test set up outdoor measurement
Fig 30 Test set up outdoor measurement
Fig 31 Test set up outdoor measurement
Fig 32 Test set up indoor measurement |
||||||||||||||||||||||||||||||||||||||||||||||||||||||||||||||||||||||||||||||||||||||||||||||||||||||||||||||||||||||||||||||||||||||||||||||||||||||||||||||||||||||||||||||||||||||||||||||||||||||||||||||||||||||||||||||||||||||||||||||||||||||||||||||||||||||||||||||||||||||||||||||||||||||||||||||||||||||||||||||||||||||||||||||||||||||||||||||||||||||||||||||||||||||||||||||||||||||||||||||||||||||||||||||||||||||||||||||||||||||||||||||||||||||||||||||||||||||||||||||||||||||||||||||||||||||||||||||||||||||||||||||||||||||||||||||||||||||||||||||||||||||||||||||||||||||||||||||||||||||||||||||||||||||||||||||||||||||||||||||||||||||||||||||||||||||||||||||||||||||||||||||||||||||||||||||||||||||||||||||||||||||||||||||||||||||||||||