U.S. Department of Transportation
Federal Highway Administration
1200 New Jersey Avenue, SE
Washington, DC 20590
202-366-4000
Federal Highway Administration Research and Technology
Coordinating, Developing, and Delivering Highway Transportation Innovations
 |
| This report is an archived publication and may contain dated technical, contact, and link information |
|
Publication Number: FHWA-HRT-10-037
Date: October 2010 |
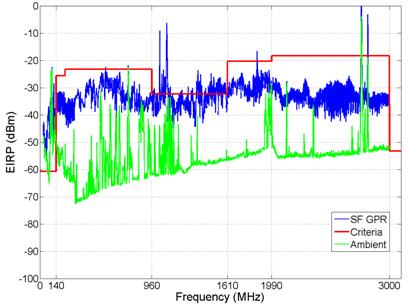
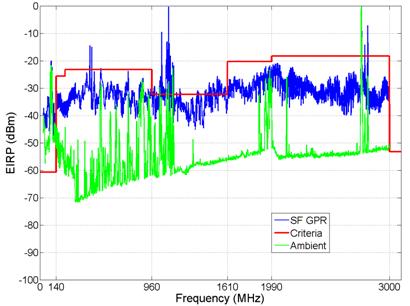
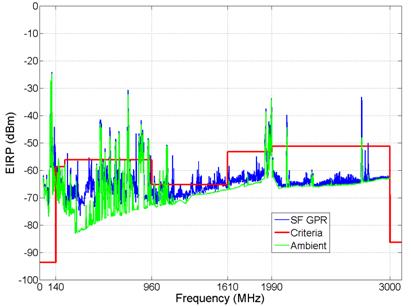
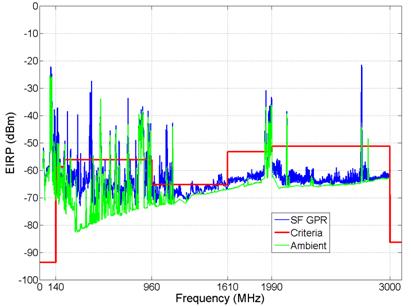
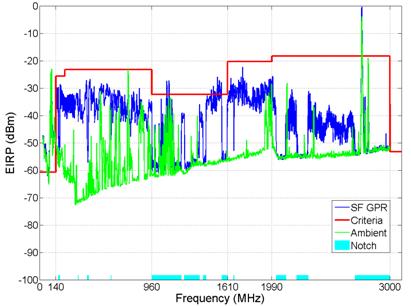
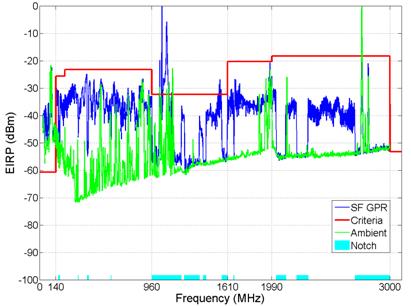
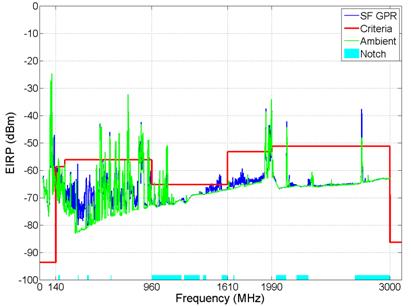
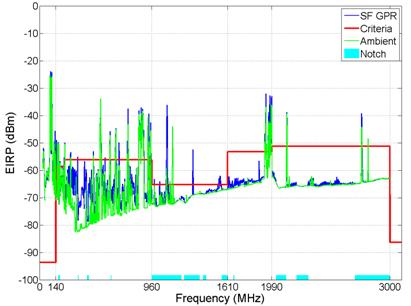
Step Frequency Ground Penetrating Radar Characterization and Federal Evaluation TestsResultsMeasured emission data were collected to determine whether SF GPR emissions levels were below the emissions mask that was proposed in the background section of this report. General measurements were used to make an overall assessment of emission levels using a resolution bandwidth (RBW) of 1 MHz and a video bandwidth (VBW) of 3 MHz. More detailed measurements were made in narrow frequency ranges corresponding to critical Federal systems using appropriate RBW and VBW settings. The operating spectrum for the SF GPR was 140–3,000 MHz, while the measured spectrum used for the emission measurements was 50–6,000 MHz. This section provides a summary of general measurement results to illustrate system compliance with the proposed emissions mask. In instances where measurements indicate frequencies at which the system did not meet NTIA criteria, information is provided to describe ambient phenomena that were often present. To further address any noncompliant phenomena observed, supplemental follow-up data from an FCC-certified laboratory are provided in appendix C. Figure 19 through figure 36 provide follow-up data collected after final system tuning was complete. The three notch configurations, A1, A2, and A3, were tested during the follow-up testing in September 2009, while only one notch configuration, A1, was tested during the initial testing in March 2009. Figure 7 through figure 10 correspond to measured emissions from the SF GPR when its emissions were unnotched. Figure 11 through figure 14 correspond to measured emissions responses from the SF GPR when its emissions were notched. Measured responses from the SF GPR with notched emissions were typically compliant with a few isolated exceptions.
Text Description
Text Description
Text Description
Text Description
Text Description
Text Description
Text Description
Text Description Unnotched SF GPR responses exhibited several frequencies that exceeded compliance criteria in the original emissions data from March 2009, while original notched emissions data rarely exceeded emission criteria. Emissions data collected during follow-up testing after system tuning in September 2009 illustrated that system performance met NTIA criteria in both notched and unnotched operating configurations with only a few exceptions. In instances where exceptions occurred in follow-up data and emissions exceeded NTIA criteria, the reasons were addressed (provided in this section). Emissions data collected for the proposed compliant operating configuration (see figure 11 through figure 14) were obtained using the following methodologies corresponding to each figure. Data presented in figure 11 show the EIRP level received by emissions measurement antennas oriented horizontally while measuring peak emissions from the SF GPR with a notched emissions spectrum. Data in figure 12 show the EIRP level received by emissions measurement antennas oriented vertically while measuring peak emissions from the SF GPR with a notched emissions spectrum. Data in figure 13 show the EIRP level received by emissions measurement antennas oriented horizontally while measuring RMS emissions from the SF GPR with a notched emissions spectrum. Data in figure 14 show the EIRP level received by emissions measurement antennas oriented vertically while measuring RMS emissions from the SF GPR with a notched emissions spectrum. In figure 11, (which generally illustrates compliant peak measurements), there are values that are a small number of decibels above the threshold criteria of 1,530 and 1,560 MHz. Other values exceeding the criteria corresponded to locations where significant ambient measurement values are present. In figure 12, peak measurements are also typically compliant. Frequencies of approximately 1,555 MHz are a small number of decibels above the threshold criteria. Frequencies in the 1,040-MHz range that exceed criteria correspond to substantial ambient emissions. Figure 13 and figure 14 present RMS data that are generally compliant as well. Several SF GPR measurement peaks correspond to ambient measurement spikes in figure 13 and figure 14 and therefore do not indicate compliance issues. In the frequency range of 1,500–1,550 MHz, there are RMS values that are a small number of decibels above the threshold criteria. Appendix C provides additional SF GPR data that were collected at an FCC-certified laboratory after attenuation adjustments were programmed into the system in an effort to bring the remaining system emissions into compliance. Figure 19 through figure 34 illustrate that the peak and RMS emissions greater than 140 MHz had few emissions that did not meet NTIA criteria for the adjusted configuration used during the additional emission measurements in September 2009. Below 140 MHz, peak values exceeded compliance criteria at several frequencies primarily due to unintentional emissions caused by radio frequency (RF) switches in the SF GPR. Unfortunately, there is not a practical way to reduce these unintentional emissions using current SF GPR technology. Detailed measurements are provided in figure 35 and figure 36 to illustrate low frequency phenomena occurring between 50 and 200 MHz. A clear transition between the characteristics of intentional emissions above 140 MHz can be observed relative to unintentional emissions below 140 MHz. The following list provides potential reasons why SF GPR emissions exceeded NTIA criteria for some tested frequencies in September 2009 test data (follow-up data plots corresponding to these listed descriptions are provided in appendix C):
Data collected in narrow frequency bands corresponding to critical Federal systems were not analyzed for this report because this data are anticipated to be evaluated individually by appropriate Federal agencies. The original measurement data from this test are available in electronic form to accompany this report. Figure 17 and figure 18 in appendix B provide the data file matrix corresponding to critical Federal system data collected in March 2009. The data file matrix describing all other data files collected in March 2009 is provided in figure 15 and figure 16 in appendix B. Procedures for data file import are provided in appendix D. |