U.S. Department of Transportation
Federal Highway Administration
1200 New Jersey Avenue, SE
Washington, DC 20590
202-366-4000
Federal Highway Administration Research and Technology
Coordinating, Developing, and Delivering Highway Transportation Innovations
| REPORT |
| This report is an archived publication and may contain dated technical, contact, and link information |
|
| Publication Number: FHWA-HRT-12-054 Date: December 2012 |
Publication Number: FHWA-HRT-12-054 Date: December 2012 |
Evaluation reports may be prepared for the following purposes:
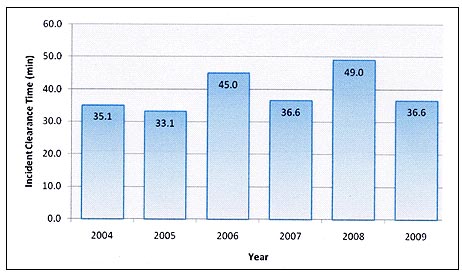
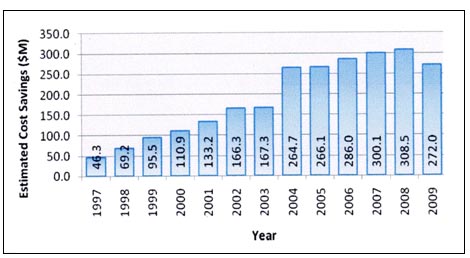
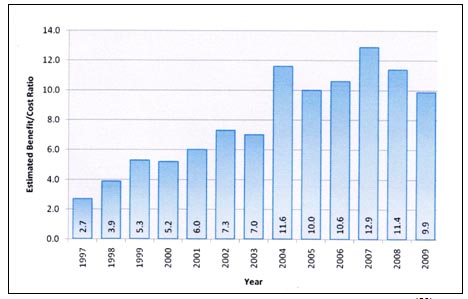
An example of a report includes the Houston TranStar 2009 Annual Report.(52) This report describes the project's mission, management structure activities, agency participants, and user statistics. In addition to providing such performance measures as the number of managed incidents and the number of motorist aid program assists on a system-wide basis, it describes the following outcome-oriented measures:

Figure 58. Graph. Annual average incident clearance time.
Agencies might consider the addition of a band in the columns shown in figure 59 and figure 60, which represents the standard error of the estimate or some other measure of error.

Figure 59. Graph. Estimated annual motorist cost savings attributed to Houston TranStar operation.(52)

Figure 60. Graph. Houston TranStar benefit-cost ratio.(52)
The monthly report developed by the Michigan ITS Center provides
a detailed overview of performance.(53) In addition to providing
measures such as the number of motorist messages, it includes outcome-oriented
statistics such as freeway service patrol response and clear times
(see
table 26
).
Table 26. Freeway service patrol performance statistics.
| Freeway Segment | (Miles) | Total Assists | Assist Density | Average Response Time (min) | Average Clear Time | ||||
| Sept. 2010 | FYTD Average | Sept. 2010 | FYTD Average | Sept. 2010 | FYTD Average | Sept. 2010 | FYTD Average | ||
| I-75 | |||||||||
| Oakland County Line to I-696 | 37.0 | 42.0 | 391.0 | 11.4 | 10.6 | 17.6 | 16.7 | 8.8 | 10.0 |
| I-696 to I-94 | 8.0 | 273 | 252.3 | 34.1 | 31.5 | 9.8 | 10.2 | 13.5 | 10.8 |
| I-94 to I-96 | 5.6 | 88 | 71.0 | 15.7 | 12.7 | 12.0 | 11.0 | 11.5 | 10.3 |
| I-96 to I-275 | 37.0 | 270 | 281.7 | 7.3 | 7.6 | 14.0 | 14.4 | 8.0 | 8.2 |
| I-75 Total | 87.6 | 1,051 | 995.9 | 12.0 | 136.4 | 13.6 | 13.4 | 10.0 | 9.7 |
| I-94 | |||||||||
| Washtenaw County Line to M-39 | 20.7 | 357 | 329.3 | 17.2 | 15.9 | 12.5 | 13.5 | 8.8 | 9.0 |
| M-39 to I-75 | 9.0 | 278 | 275.8 | 30.9 | 30.6 | 12.8 | 11.5 | 10.3 | 9.6 |
| I-75 to I-696 | 10.0 | 294 | 281.3 | 29.4 | 28.1 | 13.8 | 12.4 | 9.2 | 9.0 |
| I-696 to St. Clair County Line | 21.0 | 130 | 194.6 | 6.2 | 9.3 | 19.0 | 13.7 | 6.0 | 7.8 |
| I-94 Total | 60.7 | 1,059 | 1,080.9 | 17.4 | 213.7 | 13.6 | 12.5 | 9.0 | 8.9 |
| I-96 | |||||||||
| Livingston County Line to I-275/I-696 |
11.0 | 127 | 122.9 | 12.5 | 11.2 | 15.3 | 17.3 | 8.2 | 8.2 |
| I-275/M-14 to M-39 | 12.0 | 244 | 243.5 | 20.3 | 20.3 | 11.6 | 12.5 | 10.6 | 8.7 |
| M-39 to I-75 | 11.0 | 370 | 312.6 | 33.6 | 28.4 | 10.6 | 11.6 | 9.0 | 8.1 |
| I-96 Total | 34.0 | 751 | 679.0 | 22.1 | 239.6 | 12.0 | 13.3 | 9.4 | 8.4 |
| I-275 | |||||||||
| I-96/I-696 to M-14/I-96 | 8.0 | 121 | 116.2 | 15.1 | 14.5 | 12.5 | 15.1 | 8.2 | 8.8 |
| M-14/I-96 to I-94 | 12.0 | 120 | 146.8 | 10.0 | 12.2 | 14.3 | 13.6 | 9.0 | 8.0 |
| I-94 to I-75 | 17.5 | 63 | 72.9 | 3.6 | 4.2 | 11.6 | 13.6 | 11.2 | 8.0 |
| I-275 Total | 37.5 | 304 | 335.8 | 8.1 | 10.7.5 | 13.4 | 14.2 | 9.1 | 8.3 |
| I-696 | |||||||||
| I-96/I-275 to M-10 | 9.3 | 176 | 146.8 | 18.9 | 15.8 | 14.1 | 14.4 | 8.9 | 8.7 |
| M-10 to I-75 | 9.0 | 143 | 145.7 | 15.9 | 16.2 | 14.0 | 12.6 | 8.0 | 8.8 |
| I-75 to I-94 | 10.4 | 181 | 194.4 | 17.4 | 18.7 | 14.5 | 12.5 | 8.2 | 8.5 |
| I-696 Total | 28.7 | 500 | 486.9 | 17.4 | 203.6 | 14.2 | 13.0 | 8.4 | 8.7 |
| M-59 (Veterans | 24.0 | 26 | 28.9 | 1.1 | 1.2 | 15.0 | 19.9 | 9.7 | 10.1 |
| I-375 | 1.2 | 6 | 8.7 | 5.0 | 7.2 | 11.0 | 13.1 | 3.3 | 8.7 |
| M-10 (Lodge) | 17.9 | 332 | 351.8 | 18.5 | 19.7 | 11.2 | 11.2 | 8.7 | 9.4 |
| M-14 | 6.4 | 60 | 70.3 | 9.4 | 11.0 | 11.4 | 13.9 | 6.2 | 7.7 |
| M-39 (Southfield) | 14.2 | 249 | 269.1 | 17.5 | 18.9 | 10.7 | 11.9 | 10.0 | 9.6 |
| M-5 (Grand River) | 10.3 | 43 | 37.8 | 4.2 | 3.7 | 12.6 | 14.5 | 7.9 | 8.0 |
| M-8 (Davison) | 2.2 | 29 | 45.7 | 13.2 | 20.8 | 8.9 | 8.7 | 9.3 | 9.7 |
| Total | 324.7 | 4,410 | 4,390.8 | ||||||
Note: FYTD = Fiscal year to date.
New timing plans were implemented based on periodic examination of traffic conditions. Formal evaluations were conducted in conjunction with signal retiming projects. An example of such a study is shown in table 27 through table 29.(54)
Table 27. Example of Naperville, IL, travel time/delay summary.
Time Period |
Travel Direction |
Condition |
Travel Time (s) |
Delay (s) |
Stops |
Average Speed (mi/h) |
|---|---|---|---|---|---|---|
Morning peak |
Eastbound |
Before |
920.0 |
474.3 |
11.7 |
17.2 |
After |
697.0 |
245.7 |
7 |
22.7 |
||
Change |
223.0 |
228.6 |
4.7 |
5.5 |
||
Percent change |
24.2 percent |
48.2 percent |
40.2 percent |
32.0 percent |
||
Westbound |
Before |
675.3 |
239.3 |
6.3 |
23.5 |
|
After |
568.0 |
168.7 |
3.7 |
27.9 |
||
Change |
107.3 |
70.6 |
2.6 |
4.4 |
||
Percent change |
15.9 percent |
29.5 percent |
41.3 percent |
18.7 percent |
||
Midday |
Eastbound |
Before |
624.0 |
194 |
6 |
25.4 |
After |
542.7 |
111 |
5 |
29.3 |
||
Change |
81.3 |
83.0 |
1.0 |
3.9 |
||
Percent change |
13.0 percent |
42.8 percent |
16.7 percent |
15.4 percent |
||
Westbound |
Before |
687.3 |
251 |
6.7 |
23.1 |
|
After |
552.0 |
152 |
3 |
28.7 |
||
Change |
135.3 |
99.0 |
3.7 |
5.6 |
||
Percent change |
19.7 percent |
39.4 percent |
55.2 percent |
24.2 percent |
||
Afternoon peak |
Eastbound |
Before |
732.3 |
293 |
6 |
21.7 |
After |
635.3 |
194.7 |
3.7 |
25 |
||
Change |
97.0 |
98.3 |
2.3 |
3.3 |
||
Percent change |
13.2 percent |
33.5 percent |
38.3 percent |
15.2 percent |
||
Westbound |
Before |
916.3 |
486.7 |
9.3 |
17.3 |
|
After |
736.0 |
312.7 |
7.3 |
21.6 |
||
Change |
180.3 |
174.0 |
2.0 |
4.3 |
||
Percent change |
19.7 percent |
35.8 percent |
21.5 percent |
24.9 percent |
Table 28. Naperville, IL, vehicle emmisions summary-percent reduction.
| Time Period | Travel Direction | Hydrocarbons (Percent grams/day) | Carbon Monoxide (Percent grams/day) | Nitrogen Ovide (Percent grams/day) |
|---|---|---|---|---|
| Morning peak | Eastbound | 7 | 2 | -11 |
| Westbound | 5 | -5 | -1 | |
| Midday | Eastbound | 5 | 2 | -2 |
| Westbound | 13 | 1 | 12 | |
| Afternoon peak | Eastbound | 9 | 8 | 5 |
| Westbound | 10 | 2 | 3 |
Table 29 Naperville, IL, vehicle emmisions summary—annual emission reduction.
| Time Period | Hydrocarbons (tons/year) | Carbon Monoxide (tons/year) | Nitrogen Oxide (tons/year) |
|---|---|---|---|
| Morning peak | -16 | 10 | 10 |
| Midday | -40 | -71 | -13 |
| Afternoon peak | -28 | -140 | -6 |