U.S. Department of Transportation
Federal Highway Administration
1200 New Jersey Avenue, SE
Washington, DC 20590
202-366-4000
Federal Highway Administration Research and Technology
Coordinating, Developing, and Delivering Highway Transportation Innovations
 |
| This report is an archived publication and may contain dated technical, contact, and link information |
|
Publication Number: FHWA-RD-01-159
Date: March 2002 |
|||||||||||||||||||||||||||||||||||||||||||||||||||||||||||||||||||||||||||||||||||||||||||||||||||||||||||||||||||||||||||||||||||||||||||||||||||||||||||||||||||||||||||||||||||||||||||||||||||||||||||||||||||||||||||||||||||||||||||||||||||||||||||||||||||||||||||||||||||||||||||||||||||||||||||||||||||||||||||||||||||||||||||||||||||||||||||||||||||||||||||||||||||||||||||||||||||||||||||||||||||||||||||||||||||||||||||||||||||||||||||||||||||||||||||||||||||||||||||||||||||||||||||||||||||||||||||||||||||||||||||||||||||||||||||||||||||||||||||||||||||||||||||||||||||||||||||||||||||||||||||||||||||||||||||||||||||||||||||||||||||||||||||||||||||||||||||||||||||||||||||||||||||||||||||||||||||||||||||||||||||||||||||||||||||||||||||||||||||||||||||||||||||||||||||||||||||||||||||||||||||||||||||||||||||||||||||||||||||||||||||||||||||||||||||||||||||||||||||||||||||||||||||||||||||||||||||||||||||||||||||||||||||||||||||||||||||||||||||||||||||||||||||||||||||||||||||||||||||||||
Model Development For National Assessment of Commercial Vehicle ParkingPDF Version (3.69 MB)
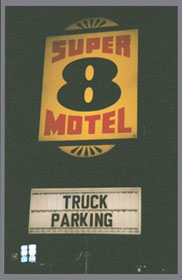
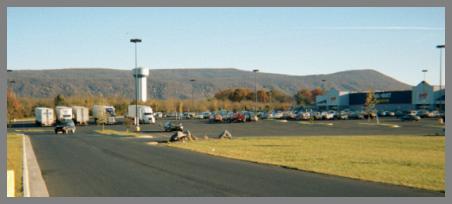
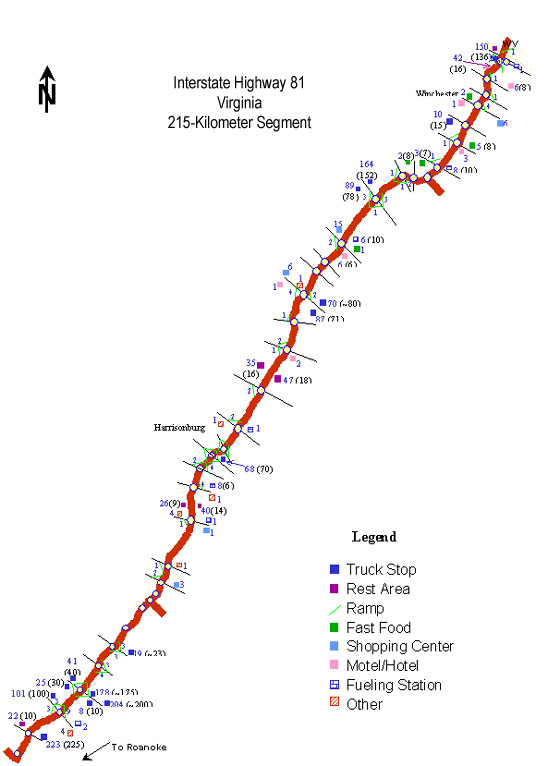
PDF files can be viewed with the Acrobat® Reader® 4.0 TRUCK PARKING DEMAND MODEL CALIBRATIONThe next step in the truck parking demand model development process was calibration. Calibration involves estimating the values of various constants and parameters in a model structure. Calibration of model coefficients and constants is usually accomplished by solving the model equation for the parameters of interest after supplying observed values of both the dependent and independent variables, or by manipulating the constants/parameters to obtain a match between known/observed values and the model's estimated values. The calibration of model parameters is an iterative, trial-and-error effort that seeks the parameter values that have the greatest probability of being accurate within a specified "acceptable" error. In the case of the parking demand model, the observed values were obtained from overnight field counts of parked trucks along interstate highway segments in Arkansas, Georgia, Idaho, Mississippi, Missouri, Pennsylvania, Tennessee, and Virginia. The model's independent variables, as previously discussed, included traffic engineering measures, Federal HOS regulations, and variables derived from drivers' responses to questions regarding actual travel patterns and preferences. Existing national and State inventories and studies were used, together with the model, to estimate the extent and geographic distribution of truck parking demand and supply along the NHS. Partners, consisting of State DOTs, motor carrier companies, and truck stop operators, examined the model estimates in light of actual observational studies or experience to provide a basis for determining face validity of the results. Where appropriate, model parameters were adjusted to better replicate observed parking demand. This section details the methodology and data collection procedures for observational studies performed to obtain field data for purposes of calibrating the truck parking demand model. Then, the results of the calibration process are presented and discussed. 4.1 Observational StudiesThe purpose of the commercial vehicle parking field survey was to record trucks parked during the peak hour in public rest areas, private truck stops, pull-out areas, interchange ramps, mainline and cross-street shoulders, fueling stations, fast food restaurants, hotels, etc. These field counts were compared to the parking demand estimates from the model during model calibration. 4.1.1 MethodologyPeak demand for long-term truck parking typically occurs in the overnight hours between 10:00 p.m. and 6:00 a.m. The methodology for the observational studies was based on that of surveys conducted by the Kentucky Transportation Cabinet as part of a statewide truck parking study.(13) In choosing the highway segments for data collection, it was important that they be short enough to allow for counts in both directions during the overnight peak period. Counts in both directions would allow for two counts at every facility at every interchange as well as one count of each rest area, weigh station, and truck pull-out (which are typically accessible from only one side of the roadway). Before conducting the actual study, each segment was driven during daylight hours to verify known parking locations and to identify other potential parking locations for trucks. Where parking spaces were not clearly marked, surveyors asked facility managers or made estimations as to the number of trucks the parking area could accommodate. The surveyors made note of hotels (figure 2), fast food restaurants (figure 3), and large retail stores (figure 4) that had designated truck-parking spaces.
Figure 2. Truck parking signage at a motel.
Figure 3. Truck parking signage at a fast food restaurant.
Figure 4. Example of truck parking available at a large retail store. While the truck parking areas at some private truck stops may be accessible to passenger cars, others (usually those that have paid parking) have access gates. In these cases, it was necessary for the surveyor to contact a manager to inform him/her of the study, as well as the times that the crew was likely to be back to observe the parked trucks. By informing the truck stop operator of the value of the study, information regarding the approximate number of truck parking spaces could also be obtained. A survey crew, consisting of a driver and a field recorder, covered each specified highway segment during the daylight hours of approximately 7:00 a.m. to 5:30 p.m. to locate and record the number of commercial vehicle parking spaces at each interchange. The crew also identified all rest areas and welcome centers that were accessible from only one direction on the highway. The crew located and counted all truck parking spaces within one-half mile in both directions of the highway. If a sign identified truck parking farther away than one-half mile, the driver located, examined, and recorded parking spaces at that parking facility. 4.1.1.2 Nighttime Observations The survey crew began at one end of the selected highway segment at approximately 10:00 p.m. and drove to each parking location identified on the inventory forms during the daylight observations. The crew counted all parked trucks, including those that were not at a location identified during the day. The crew continued to drive the segment, counting and recording the number of parked trucks, until reaching the end of the segment. The survey crew then turned around and repeated the same procedure back along the segment in the opposite direction of travel. At locations such as rest areas, welcome centers, interchange ramps, and mainline shoulders, trucks were recorded only once, in the direction of travel. 4.1.2 Survey AdministrationThe survey was conducted by teaming two individuals experienced in transportation and traffic-related project work. A pilot study was conducted in early October 2000 and subsequent studies were conducted in November and December. Observations were not made during the weeks of the Thanksgiving and Christmas holidays. After the survey crew had completed their observations, the recorded data were input into a spreadsheet for further analysis. A pilot study was conducted along a 215-kilometer (134-mile) segment [one segment of 95 kilometers (59 miles) and another segment of 120 kilometers (75 miles)] of I-81 in Virginia. Subsequent to the pilot study, observational studies were conducted on six segments of Georgia interstate highway, six segments of Pennsylvania interstate highway, and eight segments of interstate highway in four States around the Memphis, Tennessee area. In addition, results of observations along seven highway segments were obtained from the Idaho DOT. 4.1.3 Field Observation ResultsResults of the pilot field observational study on I-81 in Virginia are presented in figure 5. The figure shows the 215-kilometer (134-mile) stretch of I-81 in western Virginia, with each cross-street interchange. At each interchange, the number of observed parked trucks is indicated next to the facility (e.g., truck stop, rest area, fast food, etc.). The numbers shown in parentheses, following the number of trucks observed, are the approximate numbers of spaces available at each facility. Examination of the diagram shows the 215-kilometer (134-mile) stretch of I-81 to be over capacity. At most of the parking facilities there were more trucks observed parked than there were available spaces (trucks parked around perimeter of facility or in undesignated spaces). In addition, parked trucks were observed on one or more of the ramps at most of the cross-street interchanges. Although all of the public rest areas and most of the private truck stops were full or over-flowing, there were a few spaces available at some fast food restaurants, fueling stations, and shopping centers along the segment. Figure 5. Results of field observational study—location of parked trucks. 4.2 Model CalibrationThe truck parking demand model was calibrated using truck counts from 29 highway segments. The 29 highway segments are located in eight States across four regions and represent 14 highways along ten corridors. Table 6 gives details about the highway segments. Two model parameters were calibrated: the long-haul peak parking factor (PPFLH) and the short-haul to long-haul ratio (PSH/PLH). The PPFLH was calibrated, as it is a factor that is not easily measured in the field. When considering peak-hour travel characteristics, traffic engineers sometimes assume that about ten percent of the 24-hour travel demand occurs in the peak hour. While this could be used as a benchmark for calibrating the PPFLH, it is not necessarily safe to assume that the peaking characteristics of truck parking will be the same as those for vehicle travel. The PSH/PLH ratio (i.e., the proportion of daily truck traffic consisting of short-haul trucks over the proportion of daily truck traffic consisting of long-haul trucks, referred to as the short-haul to long-haul ratio) is not readily known. In addition, there are many factors that might affect the proportion of the daily truck traffic consisting of short- and long-haul trucks. For this study, "short haul" was defined as a trip that could be made without an overnight stay. Thus, the maximum one-way distance for a short-haul trip would typically be between 320 kilometers (200 miles) and 400 kilometers (250 miles), depending on the speed traveled, the length of the workday, and the number and length of stops made during the trip. With this in mind, it is likely that proximity to a city would result in an increased number of short-haul trips, as many round trips are likely to be made in and around the city within this 320-kilometer (200-mile) to 400-kilometer (250-mile) radius. Outside of this radius, the number of short-haul trips would likely decrease, as there are few places for them to originate and terminate without an overnight stay required. Not only is the proximity to a city likely to affect PSH/PLH ratio, so is the size of metropolitan areas. Larger metropolitan areas are likely to generate more short-haul trips than smaller ones. Although there may be a large range of PSH/PLH ratios, for the model purposes, it was important to narrow the options to just a few that would be based on practical, easy-to-define criteria. After considerable thought and research into values that might be appropriate for the PSH/PLH ratio, the team decided to conduct an origin-destination (OD) survey to measure an actual value for this ratio in the field. The methodology for the OD study was based on a previous study of commercial vehicle traffic on the Woodrow Wilson Bridge in the Washington, D.C. metropolitan area, which employed a similar technique. That OD survey was conducted at a weigh station along I-95 in Northern Virginia to develop an estimate of the number of through trucks over the bridge.(18) The results, applicable to within a metropolitan area, showed the PSH /PLH ratio to be about .65/.35. Because nearly all of the highway segments defined for analysis in this Section 4027 study were located outside of a city, or have a city at one or both end points, this ratio would not be applicable, as it represents truck traffic on a circumferential route within a major metropolitan area.
1Segment classified as a rural segment. Therefore, an OD survey for this study was conducted at the Grapevine Inspection Facility, located on the southbound lanes of I-5, approximately 120 kilometers (75 miles) north of Los Angeles, California. This site was selected, as it was close enough to a major metropolitan area to serve a number of short-haul trips, but was far enough away from the city not to serve a majority of short-haul trips (thus being more typical of segments analyzed in this study). The study involved a survey of tractor-trailer drivers as they passed through the scales of the inspection station. All data were collected on July 19, 2000, between the hours of 4:30 and 7:30 p.m. The methodology relied on members of the survey team approaching truck drivers as they entered a weigh station. The survey team consisted of two data collection crews, with each crew consisting of a transportation analyst and a representative of the California Highway Patrol. Each data collection crew was positioned between two of the three static scales. Trucks entering the weigh station formed a single queue until directed by station personnel to one of the three static scales. As the trucks entered the scales, the enforcement officers signaled the drivers to stop. The analysts then approached the trucks and asked the drivers if they would be willing to participate in a survey that would take approximately 15 seconds to complete. All drivers that were approached agreed to participate in the study. To ensure safety of the motoring public, the station operator monitored ramp congestion as the trucks exited the highway. If the truck queue began encroaching on the mainline, the station operator signaled the crews to cease data collection. During the three-hour study, the survey team was directed to stop collecting data twice, for a total of about ten minutes. The analysts asked the drivers two questions: "For this trip, what was your city and State of origin," and "What is the city and State of your farthest destination?" Trips were classified as local or short-haul if the distance traveled was less than 400 kilometers (250 miles) one-way, all others were considered long-haul trips. During the 2.5 hours of active data collection, approximately 200 tractor-trailer drivers were surveyed. The study team found the approach to be relatively simple to plan and implement and recommended the methodology as an efficient and reliable technique for collecting origin/destination data to determine the number of short-haul and long-haul trucks along a highway corridor. Analysis of the OD survey showed that about 38 percent of the trucks were short-hauls and about 62 percent were long-hauls, a PSH/PLH ratio of .38/.62. These results, which could be applied to at least the "urban" analysis segments in this study (i.e., those with a city as an endpoint), were used as a starting point for model calibration. The next section presents a discussion of the PPHLH calibration. Then, the following section discusses the calibration of the PSH/PLH ratio. 4.2.1 Calibrate Long-Haul Peak Parking FactorThe PPFLH represents the proportion of the 24-hour parking demand that occurs in the peak hour. Numerous studies have shown the peak for truck parking to occur between 10 p.m. and 6 a.m. (See references 5,6,7,11,12, and13.) Few short-haul trucks are expected to be on the road at this time, and the value for PPFSH was set at 0.02 (based on professional judgment). In other words, only two percent of the total short-haul parking demand is predicted to occur in the peak hour. (Note: The peak-hour for short-haul parking demand is likely to occur around 12:00 p.m., when the PPFSH would be much higher.) The PPFLH, on the other hand, is more difficult to estimate. Therefore, to calibrate this factor, the model was run simultaneously for each of the 29 segments in table 6 as well as for corridors formed by combining two or more of the individual segments along the same highway or probable travel route. Figure 6 is an example of the parking demand spreadsheet model with inputs and outputs shown. The first step was to run the model using a fixed PSH/PLH ratio of .38/.62 (from the field OD survey) and to manipulate the PPFLH to get parking estimates as close to the actual truck counts as possible overall for the 29 highway segments. Table 7 summarizes the model estimates; the observed trucks; and the segment, corridor, regional, and overall errors associated with the model estimates using a calibrated (within one percentage point) PPFLH of 0.11. Truck Parking Demand Model
Figure 6. Example of truck parking demand model spreadsheet.
Table 7. Summary of model results—calibrated long-haul peak parking factor of 0.11.
1Number of trucks counted during the peak hour in the field observational study. 2Estimated trucks demanding a parking space during the peak hour. A PPFLH of 0.11 resulted in a -2 percent error for the 29 segments combined, an estimate within 309 spaces of the observed parked trucks. However, looking at the regional errors, the model overestimates the observed parked trucks in two of the four regions (i.e., Atlanta, Georgia and Memphis, Tennessee) and underestimates the observed parked trucks in the other two regions (i.e., Pocatello, Idaho and Harrisburg, Pennsylvania). One possible explanation for these contrary results could be the use of only one PSH /PLH ratio. Examining the segments in each of the regions, it appears that while the segments in Georgia and around the Memphis area are tied to an urban area, the segments in Idaho, Pennsylvania, and Virginia are more rural in nature. Thus, from this initial calibration of the PPFLH, it became necessary to develop a second PSH/PLH ratio, one to represent the more rural segments, where the proportion of short-haul vehicles will be less than on segments that are proximate to an urban area. While no field data were available to determine the PSH/PLH ratio for a rural segment, .01/.90 was chosen as a reasonable value, based on professional judgment, and was used as a starting point for model calibration. Thus, to recalibrate the PPFLH using two PSH/PLH ratios, a "rule" was set for defining whether a segment was urban or rural. A segment was defined as "urban" if it was within 320 kilometers (200 miles) of a city with a population of 200,000 or more, otherwise it was classified as "rural." This definition was based on the maximum distance that could normally be driven round-trip in one day without an overnight stay and a population commonly associated with a metropolitan area. With segments defined as urban or rural and corresponding PSH/PLH ratios, the PPFLH was recalibrated. Table 8 summarizes the model estimates; the observed trucks; and the segment, corridor, regional, and overall errors with a recalibrated PPFLH of 0.09. Segments defined as rural are noted in table 8. The errors presented in table 8 clearly show that the use of two PSH/PLH ratios results in better estimates of parking demand, when compared to field counts of parked trucks. While the overall error for the 29 segments is higher than when using only one PSH/PLH ratio (-5 percent compared to -2 percent), the regional estimates are all within ±10 percent of the observed values, and the estimates for eight of the ten corridors are within ±16 percent of the observed values (an error considered to be "acceptable" for most demand modeling exercises). These errors represent a considerable improvement over the corridor and regional errors shown in table 7. It can be seen that the model results presented in tables 7 and 8 are more accurate at the region and corridor level than at the segment level. This is a result of overestimates and underestimates on successive segments forming a corridor, to some extent, canceling out. This is due to limitations in the model; the model does not consider a number of factors that can affect the local distribution of demand (which are observed in the field counts), such as the distribution of supply. While a driver may have the need to park on one segment, he or she may actually park on the previous or subsequent segment, especially if he or she is in search of a truck stop with a particular brand of fuel or a rest area at which he or she might like to stop. Another factor that might affect where a driver actually parks (as opposed to where the need arises) is where major corridors intersect. Again, a driver may need to park on the segment before the interchange, but may wait until after he or she has changed routes. A third factor that might affect where a driver actually parks is if the driver has to pick up or drop off a load the next day. In this case, the driver may "stage" outside of the area in order to more easily access his or her loading dock the next morning. This would most likely affect those segments that have a city as an endpoint. It should be noted, however, that the error at the segment level does not necessarily indicate that the demand model is inaccurate when applied to highway segments, but may indicate that the lack of parking spaces on some highway segments creates unmet demand that appears in field observations as unusually high demand on nearby segments with a surplus of parking. Table 8. Summary of model results——calibrated long-haul peak parking factor of 0.09.
1Number of trucks counted during the peak hour in the field observational study. 2Estimated trucks demanding a parking space during the peak hour. 3Segment classified as a rural segment. 4.2.2 Calibrate Short-Haul to Long-Haul RatioThe next step in the model calibration was to rerun the model using 0.09 as the fixed PPFLH and to manipulate the urban and rural PSH/PLH ratios to get model results as close to the field counts as possible. Table 9 summarizes the model estimates, the actual counts, and the errors using calibrated urban and rural PSH/PLH ratios of .36/.64 and .07/.93, respectively. Calibrating the PSH/PLH ratios was a trial-and-error process that involved adjusting the ratios one percentage at a time, one ratio at a time, to balance the model estimates around the observed values. The first step in arriving at the calibrated PSH/PLH ratios was to decrease the urban PSH/PLH ratio slightly to increase the parking demand estimates, as the two urban regions were both underestimated by about three percent before calibrating this ratio (see table 8 for the model errors before calibration and table 9 for the model errors after calibration). Therefore, the urban PSH/PLH was adjusted from .38/.62 to .37/.63 to .36/.64. Adjusting the ratio in this manner resulted in the errors for the Atlanta, Georgia and Memphis, Tennessee regions to go from -3 percent to zero. Examining the corridor errors for these two regions, the model estimates for all three multi-segment corridors are within ±8 percent. The next step was to adjust the rural PSH/PLH ratio. While two of the corridors in the Pocatello, Idaho region and one of the corridors in the Harrisburg, Pennsylvania region were very closely estimated (within ±1 percent) before calibrating the rural PSH/PLH ratio, the I-80 corridor across Pennsylvania (from Dubois to Scotrun) was largely underestimated before calibrating this ratio. Therefore, the rural PSH/PLH ratio was decreased slightly to increase the parking demand estimates. The rural PSH/PLH was adjusted from .10/.90 to .09/.91 and from .08/.92 to .07/.93. Adjusting the ratio in this manner resulted in the errors for the Pocatello, Idaho region to go from 3 percent to 6 percent and the errors for the Harrisburg, Pennsylvania region to go from -10 percent to -7 percent, an adjustment that results in a better balance of the rural estimates around the observed values. Examining the corridor errors for these two regions, the model estimates for four of the five corridors are within ±20 percent of the observed parked trucks, while three of the five are within ±5 percent. The absolute errors in estimated demand at the segment, corridor, and regional level were 38, 12, and 3 percent, respectively. The calibrated PSH/PLH ratios resulted in an improved overall error of only -2 percent for the 29 segments combined, an estimate within 269 spaces of the observed parked trucks. The parking demand for eight of the ten corridors was estimated within ±20 percent of the observed parked trucks, the parking demand for seven of the ten corridors was estimated within ±13 percent of the observed parked trucks, and the parking demand for six of the ten corridors was estimated within ±8 percent of the observed parked trucks. The error in the estimates for the I-80 corridor in Pennsylvania remained large (-35 percent) after model calibration. The model estimates for all three segments of this corridor were more than 20 percent lower than the observed values (while the model much more accurately estimated parking demand for the other corridors). It is possible that there were inaccuracies in the input truck volumes. These inaccuracies could come in the form of low AADTs, low percent trucks, or both. Table 9. Summary of model results—calibrated short-haul to long-haul ratio.
1Number of trucks counted during the peak hour in the field observational study. 2Estimated trucks demanding a parking space during the peak hour. 1Segment classified as a rural segment. It should be noted that the demand for parking along half the 29 segments was at or exceeding capacity at the time the observational studies were conducted. Thus, for these segments, one would expect the model to estimate a demand higher than the observed number of trucks, as there were drivers that were demanding a space, but were not counted because there was no place for them to park. Because it is unknown how much demand is not being met along these corridors, it is difficult to know by how much the model should estimate demand over that which was observed. Because the model was calibrated to the observed parked trucks (rather than the actual demand for some of the segments), the use of this model will result in a conservative estimate of truck parking demand. |