U.S. Department of Transportation
Federal Highway Administration
1200 New Jersey Avenue, SE
Washington, DC 20590
202-366-4000
Federal Highway Administration Research and Technology
Coordinating, Developing, and Delivering Highway Transportation Innovations
 |
| This report is an archived publication and may contain dated technical, contact, and link information |
|
Publication Number: FHWA-RD-03-037
Date: May 2005 |
||||||||||||||||||||||||||||||||||||||||||||||||||||||||||||||||||||||||||||||||||||||||||||||||||||||||||||||||||||||||||||||||||||||||||||||||||||||||||||||||||||||||||||||||||||||||||||||||||||||||||||||||||||||||||||||||||||||||||||||||||||||||||||||||||||||||||||||||||||||||||||||||||||||||||||||||||||||||||||||||||||||||||||||||||||||||||||||||||||||||||
Validation of Accident Models for IntersectionsFHWA Contact: John Doremi, PDF Version (1.61 MB)
PDF files can be viewed with the Acrobat® Reader® 2. VALIDATION OF ACCIDENT MODELS (Continuation)2.6 VALIDATION ACTIVITY 3: VALIDATION OF THE ACCIDENT PREDICTION ALGORITHMTwo tasks were undertaken to validate the accident prediction algorithm in Harwood et al.:(3)
The Minnesota and Washington data could not be used for validating the algorithms for models I and II because sight distance, one of the variables for which an AMF is applied, was not known at these sites. Data Limitations in the Michigan Data As previously discussed for validation activity 2, it was discovered subsequent to the analysis and draft report that the later year crossroad accident numbers at the Michigan Type V sites should be systematically higher than the values used. The various measures of GOF statistics would be also improved if the higher numbers were used. Although the GOF measures should improve, the conclusions drawn from these data and the Georgia data would not change since Model V is in need of recalibration in any case.2.6.1 Validation of the Base ModelsThe recommended base model for type I intersections is:
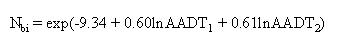
where Nbi = the expected number of annual intersection-related collisions; AADT1 = average daily traffic volume on the major road; and AADT2 = average daily traffic volume on the minor road. The following are the base conditions to which the model applies:
The roadside hazard rating is not a restriction for a "base" intersection because no AMF is provided for roadside hazard rating. Only 11 sites in the Georgia data met the base conditions. Summary accident statistics for these sites are shown in table 96. Table 96. Summary Accident Statistics for Sites Meeting Base Conditions
Table 97 shows the validation statistics for the 11 Type I base model intersections. Table 97. Validation Statistics for Type I Base Model Intersections
1 MSE is unknown since these statistics were not given in the report (Harwood et al., 2000) 2 K: Overdispersion value The Pearson correlation coefficients indicate a negative correlation between the base model predictions and the observed number of accidents. The other statistics also indicate a relatively poor fit, although it should be considered that only eleven sites were available for this validation activity. The recommended base model for type II intersections is:
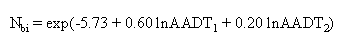
where Nbi = the expected number of annual intersection-related collisions; AADT1 = average daily traffic volume on the major road; and AADT2 = average daily traffic volume on the minor road. The following are the base conditions to which the model applies:
The number of driveways is not a restriction for a 'base' intersection because no AMF is provided for driveway density. Only nine sites in the Georgia data met the base conditions. Summary accident statistics for these sites are shown in table 98. Table 98. Summary Accident Statistics for Sites Meeting Base Conditions
Table 99 shows the validation statistics for the nine Type II base model intersections. Table 99. Validation Statistics for Type II Base Model Intersections
1 MSE is unknown since these statistics were not given in the report (Harwood et al., 2000) 2 K: Overdispersion value The Pearson correlation coefficients indicate a high correlation between the base model predictions and observed number of accidents. The other statistics, however, indicate a poor fit, although it should be considered that only nine sites were available for validation. Model V The base model in the accident prediction algorithm is identical to the Variant 3 of the Vogt model for TOTACCI.
where Nbi = predicted number of total intersection-related accidents per year for nominal or base conditions; PROT_LT = presence of protected left-turn signal phase on one or more major-road approaches; = 1 if present; = 0 if not present; PKLEFT2 = percentage of minor-road traffic that turns left at the signal during the morning and evening hours combined; VEICOM = grade rate for all vertical curves (crests and sags) within 76.25 m (250 ft)) of the intersection along the major and minor roads; PKTRUCK = percentage of trucks (vehicles with more than four wheels) entering the intersection for the morning and evening hours combined; and DRWY1 = number of driveways within 76 m (250 ft) of the intersection on the major road. With the nominal conditions of PRTO_LT, PKLEFT2, VEICOM, and PKTRUCK, the base model reduces to:
The following are the base conditions to which the model applies:
Because none of the Georgia sites met the base conditions for the base model in equation (11), and the independent variables in equation (10) are available in the Georgia data, the base model in equation (10) was used for validation. Table 113 shows the validation statistics for this base model. Because PKLEFT2 and PKTRUCK were not included in the Georgia data, they were removed from the models by dividing both sites of models by the exponential values of the coefficients of the variables times their average effects (the average effects of PKLEFT2 and PKTRUCK are the average values of PKLEFT2 and PKTRUCK). The validation statistics are shown in table 100. Lower Pearson product-moment correlation coefficients (0.36 and 0.22 in table 100) for the additional years of accidents and the Georgia data indicate that the accident predictions by the base model are not strongly correlated with additional years of accidents and are marginally correlated with the Georgia data, at best. The MPBs and MAD per year was larger than those for the original years. The MSPEs per year squared were higher than the MSEs per year squared. In particular, the MSPEs per year squared with the Georgia data were more than twice as high as the MSEs per year squared, which indicates that the model is performing poorly against the Georgia data. Table 100. Validation Statistics for Type V Base Model Intersections
1 Used the same coefficients in the Variant 3, but PKLEFT2 and PKTRUCK were removed from the model by dividing by the exponential value of the coefficient of these variables times their average effects. 2 MSE is unknown since these statistics were not given in the report (Harwood et al., 2000) 2.6.2 Validation of the Accident Prediction AlgorithmThe accident prediction algorithm was validated against the data collected in Georgia using the recommended base models and AMFs provided in Harwood et al. in 2000.(3) These AMFs are shown in table 101. The AMFs provided in a 2002 report by Harwood et al. also were validated.(5) These AMFs are shown in table 101 in brackets.
Intersection skew is defined as the deviation from an intersection angle of 90 degrees and carries a positive or negative sign that indicates whether the minor road intersects the major road at an acute or obtuse angle. Left-Turn Lane on Major takes a value of one if no left-turn lane exists on the major road and the values in table 101 where one or more exists. Right-Turn Lane on Major takes a value of one if no right-turn lane exists on the major road and the values in table 101 where one or more exists. Sight Distance in a quadrant is considered limited if the available sight distance is less than that specified by the American Association of State Highway and Transportation Officials (AASHTO) policy for left and right turns from the minor road for a design speed of 20 km/hour (km/hr) (12.5 miles/hr) less than the major road design speed.(7) In the Georgia data, design speed of the major road was not known. The posted speed limit of the major road was used in lieu of subtracting 20 km/hr (12.5 miles/hr) from the design speed when using the AASHTO warrant for sight distance. In applying the algorithm, a calibration factor is applied to the model, calculated as the ratio of the observed number of accidents to the predicted number of accidents prior to the calibration factor being applied. Harwood et al. recommend that the sample for estimating this calibration factor be such that the distribution of traffic volumes is similar to that in the data used for the original calibration.(3) This was not possible for the Georgia data due to the small sample size. It was felt that this should not create a deterrent, because the calibration factor, at least in the procedure as proposed, is independent of traffic volume and is applied to all intersections regardless of the distribution of traffic volumes in the jurisdiction. Therefore, it is of interest to examine if the procedure would work for the likely situation where the distribution of traffic volumes in the new jurisdiction is different from the distribution in the calibration data. In the tables of results, the calibration factors greater or less than 1.0 indicate whether intersections will experience more or less accidents than the intersections used in the development of the base models for the accident prediction algorithm. Table 102 shows the validation statistics for Type I intersections. For comparison, the results for the AMFs provided in the Harwood et al. 2000 report are not bracketed, and the results for AMFs provided in Harwood et al. 2002 report are in brackets.(3,5) Low Pearson product-moment correlation coefficients with the Georgia data indicate that the accident predictions by the algorithm are not correlated strongly with the observed number of accidents in the Georgia data. Other validation statistics also suggest a lack-of-fit to the Georgia data. There is little difference between the two sets of AMFs for turning lanes. Table 102. Validation Statistics for the Accident Prediction Algorithm: Type I
1 MSE is unknown since these statistics were not given in the report (Harwood et al., 2000) 2 K: Overdispersion value To compare further the two sets of AMFs for turning lanes, the validation statistics were calculated for only those sites with a major road turning lane, as shown in table 103. The AMFs from Harwood et al. (2000) provided better validation statistics than those in Harwood et al. (2002), although the differences in validation statistics and sample sizes are small.(3,5)
1 MSE is unknown since these statistics were not given in the report (Harwood et al., 2000) 2 K: Overdispersion value Table 104 shows the validation statistics for Type II intersections. For comparison, the results for the AMFs provided in Harwood et al. (2000) are not bracketed, and the results for AMFs provided in Harwood et al. (2002) are in brackets.(3,5) Low Pearson product-moment correlation coefficients with the Georgia data indicate that the accident predictions by the algorithm are not correlated strongly with the observed number of accidents in the Georgia data. Other validation statistics also suggest lack-of-fit to the Georgia data. There is little difference between the two sets of AMFs for turning lanes. Table 104. Validation Statistics for the Accident Prediction Algorithm: Type II
1 MSE is unknown because these statistics were not given in the report (Harwood et al., 2000) 2 K: Overdispersion value To compare further the two sets of AMFs for turning lanes, the validation statistics were calculated for only those sites with a major road turning lane. As the results in table 105 indicate, the AMFs from Harwood et al. (2000) provided better validation statistics than those in Harwood et al. (2002), although the differences in validation statistics and sample sizes are small.(3,5) Model V Again, the base model in the equation (10) was used for the accident prediction algorithm, because none of the sites met the nominal base conditions. PKLEFT2 and PKTRUCK were removed from the model by dividing by the exponential values of the coefficients of these variables times their average effects. Table 106 shows the validation statistics for Type V intersections. For comparison, the results for the AMFs provided in Harwood et al. (2000) are not bracketed, and the results for AMFs provided in Harwood et al. (2002) are in brackets.(3,5) The validation statistics suggest a lack-of-fit to the Georgia data.
1 MSE is unknown since these statistics were not given in the report (Harwood et al., 2000) 2 K: Overdispersion value Table 106. Validation Statistics for the Accident Prediction Algorithm: Type V
1 Used the same coefficients as Variant 3, but PKLEFT2 and PKTRUCK were removed from the model by dividing by the exponential value of the coefficient of these variables times their average effects 2 MSE is unknown since these statistics were not given in the report (Harwood et al., 2000) To compare further the two AMFs for right turn on major road, the validation statistics were calculated for only those sites with a major road right-turn lane. These results are shown in table 107. There is little difference between the two AMFs, not surprising given the closeness of their estimates.
1 MSE is unknown because these statistics were not given in the report (Harwood et al., 2000) 2.7 DISCUSSION OF RESULTSAlthough the body of this report presented validation results in order of validation exercises, the results here are presented by model, beginning with Model I results and ending with Model V results. The validation exercises in the body of this report focused primarily on external validation-validation concerned with assessing performance of the models compared to external data. This discussion is focused on internal validation concerns-the internal coherence, structure, theoretical soundness, and plausibility of the models proposed. More focus is given to internal validation in the recalibration research task scheduled to follow this validation. The discussion provided here focuses primarily on summarizing the results that are detailed and discussed in the body of this report, and translating these results into meaningful observations and conclusions. The intent of the discussion is to provide insight and lay groundwork for the recalibration of the models to follow. The reader interested in additional details, such as sources of original results and comparison tables, should refer to the body of the report. Descriptions of all variable abbreviations and definitions used in this report are found at the beginning of this document. It should be noted throughout the discussion that the subjective criteria of alpha equal to 0.10 is used. The support for this level of alpha is as follows. In statistical models of crash occurrence, a Type II error can be argued to be more serious than a Type I error. With a Type I error, the analyst concludes that the null hypothesis is false when in fact it is true with alpha probability (this translation is not precise, but the precise and correct conditional probability interpretation is cumbersome and for practical purposes does not lend any additional insights). This means that the analyst would conclude, for example, that the presence of a left-turn lane reduces crashes when in reality it does not. As a result of this conclusion one might install left-turn lanes without realizing a reduction in crashes. In addition, the relatively small sample sizes and preponderance of engineering theoretical support for variable selection decisions also supports a relatively larger alpha. A Type II error occurs with beta probability. In general, the larger the alpha, the smaller is the beta. So choosing a larger alpha means that a smaller beta has been chosen, all else being equal. Thus, continuing with the previous example, making a Type II error results in concluding that the presence of a left-turn lane does not reduce crashes when in fact it does. The risk is in failing to install an effective countermeasure. To summarize, committing a Type I error results in applying an ineffective countermeasure, while committing a Type II error results in failing to apply an effective countermeasure. Computing the actual beta in negative binomial models is extremely difficult. However, knowing that a fairly liberal alpha equal to 0.10 has been used suggests that a smaller level of beta has also been selected. GOF statistics provide an ability to objectively assess the fit of a model to data. Comparisons between models, however, are generally subjective. In the following analyses the terms "serious," "moderate," and "marginal" are applied to denote a subjective evaluation of GOF comparisons between models. Serious differences in GOF are suggestive of noteworthy or significant model deficiencies. Moderate differences in GOF suggest cases where models could be improved, but improvements might be difficult to obtain. Marginal differences in GOF are thought to be negligible and are potentially explained by random fluctuations in the observed data. Before discussing the results, it should be noted that an attempt to reproduce variables in data acquired from the original research revealed some definitional problems. These definitional problems resulted in values of some variables that are different than they would have been in the original research. Small differences in the variable VCI1 for Models I and II are thought to stem from an inability to reproduce "exceptional" cases of vertical curvatures encountered in the database. For Model II, the variables AADT1 and DEV had small differences in the median values, and these were considered to be marginal. For Model V, the vertical-alignment related variables VEI1, VEI2, and VEICOM computed in the original models could not be reproduced precisely in data acquired from the original researchers. For Models III and IV, all of the variables in data acquired from the original researchers were reproduced within rounding-error precision. These differences, on the whole, are unlikely to materially affect the overall conclusions, although they may contribute to an explanation for some individual results. 2.7.1 Model IPredictive Ability Across Time To the extent possible, new data were collected from later time periods to validate the crash models (see table 3). Note that it was discovered subsequent to the analysis and draft report that some errors exist in the accident data due to changing mileposts although these errors are negligible and would have no effect on any conclusions drawn from the analysis. Table 4 shows a comparison of the parameter estimates for the original published total accidents model and one based on the additional data. As might be expected, variables that were not statistically significant in the original model were not statistically significant in the model based on additional years of data, with one exception. The variable SPD1 became a highly significant variable, compared to marginally significant in the original model, while, conversely, the RT MAJ and HAZRAT1 became statistically insignificant, with the former having the opposite sign. Table 5 shows the GOF statistics of Model I (total accidents model) on the additional years of data. The evidence in the table suggests that the original model is predicting future crashes as well as for the calibration data. All of the GOF statistics showed marginal differences between the validation data and the calibration (estimation) data. Predictive Ability Across Space Georgia data were used to investigate the model's performance across jurisdictional boundaries. Data used to estimate Model I were obtained from Minnesota. Comparison of the recalibrated and original models for TOTAL crashes (table 53) shows that HI1, HAU, and RT MAJ had the opposite sign for the Georgia data, with RT MAJ becoming insignificant for Georgia. For INJURY crashes, all model variables, with the exception of the main road AADT, were insignificant when estimated with Georgia data, and HI1, RT MAJ, HAU, and SPD1 had the opposite signs than those in the original model (table 55). The validation statistics for the TOTAL crashes model (see table 54) show that the correlation coefficient (0.66) between observed and predicted crashes is reduced by about 50 percent (0.31) on Georgia data-a rather serious drop. Other statistics also show considerable lack-of-fit of the Georgia data relative to the Minnesota data. The MSE per year squared of 0.19 for the recalibrated model compares to an MSPE per year squared of 0.89, which represents a serious difference in fit. This difference suggests that the original model is not capturing the variability in crashes in the Georgia data. Eleven sites in Georgia were available for validating the base condition for the crash prediction algorithm (see table 96). Despite the small sample size, the correlation coefficient between predicted and observed crashes for the base condition model was -0.26 (see table 97), indicating a marginal to moderate model deficiency-downgraded from serious due to the small sample size. Because of the small sample size and the homogenous nature of the intersections (all possess base conditions in common), the base model predicts as a function of minor and major road AADTs only. Model I Assessment and Conclusions The model for three-legged stop controlled intersections with two lanes both on minor and major roads has fairly mixed validation results. The major assessments and conclusions derived from the analysis include the following:
2.7.2 Model IIPredictive Ability Across Time To the extent possible, new data were collected from later time periods to validate the crash models. Note that Minnesota data were used in the original model calibration (estimation), and only the additional years of data for Minnesota data could be used for the validation test across time. It was discovered subsequent to the analysis and draft report that some errors exist in the accident data due to changing mileposts, although these errors are negligible and would have no effect on any conclusions drawn from the analysis. Table 13 shows a comparison of the parameter estimates for the original TOTAL crash model and one based on the additional years of data. The constant term and all variables had the same signs, but most had large differences in magnitude, in particular those with low significance in both models. The model based on additional years gains the HI1 variable as statistically significant. Table 14 shows the GOF statistics of the Type II (TOTAL crashes model) on additional years of data. The linear correlation coefficient shows consistent performance into the future, and a comparison of MSE per year squared (0.095) and MSPE per year squared (0.185) suggests that the variability in future crashes is not being captured as well as for the data on which the original model is based. Predictive Ability Across Space Georgia data were used to investigate the model's performance across jurisdictional boundaries (see table 57). Data used to estimate Model II were obtained from Minnesota. Comparison of the original (Minnesota) and Georgia models for TOTAL crashes (table 58) shows that the two AADT variables had similar magnitudes and are the only variables the two models shared as statistically significant. The variable SPD1 became statistically significant for Georgia, whereas the variable DRWY1 was statistically significant in the original (Minnesota) model. For INJURY crashes, the models again shared statistically significant AADT related variables, while the only other statistically significant variable was HAZRAT1 in the original (Minnesota) model (see table 60). The validation statistics for TOTAL crashes (see table 59) show that the correlation coefficient between observed and predicted crashes is reduced by about 50 percent on Georgia data-a rather serious drop. Other statistics show a moderate to serious increase in lack-of-fit, including increases in MAD (moderate) and a serious increase in MSPE per year squared (1.73) compared to MSE per year squared (0.10) in the original model. Crash Prediction Algorithms Nine sites in Georgia were available for validating the base condition for the crash prediction algorithm (see table 98). The correlation coefficient between predicted and observed crashes for the base condition model was 0.81 (see table 99), indicating a strong linear trend between observed and predicted values. Model II Assessment and Conclusions The model for four-legged stop controlled intersections with two lanes both on minor and major roads has fairly mixed validation results-although they are more favorable than for Model Type I. The major assessments and conclusions derived from the analysis include the following:
2.7.3 Model IIIPredictive Ability Across Time To the extent possible, new data were collected for additional time periods to validate the crash models (see table 21). Data from Michigan and California from the years 1996 and 1997 were used for the validation effort. Recall that the original model was calibrated on data from Michigan and California from 1993 to 1995. Table 22 shows a comparison of the parameter estimates for the original published TOTAL crash model and one based on additional years of data. Comparison of the original model and the model based on the later data reveals that two variables, MEDWDTH1 and DRWY1, have become statistically insignificant in the additional years model. In addition, the coefficient for log of AADT2 is 0.26 in the original model and 0.52 in the model based on the additional years of data. The re-estimated models for INTERSECTION RELATED total and INJURY crashes (variant 1 and variant 2) are shown in table 24, table 26, and table 28. For the INTERSECTION RELATED total crash model, the additional years of data did not produce statistically significant variables for MEDWDTH1 and DRWY1, while the original model did, and again, the coefficient for log of AADT2 was twice as large for the additional years model. Considering variant 1 of the INJURY models, the variable HAU was not statistically significant for the additional years of data; that is unlike the case for the original calibrated model, and the coefficient for log of AADT2 was again twice as large for the additional years model. Considering variant 2, the variables HAU, DRWY1, and ABSGRD1 became statistically significant for the additional years of data. Table 23 shows the GOF statistics of Model III for TOTAL crashes on additional years of data. The linear correlation coefficient shows a moderate decline when calculated on the additional years of data. A comparison of MSE per year squared (1.22) and MSPE per year squared (1.39) suggests a marginal increase in lack-of-fit. Similarly, the MAD per year shows a marginal increase in lack-of-fit. Table 25, for INTERSECTION RELATED crashes, shows similar performance assessments as the model for TOTAL crashes. Predictive Ability Across Space Georgia data were used to investigate the model's performance across jurisdictional boundaries. A comparison of Georgia data for Model III is shown in table 62. The table shows that many variables have similar magnitudes across the calibration (California and Michigan) and validation (Georgia) data sets. The one notable exception is MEDWIDTH1, which is considerably larger in the Georgia data than in the original data. More than half of the Georgia sites had medians on the major road compared to only 5.8 percent of the original sites. Comparison of the original and Georgia models for TOTAL crashes (table 63) shows that the models are quite different. In fact, only the variable log of AADT2 is statistically significant in the model calibrated using Georgia data, while the original published model had all variables, log of AADT1, log of AADT 2, MEDWIDTH1, and DRWY1, as statistically significant. Similar results are seen for the TOTAL INTERSECTION RELATED crash model (table 65), and variant 1 (table 67) and variant 2 (table 69) of the INJURY crash models. Thus, a serious lack of agreement between the originally calibrated models and the models estimated using Georgia data is observed. All of the validation statistics (see table 64 and table 66) are consistent with the lack of agreement in model specification between original and Georgia data. The correlation between predicted and observed is seriously different on Georgia data. The MPB and MAD statistics show a significant worsening of the fit. Finally, the MSE per year squared for the calibration data is considerably lower than the MSPE per year squared for Georgia data. The plots of observed and predicted crashes for individual intersections in figures 5 and 6 shows that predictions are much less variable than are observations. Thus it is likely that some of the explanatory variables are inadequate for predicting Georgia data. There are no AMFs to validate for Model III. Model III Assessment and Conclusions The model for three-legged stop controlled intersections with two lanes on minor and four lanes on major roads revealed some serious model concerns. These concerns are summarized below:
2.7.4 Model IVPredictive Ability Across Time To the extent possible, new data were collected from later time periods to validate the crash models (see table 30). Data from Michigan and California from 1996 and 1997 were used for this validation effort. Recall that the original model was calibrated on data from Michigan and California from 1993 to 1995. Table 31 shows a comparison of the parameter estimates for the original published TOTAL crash model and one based on the additional years of data. Comparison of the original model and the model based on the later data reveals that the model performs very well on later data-all of the variables in the model are statistically significant in both models. The largest difference is the coefficient of log of AADT2, which changes from 0.32 in the original published model to 0.50 in the additional years model. All other coefficients are similar in magnitude and share the same sign. The same minor differences exist for the INTERSECTION RELATED total crash model, shown in table 33. For the INJURY crash model (see table 38) and the INTERSECTION RELATED INJURY crash model (see table 40), the variable log of AADT1 becomes statistically insignificant on additional years of data. Table 32 shows the GOF statistics of Model IV for TOTAL crashes on the additional years of data. The linear correlation coefficient shows a marginal increase when calculated on the additional years of data. A comparison of MSE per year squared (3.40) and MSPE per year squared (2.39) suggests a moderate improvement in the fit to later data. The MADs per year is similar, but the MPBs per year indicates a serious lack-of-fit to later years of data. Table 34 shows similar performance assessments for the INTERSECTION RELATED total crash model. Predictive Ability Across Space Georgia data were used to investigate the model's performance across jurisdictional boundaries. A comparison of TOTAL crashes compared to Georgia data for Model IV is shown in table 71. The table shows that many variables are similar across the calibration (California and Michigan) and validation (Georgia) data sets, with the exception of LTLNS, which is moderately smaller (70 percent had left-turn lanes) in the calibration data (Michigan and California) than in the validation (Georgia) data, where 83 percent had left-turn lanes. Some mathematical "work-arounds" had to be performed to circumvent a missing data problem in the validation data set. The coefficient for log of AADT2 becomes insignificant in Georgia; and the sign of LTLN1S changes from negative to positive, meaning that in the calibration data the presence of a left-turn lane is associated with decreased TOTAL crashes, while in Georgia the presence of a left-turn lane is associated with increased TOTAL crashes. All of the validation statistics (see table 75) are at least consistent with the lack of agreement in model specification between original and Georgia data, and perhaps suggest a more substantial departure. The correlation between predicted and observed is significantly reduced, going from 0.56 (original) to 0.05 and 0.08 (Georgia). The MPB and MAD statistics show a moderate increase in lack-of-fit. Finally, the MSE per year squared (3.62) for the calibration data is moderately lower than the MSPE per year squared (4.63) for Georgia data. The plot of observed and predicted crashes for individual intersections in figure 9 shows that predictions are much less variable than are observations. Thus it is likely that some of the explanatory variables are inadequate for predicting Georgia data. The models for INTERSECTION RELATED and the two variants for INJURY crashes are more seriously deficient than the TOTAL crash models. None of the models had statistically significant variables that corresponded with the original models. Table 76, table 78, and table 80 show the serious differences between original published models and the models estimated using Georgia data. There are no AMFs to validate for Model IV. Model IV Assessment and Conclusions The model for four-legged stop controlled intersections, two lanes on minor roads, and four lanes on major roads revealed model deficiencies ranging from moderate to serious. These concerns are summarized below:
2.7.5 Model VPredictive Ability Across Time To the extent possible, new data were collected from later time periods to validate the crash models (see table 39). Data from Michigan and California from years 1996 and 1997 were used for the validation effort. Recall that the original model was calibrated on data from Michigan and California from 1993 to 1995. For signalized intersections in Michigan, the accident data for 1996 and 1997 did not include the crossroad accidents where the crossroad was a State route, because the crossroad milepost information was not available at the time of analysis. As a result, the later year crossroad accident numbers of the State routes should be systematically higher than those supposed to be. However, these differences would not have any effect on the conclusions drawn from the analysis. Table 40 shows a comparison of the parameter estimates for the original published TOTAL crash model and one based on the later data. This comparison reveals that there are moderate to serious differences between the models. PKLEFT2 and VEICOM are not statistically significant in the model based on additional years of data. Table 41 shows the GOF statistics of Model V for TOTAL crashes on the later data. The linear correlation coefficient between observed and predicted data shows a moderate to serious decrease when calculated on future year data (0.73 to 0.40). A comparison of MSE per year squared (8.56) and MSPE per year squared (21.19) suggests a poor fit to the additional years of data. The MAD per year shows a moderate increase in lack-of-fit, while the MPB per year indicates a serious lack-of-fit. Table 42, 44, 46, 48, and 50 for INTERSECTION RELATED TOTAL and INJURY crash models and their variants also show serious differences between the original and models based on later data. However, the models are deficient in different ways, with different sets of variables becoming statistically insignificant. Predictive Ability Across Space Georgia data (see table 82) were used to investigate the model's performance across jurisdictional boundaries. A comparison of TOTAL crashes compared to Georgia data for model V is shown in table 84. The table shows moderate to serious departures between the original published models and the models based on Georgia data. The variables PROT_LT, log of AADT2, and VEICOM were not statistically significant in the Georgia data. All of the validation statistics (see table 85) are consistent with the serious lack of agreement in model specification between original and Georgia data. The correlation between predicted and observed is substantially reduced, going from 0.73 (original) to 0.18 (Georgia). The MPB per year and MAD per year statistics show a poor fit. Finally, the MSE per year squared for the calibration data is significantly lower than the MSPE per year squared for Georgia data, again suggesting a serious deficiency. The plot of observed and predicted crashes for individual intersections in figure 13 shows that predictions are much less variable than are observations, and also shows some systematic prediction error, with a tendency to overpredict crashes. The predictive ability of the models and their variants for INTERSECTION RELATED Total and INJURY crashes are difficult to assess, since the original models could not be duplicated with similar results. Specifically, many or all of the statistically significant variables in the original published models could not be duplicated in the recalibration-so assessing the predictive ability is difficult, at best. Fifty-one sites in Georgia were available for validating the base condition equation for the crash prediction algorithm (see table 100). The correlation coefficient between predicted and observed crashes for the base condition model was 0.22, indicating a weak linear trend between observed and predicted values, and a serious to moderate decline from the same statistics calculated on the original published data (0.68 and 0.36 for different base years). Other statistics show moderate to serious lack-of-fit. Model V Assessment and Conclusions The model for signalized intersections of two-lane roads revealed model deficiencies ranging from moderate to serious. These concerns are summarized below:
|
||||||||||||||||||||||||||||||||||||||||||||||||||||||||||||||||||||||||||||||||||||||||||||||||||||||||||||||||||||||||||||||||||||||||||||||||||||||||||||||||||||||||||||||||||||||||||||||||||||||||||||||||||||||||||||||||||||||||||||||||||||||||||||||||||||||||||||||||||||||||||||||||||||||||||||||||||||||||||||||||||||||||||||||||||||||||||||||||||||||||||