U.S. Department of Transportation
Federal Highway Administration
1200 New Jersey Avenue, SE
Washington, DC 20590
202-366-4000
Federal Highway Administration Research and Technology
Coordinating, Developing, and Delivering Highway Transportation Innovations
 |
| This report is an archived publication and may contain dated technical, contact, and link information |
|
Publication Number: FHWA-HRT-04-091
Date: August 2004 |
|||||||||||||||||||||||||||||||||||||||||||||||||||||||||||||||||||||||||||||||||||||||||||||||||||||||||||||||||||||||||||||||||||||||||||||||||||||||||||||||||||||||||||||||||||||||||||||||||||||||||||||||||||||||||||||||||||||||||||||||||||||||||||||||||||||||||||||||||||||||||||||||||||||||||||||||||||||||||||
Signalized Intersections: Informational GuidePDF Version (10.84 MB)
PDF files can be viewed with the Acrobat® Reader® CHAPTER 4 — TRAFFIC DESIGN AND ILLUMINATIONTABLE OF CONTENTS 4.0 TRAFFIC DESIGN AND ILLUMINATION 4.1 Traffic Signal Control Type 4.2.1 “Permissive-Only” Left-Turn phasing 4.2.2 “Protected-Only” Left-Turn phasing 4.2.3 Protected-Permissive Left-Turn phasing 4.2.5 Prohibited Left-Turn phasing 4.3 Vehicle and Pedestrian Displays 4.4 Traffic Signal Pole Layout 4.7 Basic Signal Timing parameters 4.7.2 Vehicle timing—Green interval 4.7.3 Vehicle timing—Detector Timing 4.7.4 Vehicle timing—Vehicle Clearance 4.7.5 Vehicle timing—Cycle Length 4.8 Signing and Pavement Marking Design
LIST OF FIGURES
LIST OF TABLES 4.0 Traffic Design and IlluminationThis chapter deals with the traffic signal hardware and software the infrastructure that controls the assignment of vehicular and pedestrian right-of-way at locations where conflicts or hazardous conditions exist. The proper application and design of the traffic signal is a key component in improving the safety and efficiency of the intersection. This chapter presents an overview of the fundamental principles of traffic design and illumination as they apply to signalized intersections. The topics discussed include:
4.1 Traffic Signal Control TypeTraffic signals operate in either pre-timed or actuated mode. Pre-timed signals operate with fixed cycle lengths and green splits. Actuated signals vary the amount of green time allocated to each phase based on traffic demand. Either type may be used in isolated (independent) or coordinated operation. Most pre-timed controls feature multiple timing plans, with different cycle, split, and offset values for different periods of the day. Actuated control does not rely on a fixed cycle length unless the intersection is in a coordinated system or under adaptive control. Actuated control provides variable lengths of green timing for phases that are equipped with detectors. The time for each movement depends on the characteristics of the intersection and timing parameters (which are based on demand at the intersection). 4.2 Traffic Signal PhasingThe MUTCD defines a signal phase as the right-of-way, yellow change, and red clearance intervals in a cycle that are assigned to an independent traffic movement or combination of traffic movements.(1) Signal phasing is the sequence of individual signal phases or combinations of signal phases within a cycle that define the order in which various pedestrian and vehicular movements are assigned the right-of-way. The MUTCD provides rules for determining controller phasing, selecting allowable signal indication combinations for displays on an approach to a traffic control signal, and determining the order in which signal indications can be displayed. Signal phasing at most intersections in the United States makes use of a standard National Electrical manufacturers association (NEMA) ring-and-barrier structure, shown in figure 23. This structure organizes phases to prohibit conflicting movements (e.g., eastbound and southbound through movements) from timing concurrently while allowing nonconflicting movements (e.g., northbound and southbound through movements) to time together. Most signal phasing patterns in use in the United States can be achieved through the selective assignment of phases to the standard NEMA ring-and-barrier structure.
Depending on the complexity of the intersection, 2 to 8 phases are typically used, although some controllers can provide up to 40 phases to serve complex intersections or sets of intersections. Pedestrian movements are typically assigned to parallel vehicle movements. Developing an appropriate phasing plan begins with determining the left-turn phase type at the intersection. The most basic form of control for a four-legged intersection is “permissive only” control, which allows drivers to make left turns after yielding to conflicting traffic or pedestrians and provides no special protected interval for left turns. As a general rule, the number of phases should be kept to a minimum because each additional phase in the signal cycle reduces the time available to other phases. Provision of a separate left-turn lane may alleviate the problems somewhat by providing storage space where vehicles can await an adequate gap without blocking other traffic movements at the intersection. In most cases, the development of a signal phasing plan should involve an analytical analysis of the intersection. Several software packages are suitable for selecting an optimal phasing plan for a given set of geometric and traffic conditions for both individual intersections and for system optimization. Pedestrian movements must be considered during the development of a phasing plan. For example, on wide roadways pedestrian timing may require timing longer than what is required for vehicular traffic, which may have an effect on the operation analysis. 4.2.1 “Permissive-Only” Left-Turn phasing"Permissive-only" (also known as "permitted-only") phasing allows two opposing approaches to time concurrently, with left turns allowed after yielding to conflicting traffic and pedestrians. One possible implementation of this phasing pattern is illustrated in figure 24. Note that the two opposing movements could be run in concurrent phases using two rings; for example, the eastbound and westbound through movements shown in figure 24 could be assigned as phase 2 and phase 6, respectively.
For most high-volume intersections, “permissive-only” left-turn phasing is generally not practical for major street movements given the high volume of the intersections. Minor side street movements, however, may function acceptably using “permissive-only” left-turn phasing, provided that traffic volumes are low enough to operate adequately and safely without additional left-turn protection. "Permissive-only" displays are signified by a green ball indication. In this case, no regulatory sign is required, but the MUTCD (sections 2B.45 and 4D.06) allows the option of using the R10-12 regulatory sign ("LEFT TURN YIELD ON GREEN (symbolic green ball)").(1) As traffic volumes increase at the intersection, the number of adequate gaps to accommodate left-turning vehicles on the permissive indication may result in safety concerns at the intersection. Common signal head arrangements that implement “permissive only” phasing are shown in figure 25; refer to the MUTCD for other configurations.
4.2.2 “Protected-Only” Left-Turn phasing"Protected-only" phasing consists of providing a separate phase for left-turning traffic and allowing left turns to be made only on a green left arrow signal indication, with no pedestrian movement or vehicular traffic conflicting with the left turn. As a result, left-turn movements with "protected-only" phasing have a higher capacity than those with "permissive-only" phasing due to fewer conflicts. This phasing pattern is illustrated in figure 26. Typical signal head and associated signing arrangements that implement "protected-only" phasing are shown in figure 27; refer to the MUTCD for other configurations. Chapter 12 of this document provides guidance on determining the need for protected left turns.
4.2.3 Protected-Permissive Left-Turn phasingA combination of protected and permissive left-turn phasing is referred to as protected-permissive left-turn (PPLT) operation. This phasing pattern is illustrated in figure 28. A typical signal head and associated signing arrangement that implements protected-permissive phasing is shown in figure 29; refer to the MUTCD for other configurations.
Observed improvements in signal progression and efficiency combined with driver acceptance have led to expanded usage of PPLT over the years. PPLT signals offer numerous advantages when compared to “protected-only” operation. These advantages are associated with both protected-permissive and lead-lag operation. They include the following (adapted with additions by the authors):(48)
Some disadvantages include the following:
The controller phasing for protected-permissive mode is the most complicated phasing because of the safety implications created by the potential of what is known as the “yellow trap.” In a permissive-mode operation, the left-turning driver must obey the green display for the adjacent through movement, which also gives permission for the permissive left turn. When the yellow display for the adjacent through movement appears, the left-turning driver ordinarily expects the opposing through display to be yellow as well. The driver may now mistakenly believe that the left turn can be completed on the yellow display or immediately thereafter when the opposing through display will be red. For ordinary lead-lead operation where both protected left-turn phases precede the permissive phases, this is not a concern, as both permissive phases end concurrently. However, this problem can occur when a permissive left turn is opposed by a lagging protected left turn. In this type of operation (known as lag-permissive), the yellow display seen by a left-turning driver is not indicative of the display seen by the opposing through driver. The opposing through display may be yellow or may remain green. A driver who turns left believing that the opposing driver has a yellow or red display when the opposing driver has a green display may be making an unsafe movement. This yellow trap is illustrated in figure 30. Drivers who encounter this trap are those that attempt to make a permissive left-turn after a protected leading left-turn phase. Typically they have entered the intersection on a permissive green waiting to make a left turn when sufficient gaps occur in opposing through traffic. If the absence of gaps in opposing through traffic requires them to make their turn during the left-turn clearance interval, they may be “stranded" in the intersection because of the absence of gaps and because the opposing through movement remains green. More importantly, they may incorrectly presume that the opposing through traffic is being cleared at the same time that the adjacent through movement is being terminated. Therefore, they may complete their turn believing that opposing vehicles are slowing to a stop when in fact the opposing vehicles are proceeding into the intersection with a green ball signal indication. There are two ways to eliminate the yellow trap. First, the phase sequence at the intersection can be restricted to simultaneous leading (lead-lead) or lagging (lag-lag) left-turn phasing. Second, the signal display can be altered to allow the left-turn signal head to display a permissive left turn independently of the adjacent through movements, which allows the through movements to terminate but allow a permissive left turn to continue during the opposite approach’s lagging protected left-turn phase. Some agencies have experimented with signal displays (e.g., “Dallas Display,” flashing circular red, flashing red arrow, flashing circular yellow, and flashing yellow arrow) that allow this type of operation. Of these, the “Dallas Display” optically restricts the visibility of the permissive movement using louvers; it is fully compliant with the MUTCD and is shown in figure 31.
A national NCHRP study, has examined the operational advantages and safety aspects of various PPLT control devices and signal arrangements. The study determined that a flashing yellow arrow PPLT display was consistently found to be equal or superior to existing PPLT displays both in a laboratory environment and in cities where the display was experimentally implemented in the field.(49) The flashing yellow arrow display for PPLT is still considered experimental by the MUTCD and is undergoing further field testing. 4.2.4 Split PhasingSplit phasing consists of having two opposing approaches time consecutively rather than concurrently (i.e., all movements originating from the west followed by all movements from the east). Split phase can be implemented in a variety of ways depending on signal controller capabilities and how pedestrian movements are treated. Three basic variations, shown in figure 32, are described as follows:
Split phasing is used infrequently at signalized intersections because a more efficient conventional phasing plan can usually be found. The following conditions could indicate that split phasing might be an appropriate design choice:
No standard method is provided in the MUTCD for indicating split phasing at an intersection, and the methods vary considerably depending on what type of phasing sequence has been used. A common way to implement method A or B described above involves using a four-section head displaying both a green ball and a green left-turn arrow simultaneously, as shown in figure 33. This method does not require the use of additional signs. Note that additional measures are needed with method C, as the protected left-turn arrow conflicts with the concurrent pedestrian phase, as follows:(50)
4.2.5 Prohibited Left-Turn phasingAn alternative to providing a left-turn phase is to prohibit left-turn movements at the subject intersection. Under this scenario, left-turning drivers would be required to divert to another facility or turn in advance or beyond the intersection via a geometric treatment such as a jughandle or median U-turn. Left-turns can be prohibited on a full- or part-time basis. The amount of traffic diverted, effects on transit routes, the adequacy of the routes likely to be used, and community impacts are all important issues to consider when investigating a turn prohibition. A variety of treatments that redirect left turns are discussed in chapter 10. 4.2.6 Right-Turn phasingRight-turn phasing may be controlled in a permissive or protected manner with different configurations depending on the presence of pedestrians and lane configuration at the intersections. Right turns have been operated on overlap phases to increase efficiency for the traffic signal. An overlap is a set of outputs associated with two or more phase combinations. As described earlier, various movements can be assigned to a particular phase. In some instances, right-turn movements operating in exclusive lanes can be assigned to more than one phase that is not conflicting. In this instance, a right turn is operated at the same time as the left turn, as shown in figure 34. The overlap forms a separate movement that derives its operation from its assigned phases (also called parent phases); for example, overlap A (OL A) is typically assigned to phase 2 (the adjacent through phase) and phase 3 (the nonconflicting left-turn phase from the cross street). During a transition between two parent phases, the overlap will remain green. To implement this type of true overlap, a three-section head with limited visibility must be used, as the right-turn display may be different from the adjacent through phase.
More commonly, a five-section head with a combination of circular and arrow indications is used. Note that the MUTCD requires the display of a yellow change interval between the display of a green right-turn arrow and a following circular green display that applies to the continuing right-turn movement on a permissive basis. This yellow change interval is necessary to convey the change in right-of-way from fully protected during the green arrow to requiring a yield to pedestrians and other vehicles during the circular green. This can be implemented by assigning the right-turn arrows to the same phase as the nonconflicting left-turn phase on the cross street and the circular indications to the same phase as the adjacent through movement. A typical five-section signal head that implements protected-permissive right-turn phasing is shown in figure 35; refer to the MUTCD for other configurations.
Figure 35. Common signal head and signing arrangements for right-turn-overlap phasing. This type of operation increases efficiency by providing more green time to this right-turn movement but may compromise the intersection’s usability for visually impaired pedestrians. The transition from the protected right-turn movement on the green arrow to the permissive right-turn movement on the green ball masks the sound of the adjacent through vehicles. This makes it difficult for visually impaired pedestrians to hear when the adjacent through vehicles begin to move, which is used as an audible cue for crossing the street. Therefore, the use of accessible pedestrian signals to provide an audible indication of the start of the pedestrian phase may be needed to restore this cue. 4.3 Vehicle and Pedestrian DisplaysSignal displays can be generally categorized into those for vehicles and for pedestrians. The following sections discuss each type. 4.3.1 Vehicle DisplaysThe location of signal heads should be evaluated based on visibility requirements and type of signal display. While signal head placement is governed by MUTCD requirements for signal displays (discussed earlier in this chapter), the specific placement of signal heads is typically determined by local policies. When designing the placement of signal heads, the following should be considered in addition to the minimum requirements described in the MUTCD:
At large signalized intersections, the safety and operation of the intersection may be enhanced through the use of additional signal heads, some of which are standard in some states. Figure 36 shows a typical intersection design with five types of optional heads: Optional Head #1: This is a near-right-side side head that can be used to provide an advanced head at wide intersections as well as provide a supplemental head for vehicles that are unable to see the signal heads over the lanes due to their position behind large vehicles (trucks, etc.). Optional Head #2: This is an extra through head that can be used to supplement the overhead signal heads. This head provides an indication for vehicles that might be behind large vehicles and may be more visible than the overhead signal head when the sun is near the horizon. Optional Head #3: This is an extra left-turn head that can be used to guide left-turning vehicles across a wide intersection as they make their turn. It also helps visibility for vehicles behind large vehicles and for times of day when the sun is near the horizon. Optional Head #4: This is a near-left-side head that can be used to provide an advance indication if visibility is hampered by a curve in the road upstream of the intersection. Optional Head #5: This is a head that can be used to provide a display in direct view of a right-turn lane and can also be used to provide a right-turn overlap phase in conjunction with the nonconflicting left-turn phase on the cross street. The head should contain either three circular balls or be a five-section head with three balls and two right-turn arrows due to the concurrent pedestrian crossing.
4.3.2 Pedestrian DisplaysAccording to section 4E.03 of the 2003 MUTCD, pedestrian signal heads must be used in conjunction with vehicular traffic control signals under any of the following conditions:(1)
Pedestrian signals should be used under the following conditions:
The MUTCD provides specific guidance on the type and size of pedestrian signal indications (Section 4E.04). As noted in the MUTCD, all new pedestrian signals should use the UPRAISED HAND (symbolizing DON’T WALK) and WALKING PERSON (symbolizing WALK) indications, shown in figure 37. The pedestrian displays must be mounted so that the bottom of the pedestrian signal display housing (including mounting brackets) is no less than 2.1 m (7 ft) and no more than 3 m (10 ft) above sidewalk level.(1)
Some signalized intersections have factors that may make them difficult for pedestrians who have visual disabilities to cross safely and effectively. As noted in the MUTCD (section 4E.06), these factors include:(1)
To address these challenges, accessible pedestrian signals have been developed to provide information to the pedestrian in a nonvisual format, such as audible tones, verbal messages, and/or vibrating surfaces. Detail on these treatments can be found in the MUTCD(1) and in several references sponsored by the U.S. Access board and the National Cooperative Highway Research Program (NCHRP).(51,52,53) 4.4 Traffic Signal Pole LayoutThree primary types of signal configurations display vehicle signal indications:
Table 13 identifies the advantages and disadvantages of each configuration. Table 13. Advantages and disadvantages of various configurations for displaying vehicle signal indications.
In addition to providing support for the optimal location of vehicle and pedestrian signal indications, signal poles need to be located carefully to address the following issues:
The MUTCD,(1) the ADAAG,(33) and the AASHTO Roadside Design Guide(54) all contain guidance regarding the lateral placement of signal supports and cabinets. Generally, signal poles should be placed as far away from the curb as possible, not conflict with the pedestrian walking paths, and be located for easy access to the pushbuttons by disabled pedestrians. In some circumstances, it may be difficult or undesirable to locate a single pole that adequately serves both pedestrian ramps and provides adequate clearances. In these cases, one or more pedestals with the pedestrian signal heads and/or pushbuttons should be considered to ensure visibility of the pedestrian signal heads and accessibility to the pushbuttons. 4.5 Traffic Signal ControllerThe traffic controller is the brain of the intersection. There are two general categories of traffic signal controllers: pre-timed and actuated. In the past two decades, most electro-mechanical and early solid-state controllers have been replaced with NEMA, 170, and advanced traffic controllers (ATC), even in locations where the signal is operated in a pre-timed mode. Although most modern controllers can perform the functions needed at typical signalized intersections, some may not be able to handle: more complicated configurations (e.g., intersections with more than four legs or two closely spaced intersections); communications with other controllers of dissimilar brands; or accommodation of priority treatments (e.g., transit priority). Therefore, the choice of controller may play a significant role in the types of treatments that can be considered at a signalized intersection. Traffic controllers can be generally classified into three types: 1. NEMA. 2. Type 170. 3. ATC. Some advantages and disadvantages of each type are described in table 14. Table 14. Traffic signal controller advantages and disadvantages.
In locating the controller cabinet, consider the following:
4.6 Detection DevicesThe detectors (or sensors) at an intersection inform the signal controller that a vehicle, pedestrian, or bicycle is present at a defined location within the intersection or signal system. The controller then uses this information to determine the amount of green time and the signal phases to serve. 4.6.1 Vehicle DetectionTable 15, excerpted from the final draft of the Traffic Detector Handbook, 2003 edition, presents an overview of the strengths and weaknesses of commercially available detector technology.(55) The good performance of in-roadway detectors such as inductive loops, magnetic, and magnetometer detectors is based, in part, on their close location to the vehicle, which makes them insensitive to inclement weather due to a high signal-to-noise ratio. Their main disadvantage is their in-roadway installation, necessitating physical changes in the roadway as part of the installation process. In addition, in-roadway detectors may be damaged or disrupted by utility cuts, pavement milling operations for resurfacing, and movement of pavement joints and cracks. Over-roadway detectors often provide data not available from in-roadway sensors, and some can monitor multiple lanes with one unit. The reader is encouraged to refer to the Traffic Detector Handbook for further discussion on detector technology. Vehicle detectors provide advanced detection, left-turn lane presence detection, and stop-bar presence detection. Advanced detection extends a green signal to get an approaching vehicle through the signal. Left-turn lane presence detection detects left-turning vehicles that are waiting. Stop-bar presence detection will pick up any vehicles that may have entered to roadway from driveways and vehicles that might not have made it though the intersection on the previous green. A fourth detector function is as a system detector. On many large streets with coordinated signal systems, system detectors are used to collect midblock vehicle volume and occupancy data, which is analyzed by a master signal controller or central system to determine whether signal timing changes are needed. The location of the system detectors varies based on the signal system and software being used, but typically they are located downstream of the intersection on the major roadway. The location of the advanced detectors is often based on the dilemma zone boundary. The dilemma zone is that portion of the approach where a driver suddenly facing a yellow indication must make a decision whether to stop safely or to proceed through the intersection. As a result, the dilemma zone boundary is typically dictated by the minimum stopping distance. The actual distances vary by jurisdictional policies and should be reviewed before the traffic signal is designed. The typical location for advance detectors based on stopping sight distance is shown in table 16. Table 15. Strengths and weaknesses of commercially available detector technologies.
Source: Adapted from reference 55. Table 16. Location of advanced vehicle detectors.
As shown in table 16, the stopping distance can be computed for both the average stopping condition as well as the probability ranges for stopping. For most large intersections, a multiple-loop design should be used to account for the higher speeds and probabilities of stopping. More detailed information on detector placement, including the results of several calculation methods, can be found in the Manual of Traffic Detector Design.(58) 4.6.2 Pedestrian DetectionPedestrian detection at actuated signals is typically accomplished through the use of pedestrian push buttons. Accessible pedestrian signal detectors, or devices to help pedestrians with visual or mobility impairments activate the pedestrian phase, may be pushbuttons or other passive detection devices. For pushbuttons to be accessible, they should be placed in accordance with the guidance in the MUTCD and located as follows (sections 4E.08 and 4E.09):(1)
Alternative methods of pedestrian detection, including infrared and microwave detectors, are emerging. Additional information on these devices can be found in FHWA’s Pedestrian Facilities User Guide—Providing Safety and mobility.(35) 4.7 Basic Signal Timing ParametersSignal operation and timing have a significant impact on intersection performance. Controllers have a vast array of inputs that permit tailoring of controller operation to the specific intersection. This section provides guidance for the determination of basic timing parameters. The development of a signal timing plan should address all user needs at a particular location including pedestrians, bicyclists, transit vehicles, emergency vehicles, automobiles, and trucks. For the purposes of this section, signal timing is divided into two elements: pedestrian timing and vehicle timing. 4.7.1 Pedestrian TimingPedestrian timing requirements include a WALK interval and a flashing DON’T WALK interval. The WALK interval varies based upon local agency policy. The MUTCD recommends a minimum WALK time of 7 s, although WALK times as low as 4 s may be used if pedestrian volumes and characteristics do not require an interval of 7 s (section 4E.10).(1) The WALK interval gives pedestrians adequate time to perceive the WALK indication and depart the curb before the clearance interval (flashing DON’T WALK) begins. In downtown areas, longer WALK times are often appropriate to promote walking and serve pedestrian demand. School zones and areas with large numbers of elderly pedestrians also warrant consideration and the display of WALK time in excess of the minimum WALK time. The MUTCD states that the pedestrian clearance time should allow a pedestrian crossing in the crosswalk to leave the curb and travel to at least the far side of the traveled way or to a median of sufficient width for pedestrians to wait before opposing vehicles receive a green indication. The MUTCD uses a walk speed of 1.2 m/s (4.0 ft/s) for determining crossing times.(1) However, the Pedestrian Facilities Users Guide recommends a lower speed of 1.1 m/s (3.5 ft/s); see chapter 2 for further discussion.(35) Pedestrian clearance time is calculated using equation 1:
Pedestrian clearance time is accommodated during either a combination of flashing DON’T WALK time and yellow clearance time or by flashing DON’T WALK time alone. The recommended practice is for the pedestrian clearance time to be accommodated completely within the flashing DON’T WALK time. However, at high-volume locations, it may be necessary as a tradeoff for vehicular capacity to use the yellow change interval as part of satisfying the calculated pedestrian clearance time. 4.7.2 Vehicle timing—Green intervalIdeally, the length of the green display should be sufficient to serve the demand present at the start of the green phase for each movement and should be able to move groups of vehicles, or platoons, in a coordinated system. At an actuated intersection, the length of the green interval varies based on inputs received from the detectors. Minimum and maximum green times for each phase are assigned to a controller to provide a range of allowable green times. Detectors are used to measure the amount of traffic and determine the required time for each movement within the allowable range. The minimum green time is the amount of time allocated to each phase so that vehicles in queue at the stop bar are able to start and clear the intersection. The minimum initial green time is established by determining the time needed to clear the vehicles located between the stop bar and the detector nearest the stop bar. Where presence detection is installed at the stop bar, a minimum interval may be set to a value that is less than 1.0 s. Consider an intersection with the following properties: average vehicle spacing is 7.5 m (25 ft) per vehicle, initial start-up time is 2 s, and vehicle headway is 2 s per vehicle. For an approach with a detector located 30 m (100 ft) from the stop bar, the minimum green time is 2 + (30 m/7.5 m x 2) = 2 + (100 ft/25 ft x 2) = 10 s. The maximum green time is the maximum limit to which the green time can be extended for a phase in the presence of a call from a conflicting phase. The maximum green time begins when a call is placed on a conflicting phase. The phase is allowed to "max-out" if the maximum green time is reached even if actuations have been received that would typically extend the phase. 4.7.3 Vehicle timing—Detector TimingOne advantage of actuated control is that it can adjust timing parameters based on vehicle or pedestrian demand. The detectors and the timing parameters allow the signal to respond to varied flow throughout the day. For pedestrians, detectors are located for convenient access; for vehicles, detector spacing is a function of travel speed and the characteristics of the street. The operation of the signal is highly dependent on detector timing. More information about detector timing, including settings for various detector configurations, is found in the FHWA Traffic Detector Handbook.(55) One type of detector timing, known as volume-density timing, uses gap timers to reduce the allowable gap time the longer the signal is green. This type of timing makes the signal less likely to extend the green phase the longer the signal is green. A typical setting for a volume-density controller is to have the passage gap set to twice the calculated gap time to ensure the phase does not gap out too early. The minimum gap time might be set to less than the calculated gap time on multiple lane approaches, depending on the characteristics of the intersection. Signal timing parameters may provide an opportunity to maximize the efficiency of the intersection. Signal timing parameters control how quickly the phase ends once traffic demand is no longer present. The one phase that is the exception is the coordinated phase, which receives the unused or additional time. 4.7.4 Vehicle timing—Vehicle ClearanceThe vehicle clearance interval consists of the yellow change and red clearance intervals. The recommended practice for computing the vehicle clearance interval is the ITE formula (reference 56, equation 11-4), given in equation 2 (to use with metric inputs, use 1 m = 0.3048 ft):
For change periods longer than 5 s, a red clearance interval is typically used. Some agencies use the value of the third term as a red clearance interval. The MUTCD does not require specific yellow or red intervals but provides guidance that the yellow change interval should be approximately 3 s to 6 s and that the red clearance interval should not exceed 6 s (section 4D.10).(1) Note that because high-volume signalized intersections tend to be large and frequently on higher speed facilities, their clearance intervals are typically on the high end of the range. These longer clearance intervals increase loss time at the intersection and thus reduce capacity. The topic of yellow and red clearance intervals has been much debated in the traffic engineering profession. At some locations, the yellow clearance interval is either too short or set improperly due to changes in posted speed limits or 85th-percentile speeds. This is a common problem and frequently causes drivers to brake hard or to run through the intersection during the red phase. Because not all States follow the same law with regard to what is defined as "being in the intersection on the red phase," local practice for defining the yellow interval varies considerably. For this reason, red light photo enforcement should not be used during the period of red clearance required by the ITE formula. Current thought is that longer clearance intervals will cause drivers to enter the intersection later and will breed disrespect for the traffic signal. Wortman and Fox conducted a study that showed that the time of entry of vehicles into the intersection increased due to a longer yellow interval.(59) Additional research is needed to examine the effect of lengthening the yellow interval on driver behavior. 4.7.5 Vehicle timing—Cycle LengthFor isolated, actuated intersections, cycle length varies from cycle to cycle based on traffic demand and signal timing parameters. For coordinated intersections, a background cycle length is used to achieve consistent operation between consecutive intersections. In general, shorter cycle lengths are preferable to longer ones because they result in less delay and shorter queues. However, the need to accommodate multiple pedestrian movements across wide roadways, coupled with complex signal phasing and minimum green requirements to accommodate signal progression in multiple directions, may sometimes require the use of even longer cycle lengths. Wherever possible, such use should be limited to peak traffic periods only. In general, it is preferred that the cycle lengths for conventional, four-legged intersections not exceed 120 s, although larger intersections may require longer cycle lengths. Longer cycle lengths generally result in increased delay and queues to all users, particularly minor movements. There may also be a connection between longer cycle lengths and increased incidence of red-light running, although this has not been documented in research. Although longer cycle lengths result in fewer change periods per hour and thus fewer opportunities for red-light running, more drivers may be tempted to run the red light to avoid the extra delay caused by the longer cycle length.(60) 4.8 Signing and Pavement Marking DesignSigns and pavement markings are important elements of the design of an intersection. Because of the complexity of driver decisions, particularly at large signalized intersections, special attention to signing and pavement markings can maximize the safety and efficiency of the intersection. At signalized intersections, these traffic control devices serve several key functions, including:
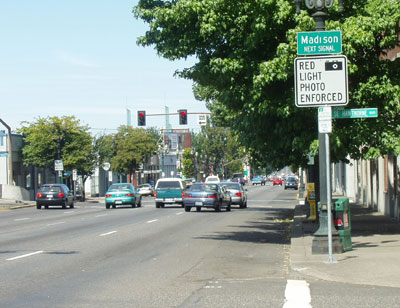
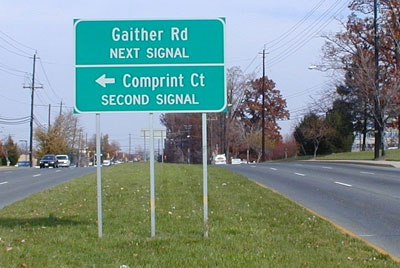
The FHWA’s MUTCD(1) is the primary reference for use in the design and placement of signs and pavement markings. Additional resources include state supplements to the MUTCD and reference materials such as ITE s Traffic Control Devices Handbook (TCDH)(61) and Traffic Signing Handbook.(62) Designing effective signing and pavement marking at high-volume signalized intersections in particular often requires thinking beyond standard drawings of typical sign and pavement marking layouts at intersections. High-volume signalized intersections typically have more lanes than most intersections. They may have redirected or restricted turning movements. They often join two or more designated routes (e.g., State highways) that require directional guidance to the user. They are also frequently in urban areas where other intersections, driveways, and urban land use create visibility conflicts. The following questions, adapted from the ITETraffic Signing Handbook(62), represent a basic thought process that is recommended for engineers to follow when developing a sign layout at an intersection: 1. From a given lateral and longitudinal position on the roadway, what information does the user need, both in advance and at the intersection? At signalized intersections, is information on lane use at the intersection provided? Is advance street name information (“XX Street, Next Signal,” etc.) and (if appropriate) route number directional signage provided in advance of the intersection? Figure 38 gives an example of a simple advance street name sign on approach to an intersection, and figure 39 gives an example of an advance sign that provides street names for the next two signalized intersections.
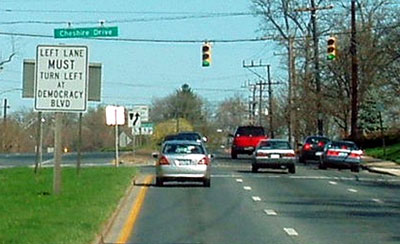
2. Are there any on- or off-road conditions that would violate driver expectancy? Lane drops, trap lanes, and right-hand exits for left turns are all examples where driver expectancy is violated and should be addressed by signing. Figure 40 shows an example of signage used to advise motorists of a trap lane.
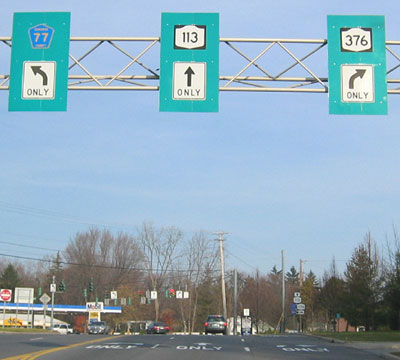
3. Is a specific action required by a road user? If the road user needs to be in an appropriate lane in advance of an intersection to make a movement at the intersection, signage is needed to convey this message to the user. Figure 41 provides an example of an overhead signs used to assist drivers in selecting the proper lane on approach to a signalized intersection.
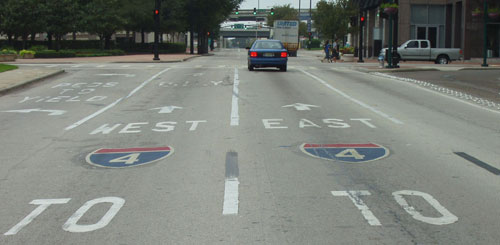
4. Are signs located so that the road user will be able to see, comprehend, and attend to the intended message? Signs must be simple enough to be easily comprehended and attended to before the driver receives the next message. This requires adequate sign size, sign spacing, and attention to the number of elements on each sign. This may, for example, lend itself to the use of overhead signs in advance of large intersections, as well as large retroreflectorized or internally illuminated overhead signs (including street name signs) at intersections. 5. For what part of the driver population is the sign being designed? Have the needs of older drivers or nonlocal drivers been accommodated? This may require the use of larger lettering or sign illumination. 6. Does the sign “fit in” as part of the overall sign system? Signing at an intersection needs to be consistent with the overall sign layout of the connecting road system. For example, the consistent use of guide signs is helpful to freeway users in identifying the appropriate exit. Similar consistency is needed on arterial streets with signalized intersections. Pavement markings also convey important guidance, warning, and regulatory lane-use information to users at signalized intersections. In addition to delineating lanes and lane use, pavement markings clearly identify pedestrian crossing areas, bike lanes, and other areas where driver attention is especially important. Where in-pavement detection is installed for bicycles and motorcycles, appropriate markings should be painted to guide these vehicles over the portion of the loop that will best detect them. Several supplemental pavement markings are particularly useful at large signalized intersections. For example, the use of lane line extensions into the intersection can be a helpful tool where the intersection is so large that the alignment of through or turning lanes between entering the intersection and exiting the intersection could be confused. This can occur, for example, where multiple turn lanes are provided, where the through lane alignments make a curve through the intersection, or where the receiving lanes at an intersection are offset laterally from the approach lanes. In addition, pavement legends indicating route numbers and/or destinations in advance of the intersection (i.e., “horizontal signage”) may be used to supplement signing for this purpose, as shown in figure 42.
4.9 Illumination DesignAs noted in American National Standard Practice for Roadway Lighting (RP-8-00), “[t]he principal purpose of roadway lighting is to produce quick, accurate, and comfortable visibility at night. These qualities of visibility may safeguard, facilitate, and encourage vehicular and pedestrian traffic…[T]he proper use of roadway lighting as an operative tool provides economic and social benefits to the public including: (a) Reduction in night accidents, attendant human misery, and economic loss. (b) Aid to police protection and enhanced sense of personal security. (c) Facilitation of traffic flow. (d) Promotion of business and the use of public facilities during the night hours.”(63, p.1) Specifically with respect to intersections, the document notes that “[s]everal studies have identified that the primary benefits produced by lighting of intersections along major streets is the reduction in night pedestrian, bicycle and fixed object accidents.” (section 3.6.2)(63) With respect to signalized intersections, roadway lighting can play an important role in enabling the intersection to operate at its best efficiency and safety. The highest traffic flows of the day (typically the evening peak period) may occur during dusk or night conditions where lighting is critically important, particularly in winter for North American cities in northern latitudes. The document includes three different criteria for roadway lighting: illuminance, luminance, and small target visibility (STV). These are described as follows:
4.9.1 IlluminanceThe two principal measures used in the illuminance method are light level and uniformity ratio. Light level represents the intensity of light output on the pavement surface and is reported in units of lux (metric) or footcandles (U.S. Customary). Uniformity represents the ratio of either the average-to-minimum light level (Eavg/Emin) or the maximum-to-minimum light level (Emax/Emin) on the pavement surface. The light level and uniformity requirements are dependent on the roadway classification and the level of pedestrian night activity. The basic principle behind the lighting of intersections is that the amount of light on the intersection should be proportional to the classification of the intersecting streets and equal to the sum of the values used for each separate street. For example, if Street a is illuminated at a level of x and Street B is illuminated at a level of y, the intersection of the two streets should be illuminated at a level of x+y. RP-8-00 also specifies that if an intersecting roadway is illuminated above the recommended value, then the intersection illuminance value should be proportionately increased. If the intersection streets are not continuously lighted, a partial lighting system can be used. RP-8-00 and its annexes should be reviewed for more specific guidance on partial lighting, the specific calculation methods for determining illuminance, and guidance on the luminance and STV methods.(63) Table 17 presents the recommended illuminance for the intersections within the scope of this document located on continuously illuminated streets. Separate values have been provided for portland cement concrete road surfaces (RP-8-00 Road Surface Classification R1) and typical asphalt concrete road surfaces (RP-8-00 Road Surface Classification R2/R3). Table 18 presents the roadway and pedestrian area classifications used for determining the appropriate illuminance levels in table 17. RP-8-00 clarifies that although the definitions given in table 18 may be used and defined differently by other documents, zoning bylaws, and agencies, the area or roadway used for illumination calculations should best fit the descriptions contained in table 18 (section 2.0, p. 3).(63) 4.9.2 Veiling LuminanceVeiling luminance is produced by stray light from light sources within the field of view. This stray light is superimposed in the eye on top of the retinal image of the object of interest, which alters the apparent brightness of that object and the background in which it is viewed. This glare, known as disability glare, reduces a person’s visual performance and thus must be considered in the design of illumination on a roadway or intersection (annex C).(63) Table 17 shows the maximum veiling luminance required for good intersection lighting design. Table 17. Recommended illuminance for the intersection of continuously lighted urban streets.
Table 18. RP-8-00 guidance for roadway and pedestrian/area classification
Part IIProject Process and Analysis MethodsPart II describes the key elements of a typical project process (chapter 5) from project initiation to implementation and monitoring. Part II also includes a description of safety analysis methods (chapter 6) and operational analysis methods (chapter 7) that can be used in the evaluation of a signalized intersection. The chapters in part II provide the reader with the tools needed to determine deficiencies of a signalized intersection and areas for improvement and mitigation. The findings from part II should be used to identify applicable treatments in part III. |
|||||||||||||||||||||||||||||||||||||||||||||||||||||||||||||||||||||||||||||||||||||||||||||||||||||||||||||||||||||||||||||||||||||||||||||||||||||||||||||||||||||||||||||||||||||||||||||||||||||||||||||||||||||||||||||||||||||||||||||||||||||||||||||||||||||||||||||||||||||||||||||||||||||||||||||||||||||||||||


 (U.S. Customary)