Evaluation of LS-DYNA Wood Material Model 143
PDF files can be viewed with the Acrobat® Reader®
12 - Single Element: Tension Parallel to the Grain
A single solid element is used to study the developer’s wood material model in uniaxial tension parallel to the grain. Specifically, a parameter study investigating the southern yellow pine option is performed. The parameters investigated are wood grade, moisture content, and temperature. Stress-strain curves, volume-time curves, and changes in the 29 wood parameters (as reported in the d3hsp file) are presented.
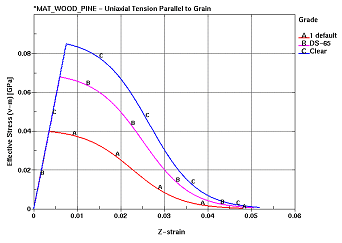
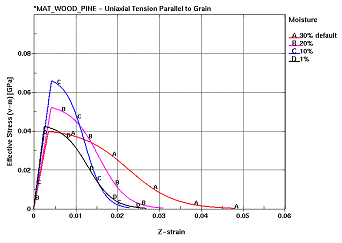
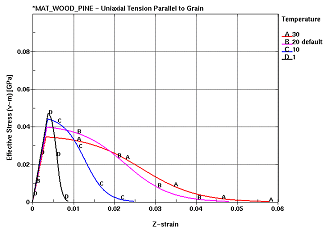
The stress-strain behavior of the single element in tension is as desired. In all cases, stress increases linearly with respect to strain until a peak strength is reached, followed by a gradual decrease in stress as the material undergoes damage and eventually fails. With respect to wood grade, increasing strength is observed as the grade is improved. With respect to moisture content, fully saturated wood is relatively weak, but ductile. As the moisture content decreases, the material becomes stronger and more brittle. When the wood becomes very dry, the strength decreases, yet maintains a brittle behavior. With respect to temperature, low-temperature pine is relatively strong, yet brittle, while wood at a high temperature is relatively weak and ductile.
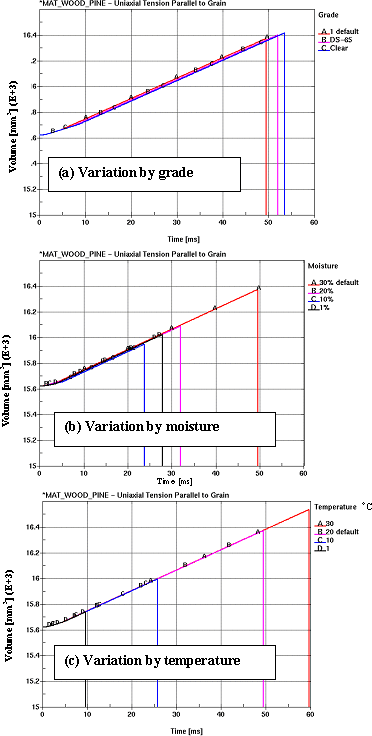
The volume of the single elements in tension parallel to the grain uniformly increases during all simulations by as much as 6 percent. This is an unexpected and undesirable result because it is believed by the user that, at a minimum, volume should be conserved for wood. A significant example of this volume expansion is shown in chapter 14 of this report.
Because of time limitations, various other single-element simulations were not performed, but are recommended (including compression, shear, and torsion loading both parallel and perpendicular to the grain).
|
In all cases, stress increases linearly with respect to strain until a peak strength is reached, followed by a gradual decrease in stress as the material undergoes damage and eventually fails.
With respect to wood grade, increasing strength is observed as the grade is improved.
|

(a) Variation by grade |
| With respect to moisture content, fully saturated wood is relatively weak, but ductile. As the moisture content decreases, the material becomes stronger and more brittle. When the wood becomes very dry, the strength decreases, yet maintains a brittle behavior. |

(a) Variation by moisture |
| With respect to temperature, low-temperature pine is relatively strong, yet brittle, while wood at a high temperature is relatively weak and ductile. |

(a) Variation by temperature |
Figure 72. Stress-strain behavior of single elements.
|
The volume of the single element in tension parallel to the grain uniformly increases during all simulations by as much as 6 percent. This is an unexpected and undesirable result because it is believed by the user that, at a minimum, volume should be conserved for wood. A significant example of this volume expansion is shown in chapter 14 of this report.
Note: The drop-off of volume on curves is where failure of the element occurs.
|
 |
Figure 73. Volumetric behavior of single elements.
When using the *MAT_WOOD_PINE option, the user specifies parameters such as wood grade, moisture content, and temperature. However, the underlying wood material model is based on a large set of theoretical parameters. By setting the wood grade, for example, the underlying parameters are modified appropriately. This section provides a set of tables (tables 8, 9, and 10) that record the variations in the underlying parameters based on changing a single parameter.
Table 8. Parameters based on wood grade.
Single Solid Element - Uniaxial Tension Parallel to the Grain
Units kg, mm, ms, kN, GPa
Density 6.731E-07 kg/mm3 |
*MAT_WOOD_PINE
Default Parameters Except for Grade |
| |
|
|
|
|
| |
|
Grade 1
(default) |
Grade DS-65 |
Grade Clear |
| Stiffness: |
|
|
|
|
| EL |
Parallel Normal Modulus |
11.350000 |
|
|
| ET |
Perpendicular Normal Modulus |
0.246800 |
|
|
| GLT |
Parallel Shear Modulus |
0.715200 |
|
|
| GLR |
Perpendicular Shear Modulus |
0.087510 |
|
|
| PR |
Parallel Major Poisson's Ratio |
0.156800 |
|
|
| |
|
|
|
|
| Strength: |
|
|
|
|
| Xt |
Parallel Tensile Strength |
0.040030 |
0.068130 |
0.085160 |
| Xc |
Parallel Compressive Strength |
0.013320 |
0.019670 |
0.021150 |
| Yt |
Perpendicular Tensile Strength |
0.000963 |
0.001640 |
0.002050 |
| Yc |
Perpendicular Compressive Strength |
0.002571 |
0.003796 |
0.004082 |
| Sxy |
Parallel Shear Strength |
0.004275 |
0.007277 |
0.009096 |
| Syz |
Perpendicular Shear Strength |
0.005985 |
0.010190 |
0.012730 |
| |
|
|
|
|
| Damage: |
|
|
|
|
| Gf1 |
Parallel Fracture Energy in Tension |
0.020050 |
0.034130 |
0.042660 |
| Gf2 |
Parallel Fracture Energy in Shear |
0.041480 |
0.070610 |
0.088260 |
| Bfit |
Parallel Softening Parameter |
30.000000 |
|
|
| Dmax |
Parallel Maximum Damage |
0.999900 |
|
|
| Gf1 |
Perpendicular Fracture Energy in Tension |
0.000401 |
|
|
| Gf2 |
Perpendicular Fracture Energy in Shear |
0.000830 |
|
|
| Dfit |
Perpendicular Softening Parameter |
30.000000 |
|
|
| Dmax |
Perpendicular Maximum Damage |
0.990000 |
|
|
| |
|
|
|
|
| Rate Effects: |
|
|
|
|
| Flpar |
Parallel Fluidity Parameter: Tension/Shear |
0.000 |
|
|
| Flparc |
Parallel Fluidity Parameter: Compression |
0.000 |
|
|
| Pow_par |
Parallel Power |
0.000 |
|
|
| Flper |
Perpendicular Fluidity Parameter: Tension/Shear |
0.000 |
|
|
| Flperc |
Perpendicular Fluidity Parameter: Compression |
0.000 |
|
|
| Pow_per |
Perpendicular Power |
0.000 |
|
|
| |
|
|
|
|
| Hardening: |
|
|
|
|
| Npar |
Parallel Hardening Initiation |
0.500 |
|
|
| Cpar |
Parallel Hardening Rate |
1008.000 |
462.500 |
400.000 |
| Nper |
Perpendicular Hardening Initiation |
0.400 |
|
|
| Cper |
Perpendicular Hardening Rate |
252.000 |
115.600 |
100.000 |
| |
|
|
|
|
| Note: Only those values that changed because of the change in grade are provided in the table. |
Table 9. Parameters based on moisture content.
Single Solid Element - Uniaxial Tension Parallel to the Grain
Units kg, mm, ms, kN, GPa
Density 6.731E-07 kg/mm3 |
*MAT_WOOD_PINE
Default Parameters Except for Moisture Content (MS) |
| |
|
|
|
|
|
| |
|
MC = 30%
(default) |
MC = 20% |
MC = 10% |
MC = 1% |
| Stiffness: |
|
|
|
|
|
| EL |
Parallel Normal Modulus |
11.350000 |
12.560000 |
15.490000 |
16.720000 |
| ET |
Perpendicular Normal Modulus |
0.246800 |
0.461900 |
0.910100 |
0.959700 |
| GLT |
Parallel Shear Modulus |
0.715200 |
0.736900 |
0.789800 |
0.811900 |
| GLR |
Perpendicular Shear Modulus |
0.087510 |
0.165500 |
0.332300 |
0.349300 |
| PR |
Parallel Major Poisson's Ratio |
0.156800 |
0.184200 |
0.258600 |
0.303300 |
| |
|
|
|
|
|
| Strength: |
|
|
|
|
|
| Xt |
Parallel Tensile Strength |
0.040030 |
0.052380 |
0.066190 |
0.042590 |
| Xc |
Parallel Compressive Strength |
0.013320 |
0.018580 |
0.037000 |
0.054760 |
| Yt |
Perpendicular Tensile Strength |
0.000963 |
0.001458 |
0.002139 |
0.001477 |
| Yc |
Perpendicular Compressive Strength |
0.002571 |
0.003627 |
0.007145 |
0.010310 |
| Sxy |
Parallel Shear Strength |
0.004275 |
0.005577 |
0.008526 |
0.009351 |
| Syz |
Perpendicular Shear Strength |
0.005985 |
0.007808 |
0.011940 |
0.013090 |
| |
|
|
|
|
|
| Damage: |
|
|
|
|
|
| Gf1 |
Parallel Fracture Energy in Tension |
0.020050 |
0.015660 |
0.013840 |
0.011670 |
| Gf2 |
Parallel Fracture Energy in Shear |
0.041480 |
0.046150 |
0.050160 |
0.028480 |
| Bfit |
Parallel Softening Parameter |
30.000000 |
|
|
|
| Dmax |
Parallel Maximum Damage |
0.999900 |
|
|
|
| Gf1 |
Perpendicular Fracture Energy in Tension |
0.000401 |
0.00313 |
0.000277 |
0.000233 |
| Gf2 |
Perpendicular Fracture Energy in Shear |
0.00830 |
0.000923 |
0.001003 |
0.000570 |
| Dfit |
Perpendicular Softening Parameter |
30.000000 |
|
|
|
| Dmax |
Perpendicular Maximum Damage |
0.990000 |
|
|
|
| |
|
|
|
|
|
| Rate Effects: |
|
|
|
|
|
| Flpar |
Parallel Fluidity Parameter: Tension/Shear |
0.000 |
|
|
|
| Flparc |
Parallel Fluidity Parameter: Compression |
0.000 |
|
|
|
| Pow_par |
Parallel Power |
0.000 |
|
|
|
| Flper |
Perpendicular Fluidity Parameter: Tension/Shear |
0.000 |
|
|
|
| Flperc |
Perpendicular Fluidity Parameter: Compression |
0.000 |
|
|
|
| Pow_per |
Perpendicular Power |
0.000 |
|
|
|
| |
|
|
|
|
|
| Hardening: |
|
|
|
|
|
| Npar |
Parallel Hardening Initiation |
0.500 |
|
|
|
| Cpar |
Parallel Hardening Rate |
1008.000 |
|
|
|
| Nper |
Perpendicular Hardening Initiation |
0.400 |
|
|
|
| Cper |
Perpendicular Hardening Rate |
252.000 |
|
|
|
| |
|
|
|
|
|
| Note: Only those values that changed because of the change in moisture content are provided in the table. |
Table 10. Parameters based on temperature.
Single Solid Element - Uniaxial Tension Parallel to the Grain
Units kg, mm, ms, kN, GPa
Density 6.731E-07 kg/mm3 |
*MAT_WOOD_PINE
Default Parameters Except for Temperature |
| |
|
|
|
|
|
| |
|
Temperature = 30°C |
Temperature = 20°C
(default) |
Temperature = 10°C |
Temperature = 1°C |
| Stiffness: |
|
|
|
|
|
| EL |
Parallel Normal Modulus |
10.620000 |
11.350000 |
11.970000 |
12.420000 |
| ET |
Perpendicular Normal Modulus |
0.230800 |
0.246800 |
0.260200 |
0.270000 |
| GLT |
Parallel Shear Modulus |
0.668900 |
0.715200 |
0.754000 |
0.782400 |
| GLR |
Perpendicular Shear Modulus |
0.081840 |
0.087510 |
0.092250 |
0.095730 |
| PR |
Parallel Major Poisson's Ratio |
|
0.156800 |
|
|
| |
|
|
|
|
|
| Strength: |
|
|
|
|
|
| Xt |
Parallel Tensile Strength |
0.034840 |
0.040030 |
0.044370 |
0.047550 |
| Xc |
Parallel Compressive Strength |
0.01160 |
0.013320 |
0.014770 |
0.015830 |
| Yt |
Perpendicular Tensile Strength |
0.000839 |
0.000963 |
0.001068 |
0.001144 |
| Yc |
Perpendicular Compressive Strength |
0.002238 |
0.002571 |
0.002850 |
0.003055 |
| Sxy |
Parallel Shear Strength |
0.003721 |
0.004275 |
0.004739 |
0.005079 |
| Syz |
Perpendicular Shear Strength |
0.005210 |
0.005985 |
0.006634 |
0.007110 |
| |
|
|
|
|
|
| Damage: |
|
|
|
|
|
| Gf1 |
Parallel Fracture Energy in Tension |
0.021440 |
0.020050 |
0.010460 |
0.002657 |
| Gf2 |
Parallel Fracture Energy in Shear |
0.044360 |
0.041480 |
0.021640 |
0.005498 |
| Bfit |
Parallel Softening Parameter |
|
30.000000 |
|
|
| Dmax |
Parallel Maximum Damage |
|
0.999900 |
|
|
| Gf1 |
Perpendicular Fracture Energy in Tension |
0.000429 |
0.000401 |
0.000380 |
0.000367 |
| Gf2 |
Perpendicular Fracture Energy in Shear |
0.000887 |
0.000830 |
0.000787 |
0.000758 |
| Dfit |
Perpendicular Softening Parameter |
|
30.000000 |
|
|
| Dmax |
Perpendicular Maximum Damage |
|
0.990000 |
|
|
| |
|
|
|
|
|
| Rate Effects: |
|
|
|
|
|
| Flpar |
Parallel Fluidity Parameter: Tension/Shear |
|
0.0000 |
|
|
| Flparc |
Parallel Fluidity Parameter: Compression |
|
0.0000 |
|
|
| Pow_par |
Parallel Power |
|
0.0000 |
|
|
| Flper |
Perpendicular Fluidity Parameter: Tension/Shear |
|
0.0000 |
|
|
| Flperc |
Perpendicular Fluidity Parameter: Compression |
|
0.0000 |
|
|
| Pow_per |
Perpendicular Power |
|
0.0000 |
|
|
| |
|
|
|
|
|
| Hardening: |
|
|
|
|
|
| Npar |
Parallel Hardening Initiation |
|
0.500 |
|
|
| Cpar |
Parallel Hardening Rate |
|
1008.000 |
|
|
| Nper |
Perpendicular Hardening Initiation |
|
0.400 |
|
|
| Cper |
Perpendicular Hardening Rate |
|
252.000 |
|
|
| |
|
|
|
|
|
| Note: Only those values that changed because of the change in moisture content are provided in the table. |
Previous | Table of Contents | Next
|
