U.S. Department of Transportation
Federal Highway Administration
1200 New Jersey Avenue, SE
Washington, DC 20590
202-366-4000
Federal Highway Administration Research and Technology
Coordinating, Developing, and Delivering Highway Transportation Innovations
 |
| This report is an archived publication and may contain dated technical, contact, and link information |
|
Publication Number: FHWA-HRT-04-149
Date: December 2005 |
|||||||||||||||||||||||||||||||||||||||||||||||||||||||||||||||||||||||||||||||||||||||||||||||||||||||||||
Enhanced Night Visibility Volume XVIII Overview of IIIPDF Version (308 KB)
PDF files can be viewed with the Acrobat® Reader® CHAPTER 2—PHASE III VISUAL PERFORMANCE STUDIESThis portion of the Phase III effort included two studies, one in clear weather and one in rain, that evaluated two NIR VESs, an IR–TIS, two HID VESs, and a halogen low-beam (HLB) (i.e., tungsten-halogen) VES. The clear study analysis used a 6 (VES) by 3 (Age) by 17 (Object) model; age was the only between-subjects variable. The rain study used 4 of the clear study's 6 VESs, 8 of its 17 objects, and a subset of its participants. Each of these independent variables is discussed in more detail below along with the dependent variables and key findings. INDEPENDENT VARIABLESVision Enhancement SystemsThe term "VES" encompasses the combination of headlamps, supplemental lighting, and imaging systems used on each vehicle. The Phase III clear and rain visual performance tests evaluated the same halogen low-beam VES and far infrared VES tested in Phase II. New to the ENV project in Phase III were two prototype NIR VESs and two HID VESs. The NIR systems used IR emitters in combination with a camera sensitive to the near IR spectrum; the IR–TIS used a camera sensitive to thermal contrast between objects and surroundings. Images from these systems were displayed in front of the driver just above the instrument panel. All three IR systems were accompanied by halogen headlamps. All VESs were installed on sport utility vehicle (SUV) platforms, including the IR–TIS, which was factory-installed original equipment on a sedan in Phase II. The rain study excluded the HIDs; the clear study used all six VESs listed below:
AgeEighteen drivers participated in the clear study. There were six participants in each of the three age groups: 18 to 25 years, 40 to 50 years, and 65 years and older. Each age group had three males and three females. The rain study used 15 of the 18 clear study participants and included 2 males and 3 females in each age category. ObjectsTable 1 shows the 17 objects used in the clear study. The 12 static pedestrian scenarios included pedestrians appearing just outside of the right or left edgeline in straight sections or turns of 1,250 m radius, appearing off-axis (9.4 m (31 ft) to the left or right of the centerline), and appearing in bloom scenarios (just outside either edgeline and adjacent to a vehicle with its headlamps on parked in the oncoming lane). Ten of the pedestrians wore blue clothing, and two of the pedestrians appearing in straight sections wore black clothing. The retroreflective group included three types of retroreflective infrastructure objects: a raised retroreflective pavement marking (RRPM), traffic signs (yield, stop, and speed limit) positioned roadside, and painted traffic arrows positioned on the pavement as in a turn lane. The two remaining objects—a terrier-sized, internally heated, stuffed dog model positioned on the centerline and a tire tread positioned on the right edgeline—made up the obstacle group. Each object was presented for every VES in a counterbalanced order. Volume XVI provides detailed characterization of each of these objects. The subset of objects used in the rain study is indicated by an "X" in table 1. A blue-clothed pedestrian crossing the road perpendicular to the driver was added to the rain study. This was the only pedestrian that moved in either the clear or rain study. The pedestrian crossed the vehicle's path back and forth between the centerline and the edgeline. This scenario had been included in the Phase II studies with pedestrians in white and sometimes black clothing. The tire tread was also included as an object of low contrast in the rain condition.
DEPENDENT VARIABLESThe primary performance variables used in both studies were detection and recognition distance. Both terms, detection and recognition, were explained to the participants during the training session. Detection was explained as follows: "Detection is when you can just tell that something is on the road in front of you. You cannot tell what the object is, but you know something is there." Recognition was explained as follows: "Recognition is when you not only know something is there, but you also know what it is." Measurements of object detection and recognition distances were collected as follows. When a participant detected an object, he or she would say the word "something." Then, when the participant could recognize the object, he or she would provide a verbal recognition. At each of these utterances, the in-vehicle experimenter would flag the data. The in-vehicle experimenter also flagged the data when the front bumper of the vehicle passed the object. The data points were later verified in the laboratory from in-vehicle videotape. Detection and recognition distances were calculated from distance data collected at each of these three points in time. The dependent variables also included subjective ratings. Participants were asked to evaluate a series of seven statements for each VES using a seven-point Likert-type scale. The two anchor points of the scale were "1" (indicating "Strongly Agree") and "7" (indicating "Strongly Disagree"). The statements addressed each participant's perception of improved vision, safety, and comfort after experiencing a particular VES. Participants were asked to compare each VES with their own vehicle's regular headlights. Following is a list of the statements on the questionnaire:
The following two questions were added to the Phase III visual performance studies to collect data that was of interest to the VES manufacturers:
KEY FINDINGSFollowing are the key findings in the clear and rain studies. The reports for each study, ENV Volumes XIII and XIV, contain more detailed information on these and additional findings. Because of the large number of objects that were presented in this study, a graphical representation that shows the relative detection distance of each object used for each VES was developed. Figure 1 is a key that shows the objects that were included in the study and their representations in the following diagrams. 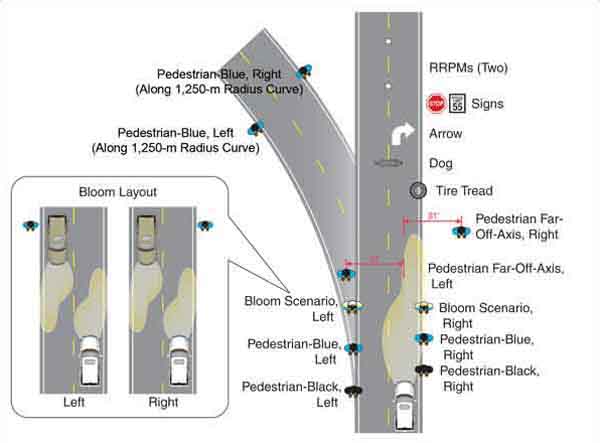
Figure 1. Diagram. Detection distance diagram key.
The figures for each VES provide a graphical representation of visibility using both detection distance, indicated on the left side of the figure, and stopping distance at various speeds, indicated on the right side of the figure. Stopping distance is the distance required to bring the vehicle to a complete stop, and it takes into account both driver reaction time and braking ability of a vehicle in clear weather conditions. Its equation is described in more detail in ENV Volume XIII. Note that figure 2 and figure 3 do not include the signs' detection distances because they were more than 274 m (900 ft). Supplemental Infrared System in Clear ConditionsThe study tested three supplemental IR systems, two prototype near IR systems (NIR 1 and NIR 2) and an IR thermal imaging system (i.e., IR–TIS). The NIR 2 system did not perform as well as the other two IR systems or some of the headlamps, illustrating that implementation, not technology, is a key to a successful enhanced night vision system. The remaining two systems, IR–TIS and NIR 1, provided pedestrian detection benefit in clear weather over headlamps. In all but one pedestrian scenario, detection distance was acceptable for 89-km/h (55-mi/h) driving with these two systems. That is, drivers would have had sufficient time to detect the pedestrian, react, and stop at that speed. For most of the pedestrian scenarios, the IR–TIS implementation provided a 20- to 30-m (66- to 98-ft) detection advantage over the NIR 1 implementation. These differences can be seen in figure 2 and figure 3. 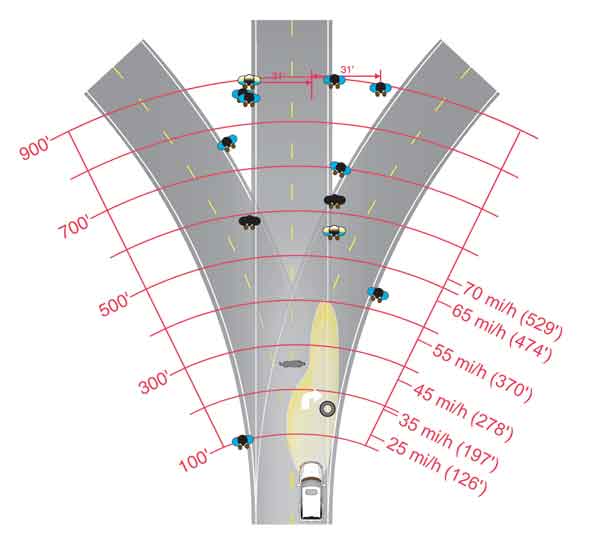
Figure 2. Diagram. IR–TIS mean detection distances.
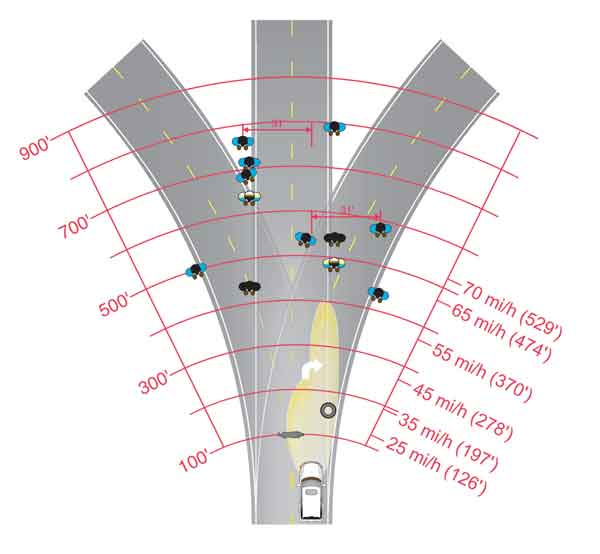
Figure 3. Diagram. NIR 1 mean detection distances.
Although the IR systems generally enhanced drivers' ability to detect objects, there was some indication of reduced detection distances for objects not shown in the system display. The IR–TIS had the shortest detection of pedestrians on the left in a left turn scenario (see figure 2) and retroreflective objects. This poor performance probably results from these objects being outside that system's field of view, and therefore, not being shown in the display. This decrement could have been caused by oversampling of the IR–TIS system because of the large number of thermal objects in this study, the system novelty, or the experimental situation. The decrement could have also been partly caused by poorer performance of the headlamps on the IR–TIS SUV. The wider field of view (FOV) (18°) of the NIR 1 system appeared sufficient for presenting pedestrians on the curve tested (radius of 1,250 m), for pedestrians located 9.4 m (31 ft) from the lane's center, and for pedestrians along the sides of road. The narrower FOV (11.7°) of the IR–TIS and NIR 2 systems may not present objects on curves with radii of 1,250 m or less. Age in Clear ConditionsAlthough all participants appeared to benefit from the supplemental IR, the older participants appeared to benefit more from the NIR 1 than the IR–TIS in some scenarios. The opposite was true for the younger and middle age groups; in many pedestrian detection scenarios, they had longer detection distances with IR–TIS than the NIR 1. Not surprisingly, when using headlamps alone, older participants had shorter detection distances than younger participants. A detailed analysis of the data was conducted to determine if supplemental IR could offset the detection performance decrement of the older age group. The results indicated that this performance decrement could indeed be offset. That is, the older participants using either the IR–TIS or the NIR 1 systems performed similarly to the younger participants using the best of the three headlamp systems. Pedestrian Clothing Color in Clear ConditionsIn the clear study, the scenarios conducted on straight road segments with a pedestrian on the right or left side allowed a comparison of the effect of blue clothing versus black clothing on detection distances (table 2). All of the VESs demonstrated longer detection distances of pedestrians dressed in blue clothing than of pedestrians dressed in black clothing: 13 to 83 m (42 to 272 ft) longer on the left side and 38 to 83 m (125 to 272 ft) longer on the right. On average blue clothing increased detection distance over black clothing by 60 percent. Not surprisingly, the NIR systems, which are sensitive to differences in the visible spectrum, showed a blue-clothing detection benefit ranging from 38 to 83 m (125 to 272 ft). Perhaps the most surprising result is the 83 m (272 ft) greater detection distance for blue clothing when using an IR–TIS. Recall that IR–TIS is based on thermal differences between the object and the background rather than on differences in the visible spectrum, so there should be no difference in the pedestrian detection because of clothing type. The observed differences could be explained by the thicker blue cloth that may have held more heat than the thinner black cloth. Also, some participants may have waited for visual confirmation (through the windshield) before declaring detection of a pedestrian. For these participants, pedestrians dressed in blue would be seen from farther away than pedestrians dressed in black. Additional research would be required to ascertain the cause behind this difference.
Rain ConditionIn general, in rainy driving conditions both NIR systems had longer detection distances than the baseline HLB and IR–TIS systems for nearly all pedestrian detection scenarios. The only exception was the NIR 2 with the pedestrian on the right side of a right curve; it had similar or slightly shorter detection distances for this scenario than both the HLB and the IR–TIS systems, although the differences were not statistically significant. The difference was likely because the pedestrian was outside the FOV of the NIR 2 system. All other pedestrian mean detection distances for both NIR 1 and NIR 2 were longer than those of both the HLB and the IR–TIS. These objective findings do not appear to be differentiated by age and are corroborated by the subjective responses of the drivers in this study. This is a particularly interesting finding because the NIR 2 system consistently performed worse than the other VESs in the clear study. The IR–TIS, which performed well in the clear condition, did not perform well in rain, and it appears that drivers used the accompanying headlamps to detect objects. This poor performance was also found in the Phase II rain study (ENV Volume IV). Display Recommendations for Nighttime VisibilityThe display should be located as close to the forward road scene as possible, using a high head down (HHD) display or a heads-up display (HUD). Possible objects should be called out clearly in the display to minimize the driver's visual scanning time. Drivers should not think they can drive solely by using the display. The ideal interface would attract the driver's attention when necessary but would not otherwise require glances. This might include HUD technology, auditory warnings when a possible object is present, or display activation only when a possible object is present. Visual interrogation of the display should require minimal glance time. This might be accomplished by presenting objects in high contrast or, as enabling technology becomes feasible, by augmenting the scene with distinctive graphics to call out possible objects.
|

