U.S. Department of Transportation
Federal Highway Administration
1200 New Jersey Avenue, SE
Washington, DC 20590
202-366-4000
Federal Highway Administration Research and Technology
Coordinating, Developing, and Delivering Highway Transportation Innovations
 |
| This techbrief is an archived publication and may contain dated technical, contact, and link information |
|
Publication Number: FHWA-HRT-05-139
Date: March 2006 |
||||||||||||||||||||||||||||||||||||||||||||||||||||||||||||||||||||||||||||||||||||||||||||||||||||||||||||||
Evaluation of Safety, Design, and Operation of Shared-Use PathsFHWA Contact: Ann Do, PDF Version (239 KB)
PDF files can be viewed with the Acrobat® Reader®
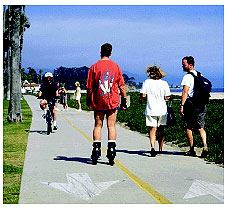
IntroductionThis TechBrief is a summary of Evaluation of Safety, Design, and Operation of Shared-Use Paths: Final Report, FHWA-HRT-05-137. Shared-use paths are paved, off-street travelways that serve bicyclists, pedestrians, and other nonmotorized modes of travel, as shown in figure 1. The Federal Highway Administration (FHWA) has developed a new method to estimate the level of service (LOS) on a shared-use path, using a team of researchers led by the North Carolina State University Department of Civil, Construction, and Environmental Engineering.
Answering Key QuestionsDuring the planning or design of every shared-use path, someone eventually asks, "How wide should this pathway be?" That question almost always raises even more questions: "What types of users can we reasonably expect? When will we need to widen the path? Do we need to separate different types of users from each other?" Before this project, these key questions were difficult to answer. The American Association of State Highway and Transportation Officials (AASHTO) Guide for the Development of Bicycle Facilities (1999) provides general guidance regarding path width (3.0 meters (m) (10 feet (ft)), or 3.7 to 4.2 m (12 to 14 ft) with substantial mixed use), but no specifics.(1) The Transportation Research Board (TRB) Highway Capacity Manual (2000) provides a method to calculate the LOS (A through F rating) for a path; however, this method has several important limitations, such as only including certain types of passing movements, assuming that path users never impede each other, including only pedestrians and bicyclists, and using fixed values for pedestrian and bicycle speeds.(2) ObjectivesThe project's purpose was to develop a service model that professionals could use to assist with the planning, design, and management of shared-use paths and to answer the key questions posed above. In particular, the project was to produce a tool that would overcome the limitations in the current LOS procedure. The new service model would:
The four major work items needed to achieve the project objectives were:
New TheoryTo achieve these objectives, the project team had to develop two important new aspects of the theory of traffic flow on shared-use paths. First, the team had to develop improved methods to estimate the number of meetings (opposite direction encounters) and passes (same direction encounters) for a wide variety of path users. Second, the team had to find a way to calculate the number of delayed passes (i.e., the number of times that a bicyclist arrives behind a slower path user and is not able to pass because of the lack of an adequate-sized gap in the lane to the left). Obviously, delayed passes are undesirable for bicyclists, and they are critical because they are so highly related to path width. Delayed passes were not included in the Highway Capacity Manual procedure.(2) Coast-to-Coast Data CollectionTo calibrate and validate the new service model and the LOS procedure, the main variables that needed to be collected were meetings and passes by path users. Other necessary data included the speeds of different types of path users. Most of the data was collected by using a camera mounted on the helmet of a test bicyclist. The data collection sites were some of the busiest and best-known trails in the United States, such as:
Overall, the 15 data collection trails in 10 cities represented a wide range of shared-use path conditions, including trail widths ranging from 2.4 to 6.1 m (8 to 20 ft). The researchers made nearly 800 data collection rides of 0.8 kilometer (0.5 mile) each on the 15 trails. Most rides were on weekends in good weather. Some of the most important findings were:
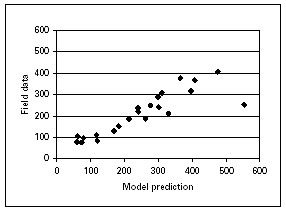
Overall, the field data matched the theoretical predictions very well, as figure 2 shows for the case of the number of meetings.
Asking the UsersThe research team surveyed 105 trail users (primarily bicyclists) to determine what factors they found to be significant in their evaluation of comfort and freedom to maneuver on shared-use paths. The respondents viewed and rated 60-second video clips of shared path operations; these clips were filmed by the researchers using the helmet camera during field data collection. The researchers tested a wide variety of factors to determine their overall influence on survey responses. The primary factors found to affect trail users' perceived LOS included:
The researchers added an adjustment for the number of delayed passes and produced the LOS equation and scale shown in figure 3.
A New ProcedureCombining the new theory, the field data, and the user survey, the researchers produced an improved LOS estimation procedure for shared-use paths. Table 1 shows a few examples of service predictions. However, readers must use this table cautiously because it is based on many assumptions, including assumptions about user speed and mode splits. The Final Report and Shared-Use Path Level of Service Calculator: A User's Guide, FHWA-HRT-05-138, contains many more examples like this.(3,4) Table 1. Example of LOS predictions.
1 foot=0.305 meters Users of the service estimation procedure need to remember that its scope is limited to uninterrupted segments of paved, off-street paths, from 2.4 to 6.1 m (8 to 20 ft) wide, and that the LOS is presented from the bicyclist's viewpoint only. SUPLOS CalculatorThe Shared-Use Path Level of Service (SUPLOS) calculator is a spreadsheet developed during this research that quickly and accurately executes the new LOS estimation procedure. Professionals can use the calculator to guide planning, design, and/or management decisions regarding path width and user mix on shared-use paths. Input is simple, requiring only four variables:
Analysts may elect to use the default mode split provided in the calculator if reliable mode split data are not available. The SUPLOS calculator example depicted in table 2 shows how easy it is to use the tool. The User's Guide provides detailed instructions for the calculator, offers case studies in which it is employed, and describes a variety of applications for which the calculator can be used.(4) Table 2. Sample SUPLOS calculator spreadsheet.
For More InformationAnn Do References
Other SourcesRouphail, N., J. Hummer, J. Milazzo II and D. Allen. Capacity Analysis of Pedestrian and Bicycle Facilities: Recommended Procedures for the Bicycles Chapter of the Highway Capacity Manual, FHWA-RD-98-108, Federal Highway Administration, McLean, VA, 2000. Harkey, D., D. Reinfurt, A. Sorton, M. Knuiman, and J. Richard Stewart. The Bicycle Compatibility Index: A Level of Service Concept, Implementation Manual, FHWA-RD-98-095, Federal Highway Administration, McLean, VA, 1998. Research—This work was performed by the North Carolina State University Department of Civil, Construction and Environmental Engineering, the University of North Carolina Highway Safety Research Center, and Toole Design Group. Distribution—This TechBrief is being distributed according to a standard distribution. Direct distribution is being made to the Resource Center and Divisions. Availability—The publication from which this TechBrief was developed, Evaluation of Safety, Design, and Operation of Shared-Use Paths: Final Report, FHWA-HRT-05-137, is available from the National Technical Information Service, 5285 Port Royal Road, Springfield, VA, 22161 (www.ntis.gov). A limited number of copies are available from the FHWA Research and Technology Product Distribution Center, HRTS-03, FHWA, 9701 Philadelphia Court, Unit Q, Lanham, MD, 20706. Key Words—research, safety, Path, Trail, Bicycle, Shared-use, Level of service, Width, Pedestrian, Inline skater Notice This TechBrief is disseminated under the sponsorship of the U.S. Department of
Transportation in the interest of information exchange. The TechBrief does not
establish policies or regulations, nor does it imply FHWA endorsement of the
conclusions or recommendations. The U.S. Government assumes no liability for
the contents or their use. Quality Assurance Statement The Federal Highway Administration (FHWA) provides high-quality information to serve Government, industry, and the public in a manner that promotes public understanding. Standards and policies are used to ensure and maximize the quality, objectivity, utility, and integrity of its information. FHWA periodically reviews quality issues and adjusts its programs and processes to ensure continuous quality improvement. |
||||||||||||||||||||||||||||||||||||||||||||||||||||||||||||||||||||||||||||||||||||||||||||||||||||||||||||||