U.S. Department of Transportation
Federal Highway Administration
1200 New Jersey Avenue, SE
Washington, DC 20590
202-366-4000
Federal Highway Administration Research and Technology
Coordinating, Developing, and Delivering Highway Transportation Innovations
 |
| This techbrief is an archived publication and may contain dated technical, contact, and link information |
|
Publication Number: FHWA-HRT-07-032
|
|||||||||||||||||||||||||||||||||||||||||||||||||||||||||||||||||||||||||||
Traffic Performance of Three Typical Designs of New Jersey Jughandle IntersectionsFHWA Contact: Joe Bared, HRDS-05, (202) 493-3314, or PDF Version (438 KB)
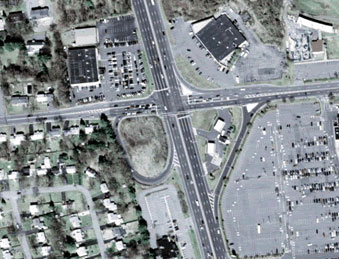
PDF files can be viewed with the Acrobat® Reader® ObjectiveAlthough New Jersey jughandle intersections (NJJIs) have been around for over five decades, researchers have not yet developed a simplified procedure to evaluate their traffic performance and compare them with conventional at-grade intersections. A limited number of studies have reported qualitative and quantitative comparisons of NJJIs. There have been, however, no readily available tools for traffic engineers and planners to estimate average delays, average numbers of stops, and maximum queues. For this study, researchers used VISSIM simulations to model typical geometries over a wide distribution of traffic flow conditions for three NJJI design. Comparisons of NJJIs with conventional intersections for similar volume conditions revealed that NJJIs produced lower average intersection delays and higher intersection capacities for near-saturated traffic conditions and similar traffic performance for undersaturated conditions. Practitioners can use statistical models documented in this study to assess average intersection delays, average number of stops per vehicle, and maximum queue lengths for three types of NJJIs. Figure 1. Forward/reverse NJJI on Jackson Avenue in Pequannock Township, NJ (2).
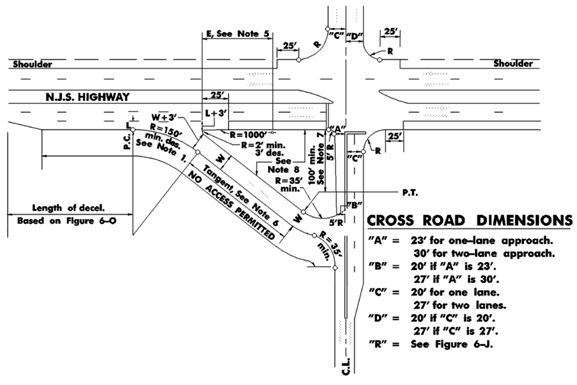
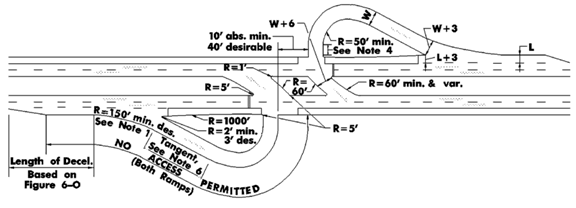
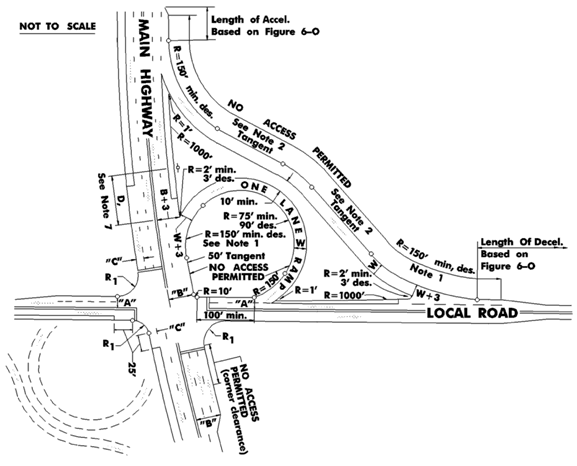
IntroductionHigh-volume intersections (especially during peak hours) pose a particularly difficult challenge to traffic engineers and planners interested in reducing delays and improving safety for motorists and pedestrians. The major side effects of traffic congestion include increased pollution, higher stress levels for drivers, and greater economic losses in terms of time wasted. To reduce congestion, delays, and crashes, researchers have suggested several innovative intersection designs for heavy traffic flow situations. These nontraditional intersection designs include the quadrant roadway intersection, median U turn, superstreet median, bowtie, jughandle, split intersection, and continuous flow intersection. The most significant benefit in the intersection performance for these heavy flow situations is achieved by reducing the number of phases in the signal cycle, although traffic diversion also may be employed. Reid and Hummer (1), comparing nontraditional intersections to conventional intersections, suggested that the jughandles do not perform better than the conventional designs in terms of average travel time based on model simulations of seven intersections under varying traffic conditions. The current study analyzes the performance of three NJJI design configurations compared to conventional intersections for a variety of traffic flows and signal settings. Comparisons of NJJIs with conventional intersections for similar volume conditions revealed that NJJIs produced lower average intersection delays and higher intersection capacities for saturated traffic conditions and similar traffic performance for undersaturated conditions. Jagannathan et al. (2) investigated the differences and similarities in safety performance of NJJIs versus conventional intersections for a limited sample set of 44 NJJIs and 50 conventional intersections based on statistical analyses of intersection crash data. Results from raw data indicated that conventional intersections tended to have more head-on, left-turn, fatal plus injury, and property damage only accidents, and relatively fewer rear-end accidents than NJJIs. These observations were confirmed by negative binomial crash prediction models that were developed to account for the influence of other causal factors. The fatality plus injury crashes per million entering vehicles at NJJIs were approximately 26 percent lower than at comparable conventional intersections. Description NJJIsThe New Jersey Department of Transportation (NJDOT) design manual (3) defines a jughandle as an "at-grade ramp" provided at or between intersections to permit motorists to make indirect left turns and/or U turns. Around-the-block designs that use interconnecting local street patterns to accomplish indirect left turns or U turns are not considered jughandles. These ramps exit from the right lane of the highway either in advance of the intersection or beyond the intersection. This design, which eliminates all left turns from the major road at the intersection, provides greater safety and reduces delays to the through traffic that left-turning vehicles usually create. The rerouted left turns from the major road cross the major road as through traffic from the minor road. The intersection of the major road and minor road is signalized. Brief descriptions of the types of jughandle ramp are given below. Type A—Forward Ramps With forward ramps, all turning traffic (right and left) exit onto a jughandle ramp to the right, upstream of the intersection. Left-turning traffic is able to cross the intersection at the cross street. Drivers wishing to make a U turn on the mainline can exit onto the ramp and then turn left from the cross street. This eliminates left-turn movement on the mainline and improves traffic flow; however, it requires a large right-of-way for the ramps. Figure 2 is an illustration of NJDOT design guidelines for the "forward" type NJJI ramp. Type B—U-Turn Ramps With U-turn ramps, where there is no intersection, ramps along the mainline enable vehicles to make U turns safely. A traffic signal is usually present to stop the mainline traffic flow and allow U-turning drivers to complete their maneuvers. Figure 3 illustrates the NJDOT design guidelines for the "U-turn" type NJJI ramp. Type C—Reverse Ramp With reverse ramps, left-turning traffic uses the rightmost lane downstream of the intersection into a loop ramp. Right-turning traffic turns right at the intersection in a traditional manner, not onto the loop ramp beyond the intersection. More through capacity is needed at the intersection because left-turning traffic first travels through the intersection before turning right onto the jughandle ramp, but this relieves problems by eliminating left-turn phases and left-turn lanes for left-turning vehicles from the mainline. Figure 4 illustrates the NJDOT design guidelines for the "reverse" type NJJI ramp. Figure 2. NJDOT design guidelines for jughandle intersections with a "forward" type ramp (Source: NJDOT Design Manual).
Figure 3. NJDOT design guidelines for jughandle intersections with a "U-turn" type ramp (Source: New Jersey DOT Design Manual).
Figure 4. NJDOT design guidelines for jughandle intersections with a "reverse" ramp (Source: NJDOT Design Manual).
Analysis MethodologyTo study the traffic performance of the NJJIs in detail, researchers selected VISSIM as the traffic simulation tool based on its versatility in modeling nontraditional movements and treatments. In this study, the researchers analyzed three different geometric design configurations for NJJIs and compared them to conventional intersections. Comparison intersections are conventional designs with similar characteristics with respect to number and width of approach lanes and traffic volumes. The NJJI is a nontraditional intersection and has noticeable differences with respect to traffic operation compared to conventional intersections. Left-turning traffic on the major road of a NJJI uses the ramp, because the left-turn movements from the major road are not permitted at the intersection. The six primary factors that influence the capacity of NJJIs to accommodate what would have been left-turning vehicles from the major road are:
The NJJI can operate with at least one less signal phase compared to a conventional signal-controlled intersection with one or more left-turn phases. Therefore, lower average traffic delays at signalized intersections are expected for NJJIs compared to conventional intersections. Increased travel times and concomitant delays for the left-turning vehicles from the major road are expected for NJJIs compared to conventional intersections. The researchers conducted microscopic traffic simulations to identify situations where NJJIs perform better than conventional intersections. The signal controller used in the modeling was an actuated controller operating in a "free" (noncoordinated) manner. The researchers calculated the amber and all-red intervals using the standard Institute of Transportation Engineers formula. The traffic composition was the default option in VISSIM—2 percent trucks. Driver behavior was based on the Wiedemann model used in VISSIM. The study team used VISSIM defaults for all other network parameters. Average speeds were 72 kilometers per hour (kph) (45 miles per hour (mph)) on the roads, 48 kph (30 mph) on the jughandle ramp, and 28 kph (15 mph) for vehicles when they executed turns. Cases ModeledThe researchers modeled the following three cases:
The common elements for the three geometric design configurations were:
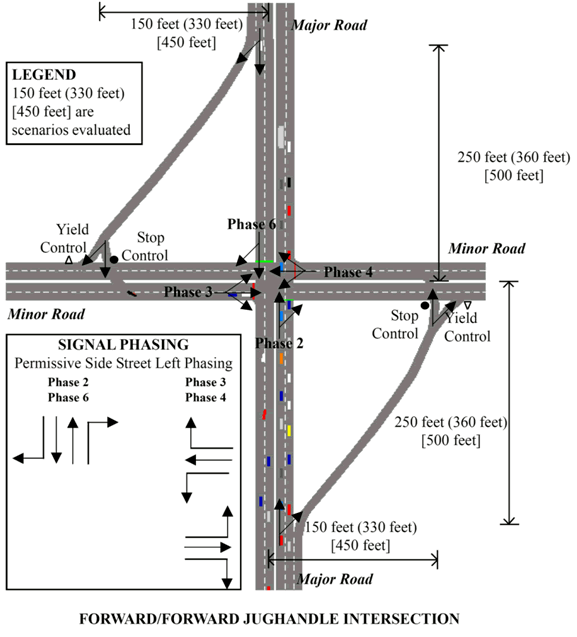
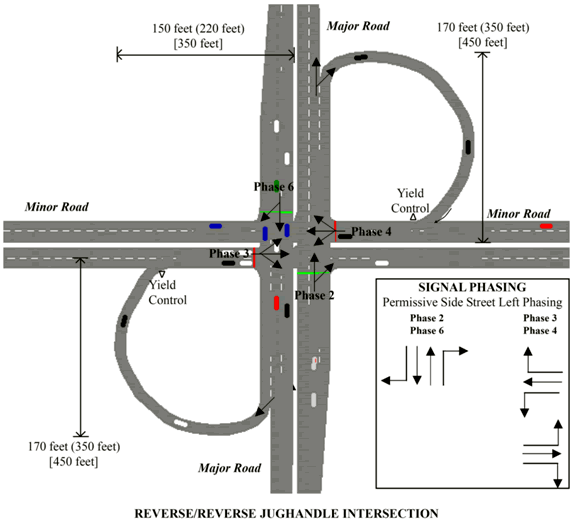
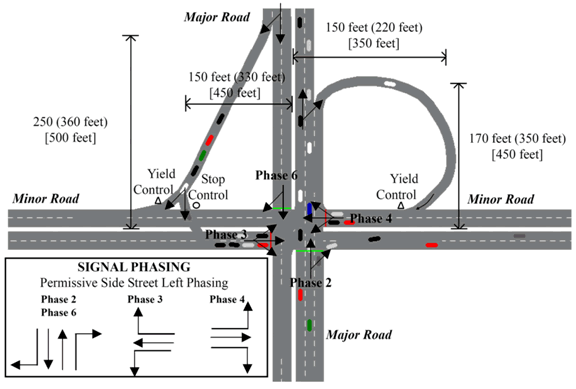
For left-turning traffic from the major roads, the range was between 25 and 350 vph. For the through traffic on the major roads, the range was 100 to 2,500 vph in one direction. For right-turning traffic on the major roads, the range was 25 to 350 vph in one direction. For left-turning traffic on the minor roads, the range was 5 to 75 vph in one direction. For the through traffic on the minor roads, the range was 25 to 150 vph in one direction. For right-turning traffic on the minor roads, the range was 25 to 150 vph in one direction. Maximum green times were 100 seconds and 50 seconds for phases 2 plus 6 and 3 plus 4, respectively, which were the phases serving the major roads and minor road movements. If all approach phases went to maximums, then the cycle length would be 162 seconds. The alternative signalization scheme had maximum green times of 70 seconds, 35 seconds, and 25 seconds for phases 2 plus 6, 4 plus 8, and 3 plus 7, respectively. The yellow times and all-red times for all phases were 4 and 2 seconds, respectively, for two sets. The median between the through lanes for the opposing directions of travel was assumed to be 3 meters (m) (10 feet (ft)) wide. Case A The intersection model has two through lanes per direction and one forward jughandle ramp per approach for the two major road approaches, as shown in figure 5. The researchers used three sets of geometric scenarios, which differed in terms of the distance from the centerline of the intersection to the location where the jughandle ramp intersects the road. Case B The intersection model has two through lanes per direction and one reverse jughandle ramp per approach for the two major road approaches, as shown in figure 6. As with case A, centerline distances of the intersection to the location where the jughandle ramp intersects the road were varied to create three different geometric scenarios. The right-turning vehicles on the major road turn right at the intersection, using the auxiliary ramp lane for the reverse jughandle traffic. Case C The intersection model has two through lanes per direction, a reverse jughandle ramp on one approach, and a forward jughandle ramp on the other approach for the two major road approaches, as shown in figure 7. As with the other cases, centerline distances of the intersection to the location where the jughandle ramp intersects the road were varied to create three geometric scenarios. Figure 5. Typical geometry of the jughandle intersection featured in case A.
Figure 6. Typical geometry of the jughandle intersection featured in case B.
Figure 7. Typical geometry of the jughandle intersection featured in case C.
Researchers simulated each variation of the NJJI using preestablished intersection traffic-flow conditions. This was done using a specialized program to extract specific parameters from each of the output files generated by VISSIM. The researchers also used the list of files utilized as input for VISSIM for the data extraction tool. The program processed each VISSIM output file and produced a list with the following variables:
These output parameters provided the basis for statistical analysis and subsequent predictive model development. Discussion of Traffic Simulation Results The "forward/forward" (F/F) NJJI, "forward/ reverse" (F/R), and "reverse/reverse" (R/R) NJJI configurations had similar performance compared to the conventional intersections for low and medium traffic conditions. For high entering traffic volumes, the F/F NJJI, F/R NJJI, and R/R NJJI configurations reported lower average intersection delays in the ranges of 15 to 35 percent, 20 to 40 percent, and 25 to 40 percent, respectively, in comparison to conventional intersections. The maximum intersection capacity of the F/F NJJI, F/R NJJI, and R/R NJJI configurations were higher than conventional intersections. The differences were in the ranges of 20 to 25 percent, 25 to 30 percent, and 25 to 40 percent, respectively. The travel times for the conventional intersection were lower by 10 to 15 percent when compared to the F/F NJJI, F/R NJJI, and R/R NJJI configurations for low and medium entering volumes. However, the travel times for the conventional intersections were higher than the F/F NJJI, F/R NJJI, and R/R NJJI configurations for peak traffic flows. The NJJIs always had a higher number of stops per vehicle compared to conventional intersections, except during saturated traffic conditions where the NJJIs performed better than conventional intersections. The capacity of the NJJI decreases as the ramp offsets decrease. Reducing the minor road offsets and major road offsets from 137 meters to 70 meters (450 ft to 230 ft) resulted in a reduction in the left-turn capacity on the major road approach by approximately 30 percent. The alternative signal phasing with protected left-turn phasing on the minor approach reduced the major road capacity by 20 percent, increasing the minor road capacity by 30 percent and resulting in a net 10 percent decrease in the total serviced flow for all the NJJI configurations. The typical R/R NJJI, F/R NJJI, and F/F NJJI used in the study have maximum intersection capacities of 5,500 entering vph, 5,300 entering vph, and 5,150 entering vph, respectively. The changing of the left-turn maneuver (forward jughandle ramp) to a right-turn maneuver (reverse jughandle ramp) yields a 5 to 15 percent increase in intersection capacity based on the distribution of turning movement percentages on all of the intersection approaches. Simulation cases with three through lanes per approach on the major road, proportional increases in entering volumes for NJJIs, and conventional intersections resulted in very similar traffic performance as in cases with two lanes per approach on the major road. Estimating Measures of Effectiveness for NJJIs The researchers developed statistical models that estimated three variables of interest commonly used by practitioners in assessing intersection traffic performance. They developed the models using the nonlinear regression technique readily available in the SAS® software to express an exponential form. After several trials and iterations of different variables and model forms, the researchers developed the coefficients of the variables, which are given in table 1 for predicting average control delay (CD), in seconds per vehicle, average number of stops (ST), in stops per vehicle, and maximum queue (MQ) in feet. The section called "Cases Modeled" provides traffic flow ranges for the statistical models. All variables are significant beyond the 95 percent confidence level. Goodness-of-fit measures (in terms of the conventional R-squared statistic) are strong for all models. Although the regression is based on a nonlinear model, the R-squared statistic is acceptable, according to Kvalseth (4), when very few outliers are present. CD = EXPO [a0 + (a1 * XL1C1/10000 + a2 * XL2C2/10000 + a3 * XMNVOL/10000 + a4 * XMJVOL/10000 + a5 * XFWDREV + a6 * XREV + a7 * XSIG + a8 * XOFFTYPE)] MQ = EXPO [b0 + (b1 * XL1C1/10000 + b2 * XL2C2/10000 + b3 * XMNVOL/10000 + b4 * XMJVOL/10000 + b5 * XREV + b6 * XSIG + b7 * XOFFTYPE)] ST = EXPO [c0 + (c1 * XL1C1/10000 + c2 * XL2C2/10000 + c3 * XMNVOL/10000 + c4 * XMJVOL/10000 + c5 * XFWDREV + c6 * XREV + c7 * XOFFTYPE)] Where: a, b, and c are regression coefficients with corresponding measures of significance, model goodness of fit (table 1). XL1C1 = cross product of major left turn volume (vph) from the southern approach with the total minor road approach volume (vph) on the eastern approach(vph). XL2C2 = cross product of major left-turn volume (vph) from the northern approach with the total minor road approach volume (vph) on the western approach(vph). XMNVOL = sum of the minor road volumes (vph) on the eastern and western approaches. XMJVOL = sum of the major road volumes (vph) on the northern and southern approaches. XFWDREV = 1 if F/R type jughandle, else 0. XREV = 1 if R/R type jughandle, else 0. XOFFTYPE = 1 if minor road ramp offset less than 275ft , else 0. XSIG = 1 if non-protected left-turn phasing on side street, else 0. EXPO (exponential) = e = 2.716828
ConclusionsAlthough the results and conclusions apply specifically to the selected geometric dimensions and traffic characteristics in cases A, B, and C, generalizations can be made for NJJIs as an intersection type. The five main points are:
Additional InformationFor additional information, contact Joe Bared or Wei Zhang, Office of Safety R&D, 6300 Georgetown Pike, McLean, VA 22101-2296; tel. nos.: 202-493-3314, 202-493-3317. References
|