U.S. Department of Transportation
Federal Highway Administration
1200 New Jersey Avenue, SE
Washington, DC 20590
202-366-4000
Federal Highway Administration Research and Technology
Coordinating, Developing, and Delivering Highway Transportation Innovations
 |
| This report is an archived publication and may contain dated technical, contact, and link information |
|
Publication Number: FHWA-HRT-08-034
Date: August 2008 |
||||||||||||||||||||||||||||||||||||||||||||||||||||||||||||||||||||||||||||||||||||||||||||||||||||||||||||||||||||||||
Wildlife-Vehicle Collision Reduction Study: Report To CongressPDF Version (2.92 MB)
PDF files can be viewed with the Acrobat® Reader® Chapter 12. Cost-Benefit Analyses of Deer Collision Reduction MeasuresThis chapter summarizes the costs of the mitigation measures reviewed in this report and their effectiveness in reducing WVCs, specifically DVCs. The information in this chapter should be considered inclusively with the reviews on over 34 mitigation measures from information available in the literature (chapters 5–8) and the rankings of these measures by the Technical Working Group (chapter 10). The costs are presented (where possible) as cost per kilometer of road length per year. These costs were calculated from the various estimates found in the literature for the cost of each mitigation measure, as reported in the earlier chapters of this report. The potential benefits as a result of reducing DVCs will vary greatly depending on the measure, animal population density, type of roadway, and effectiveness of the measure. For this analysis, researchers used a hypothetical 1 km ( 0.62 mi) road section of a four-lane road (two lanes in each direction) that had five DVCs per year (see table 12). The benefits of mitigation were simply calculated as the avoided costs associated with the collisions prevented as a result of the mitigation measure. For this analysis, the cost associated with one DVC was estimated at $8,388 (see chapter 3). The avoided cost with the mitigation in place was then calculated by multiplying the cost of the collisions (five collisions times $8,388 per collision equals $41,940) times the effectiveness of the mitigation (expressed in terms of percent reduction in DVC). Effectiveness was estimated from information presented in the literature. Finally, the annual balance (dollar amount saved per kilometer per year) was calculated as benefit minus cost. It is important to note that the costs for these mitigation measures are primarily the responsibility of transportation agencies, while the benefits are mostly for insurance companies. Thus a positive balance between benefits and costs for a given mitigation measure generally indicates that the mitigation measure concerned could be a wise investment for society as a whole, but the costs and benefits are paid for and received by different groups in society. It should be noted that the costs and benefits in table 12 are based on the literature reviewed. The costs do not necessarily include all costs, such as maintenance, financing, and impact of construction on traffic. Benefits, as discussed in chapter 11, are measured inconsistently in the literature. Costs and benefits can vary widely for different sites and situations (e.g., geographic locations, effectiveness, frequency of WVCs, surrounding terrain). For these reasons, the dollar values presented in this chapter should be viewed as indicative rather than precise estimates. For some mitigation measures, the costs could not be translated to costs per kilometer per year, and no cost-benefit calculations were conducted. However, this does not necessarily mean that these mitigation measures are not effective in reducing DVCs or that they are not a wise investment. Instead it may only indicate that further research or analysis would be necessary to quantify their costs and benefits. The calculations presented here do not include inflation indexes, and discounting was not applied. Table 12 provides the best guess about costs, effectiveness, and benefits based on the information currently available. Nonetheless, the calculations only provide an initial insight into the balance between the costs and benefits of different mitigation measures and how the balance compares between measures. Note that measures for which no cost estimates and no effectiveness estimates were available were excluded from table 12. The remainder of this chapter discusses the values in table 12 for each mitigation measure for which sufficient data were available to conduct analysis.
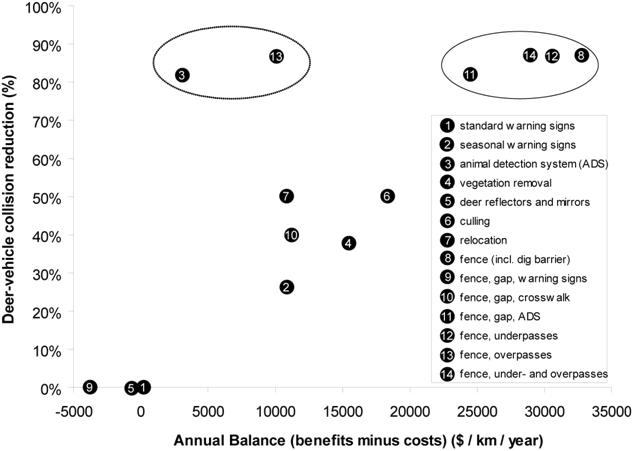
Assumes 1 km with 5 DVCs per year. * Costs not in dollars/km/year, but in a different unit; see text. ? = Unknown or uncertain. The costs and the potential reductions in WVCs resulting from a reduction in traffic volume, reduction of traffic speed, and the efforts of wildlife crossing assistants are unknown. Therefore these mitigation measures were not included in the analyses. Standard wildlife warning signs are relatively inexpensive: $62 for a 76 by 76 cm (30 by Too little is known about the costs or effectiveness of animal detection systems linked to an on-board computer or on-board animal detectors for these measures to be included in the analyses. Furthermore, the costs and benefits for these mitigation measures depend on the number of vehicles equipped with this technology rather than a standard cost per kilometer of road length per year. There are insufficient data available to evaluate the cost-benefit relationship for roadway lighting measures and public information and education programs. Vegetation removal, however, demonstrates more potential and may result in a positive balance of $15,437 per km ($24,858 per mi) per year. Assuming that deer reflectors and mirrors (life span 12.5 years, costs include maintenance) are indeed not effective in reducing DVCs, they have a negative balance of $495 per km ($797 per mi) per year. The costs for deer whistles are per vehicle rather than per kilometer per year; therefore, this mitigation measure was not included in the analyses. However, this measure is not considered effective. There are insufficient data available to analyze the cost-benefit relationship of audio and visual warning signals in the right of way, olfactory repellents, deer flagging, hazing, reducing or replacing road salt, intercept feeding, influencing the species composition and the nutritional quality of right-of-way vegetation, and carcass removal. Some carcass removal data were available, and costs were expressed in costs per kilometer per year based on the removal of five deer carcasses. Population culling is cheaper than wildlife relocation or anti-fertility treatment. The costs for these mitigation measures are typically expressed in costs per animal. These costs were translated to dollars per kilometer per year based on the following assumptions and estimates. The width of the zone that the culling, relocation, or anti-fertility treatment would be conducted in was based on the home range of white-tailed deer in a suburban environment (43 to 144 ha (106 to 356 acres)).(326,398,399) Assuming a home range of 75 ha (185 acres), a deer living within 977 m (3237 ft) (the diameter of the home range), could cross the road. For a 1-km (0.6-mi)-long road section, this zone is 97.7 ha (241 acres) for one road side and 195.4 ha (482 acres) for both road sides. Population densities of (suburban) white-tailed deer that are considered a "problem" have been estimated at 50–91 individuals per km2 .(57,400) Assuming a population density of Wildlife fences (life span 25 years, not including maintenance) reduce collisions with ungulates by 87 percent on average and have a positive balance of $32,728 per km ($52,702 per mile) per year. While insufficient data were available in the literature to evaluate cost-benefit for boulders in right of way (as an alternative to wildlife fences), assuming a life span of 80 years, the costs were estimated at $2,461 per km ($3,963 per mile) (boulders on both sides of the road) per year. The costs for long bridges and long tunnels were set at $781,250 and $1,500,000 per km ($1,258,051 and $2,415,459 per mile) per year respectively (80-year life span). Both long bridges and tunnels have a strongly negative balance. To accommodate animal movements from one side of a road to the other, wildlife fences are often combined with measures that allow animals to cross the road at grade or to cross under or over the road through crossing structures. This section focuses on crossing opportunities for large animals only (deer size and up). The cost-benefit analysis assumed one crossing opportunity per 2 km (1.2 mi) (0.5 crossing opportunity per km) (e.g., along Trans-Canada Highway in Banff National Park, Canada), even though higher concentrations of crossing structures for large mammals may be required.(352) In addition, gaps were set at a width of 100 m (328 ft), and the number of escape ramps between gaps was set at 2 per roadside (1 every 300 m (984 ft) between gaps). In addition, the animals could "escape" through the gaps. The number of escape ramps between crossing structures was set at 4 per roadside (two immediately next to a crossing structure (50 on either side from center), and two in between at 300-m (984-ft)-intervals between the crossing structures). The escape ramps on either side of a crossing structure are required because of the contiguous wildlife fencing and the assumption that animals will want to cross the road most often at the location of the crossing structures, as that should be one of the most important criteria for the placement of these crossing structures. The length of the fence was not reduced because of gaps or crossing structures because of possible additional fencing at gaps and overpasses and the contiguous nature of fencing for underpasses. In addition, for at-grade crossings, it was assumed that all deer movements that would have taken place in the unmitigated road section (and that resulted in 5 DVCs per km per year), would be funneled through these gaps, and that the number of DVCs is not reduced as the result of a potential reduction in the number of deer crossings because of the presence of the wildlife fence. The life span of the material associated with crosswalks was set at 10 years, while the life span for wildlife crossing structures was set at 80 years. The cost for the mitigation measure that includes a combination of wildlife fencing and under- and overpasses was based on 0.5 crossing structures per km, all of them underpasses except for one overpass every 25 km (15.5 mi). The cost for an underpass was set at $200,000, while the cost for an overpass was set at $3,500,000. The cost for an escape ramp was set at $8,500 (life span 80 years). Following this analysis, wildlife fences with gaps that are mitigated by warning signals have a negative balance, while wildlife fences in combination with a crosswalk, an animal detection system, wildlife underpasses, wildlife overpasses, or a combination of wildlife under- and overpasses all have a positive balance. Many of the mitigation measures showed a positive balance. Some of the mitigation measures (long tunnels, long bridges, and anti-fertility treatment) showed a strongly negative balance. Because of their strongly negative balance, these mitigation measures are not recommended, at least not from a strictly monetary perspective. The other mitigation measures had a positive or slightly negative balance. However, it is also important to evaluate mitigation measures on the balance of the problem that may not have been solved; none of the mitigation measures are 100 percent effective in reducing collisions, and if a substantial number of collisions and associated costs remain, a mitigation measure may not be attractive, despite a potential positive balance. Figure 60 shows the individual mitigation measures (excluding long tunnels, long bridges, and anti-fertility treatment) in relation to their balance and effectiveness. The figure has several groupings. Based on the rough estimates in this chapter, wildlife fencing, with or without wildlife underpasses or a combination of wildlife underpasses and overpasses, and animal detection systems with wildlife fencing have high effectiveness and a high return on investment. (identified by solid oval, measures 8, 11, 12, and 14 in figure 60 ). Animal detection systems without wildlife fences or wildlife fences with a high density of wildlife overpasses (identified by dashed oval, measures 3 and 13 in figure 60) also have high effectiveness, but their positive financial balance is less strong. Figure 60. Graph. Annual balance and collision reduction for the different mitigation measures (further explanation in text). |