U.S. Department of Transportation
Federal Highway Administration
1200 New Jersey Avenue, SE
Washington, DC 20590
202-366-4000
Federal Highway Administration Research and Technology
Coordinating, Developing, and Delivering Highway Transportation Innovations
 |
| This report is an archived publication and may contain dated technical, contact, and link information |
|
Publication Number: FHWA-HRT-08-034
Date: August 2008 |
|
Wildlife-Vehicle Collision Reduction Study: Report To CongressPDF Version (2.92 MB)
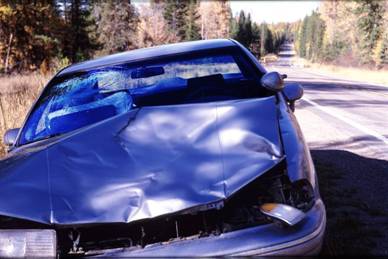
PDF files can be viewed with the Acrobat® Reader® Executive SummaryAmerica's highways allow people and products to travel to every corner of our nation. Along the way, these roads cross through the habitat of many native wildlife species. When these paths intersect, collisions can occur, and in greater numbers than most people realize. Based on the results of this study, there are an estimated one to two million collisions between cars and large animals every year in the United States. This presents a real danger to human safety as well as wildlife survival. State and local transportation agencies are looking for ways to meet the needs of the traveling public, maintain human safety, and conserve wildlife. Under Section 1119 (n) of the Safe, Accountable, Flexible, and Efficient Transportation Equity Act: A Legacy for Users (SAFETEA-LU), the U.S. Congress directed the Secretary of Transportation to conduct a national wildlife-vehicle collision (WVC) study. This study details the causes and impacts of WVCs and identifies potential solutions to this growing safety problem. The report focuses on mitigation methods that reduce the number of collisions between vehicles and large wildlife, such as deer, because these accidents present the greatest safety danger to travelers and cause the most damage (Figure ES1). This summary of the full report highlights the major findings and serves as an introduction to the issue of WVCs. Major findings include:
Figure ES1. Photo. A collision with a white-tailed deer can result in extensive property damage (copyright: Marcel Huijser).
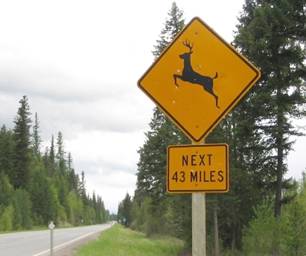
Figure ES2. Photo. Standard deer warning sign along Montana Highway 83 (copyright: Marcel Huijser).
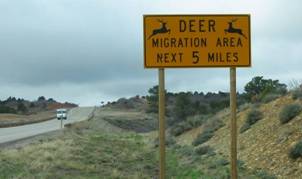
Figure ES3. Photo. Seasonal deer migration sign in Utah (copyright: Marcel Huijser).
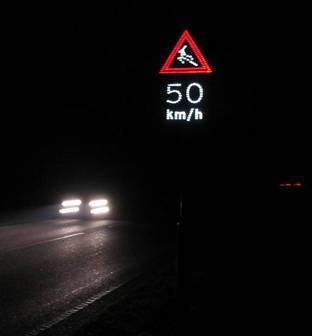
Figure ES4. Photo. Wildlife warning and advisory speed limit reduction signs triggered by an animal detection system in ‘t Harde, The Netherlands (copyright: Marcel Huijser).
This document concludes with recommendations for further action. Policymakers who are interested in reducing WVCs can begin by considering the following actions:
Wildlife-Vehicle Collisions: A Growing Problem on U.S. RoadsIsn't This Just a Rural Problem?According to data from national crash databases, 89 percent of all WVCs (2001–2005) were on two-lane roads. This might lead some people to conclude that WVCs are only a problem in remote, rural locations, but two-lane roads and WVCs are also prevalent in areas where many people live and commute to work in nearby cities. Such two-lane highways are critical travel corridors, and, in the United States, drivers use two-lane roadways for the majority of the total highway miles they travel. Therefore, WVCs are a challenge in every state and for almost all drivers across the country. How Many Accidents Are There?Estimates of the total number of WVCs are based on several sources, including crash statistics (from police and highway patrol report information), roadside carcass counts, insurance industry claims information, and interviews with the public. National crash databases estimate the total number of reported collisions at 300,000 per year. However, most researchers believe that WVCs are substantially under-reported for a number of reasons. Crash databases typically exclude accidents that have less than $1,000 in property damage, not all drivers report collisions with animals, and not all law enforcement, natural resource, or transportation agencies have the resources to collect detailed information on WVCs. Furthermore, many animals that are injured wander away from the road before they die and are never found. Using a combination of carcass count data, insurance industry information, police-reported crashes, and interviews with the public, this study estimates that there are between one and two million collisions between vehicles and large animals in the United States every year. Almost all animal-vehicle collisions (AVCs) resulted in no human injury (95.4 percent). Collisions with moose and other large animals can have a higher likelihood of resulting in harm to the vehicle occupant (figure ES5 and figure ES6).
Figure ES5. Graph. Human injury from AVCs (primarily deer).
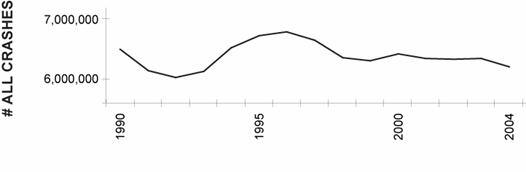
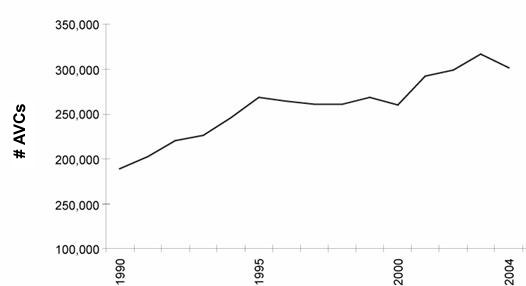
Figure ES6. Graph. Animal species involved in fatal (to human) collisions, Maine. Is the Number of Accidents Increasing?National trends were studied in a review of several sources of crash data. Figure ES7 and Figure ES8 illustrate that from 1990 to 2004, the number of all reported motor vehicle crashes has been holding relatively steady at slightly above six million per year. By comparison, the number of reported AVCs (includes wildlife and domestic animals) has increased by approximately 50 percent over the same period, from less than 200,000 per year in 1990 to a high of approximately 300,000 per year in 2004. Looking at the data another way, AVCs now represent approximately 5 percent (or 1 in 20) of all reported motor vehicle collisions.
Figure ES7. Graph. Total vehicle crashes.
Figure ES8. Graph. Total AVCs (including wildlife and domestic animals). The increase in WVCs appears to be associated with an increase in vehicle miles traveled (VMT) and an increase in deer population sizes in most regions in the United States. The occurrence of WVCs, however, is associated with many more factors, as reflected by their characteristics, which include:
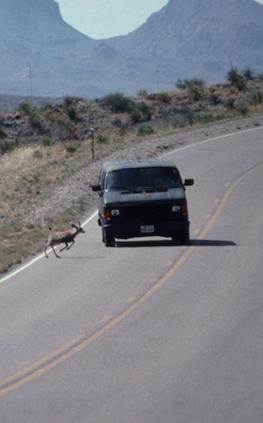
What are the Consequences? The costs and impacts to drivers and animalsWVCs can have a broad range of consequences for both motorists and animals. Though human injuries and fatalities resulting from WVCs are relatively rare, they do occur and are a serious consequence. More common results are vehicle damage, secondary motor vehicle crashes, emotional trauma, and less direct impacts such as travel delays. WVCs can also require the assistance of law enforcement personnel, emergency services, and road maintenance crews for potential repairs and carcass removal. For animals, WVCs present an immediate danger to their individual survival, and certain threatened and endangered species are faced with a further reduction in their population survival probability. Impacts on TravelersSafety RiskCollisions with large animals pose a safety risk to humans as well as wildlife (Figure ES9). Based on research from various states, roughly 4–10 percent of reported WVCs involving large animals result in injuries to drivers and their passengers. While this may not appear to be a large percentage, this translates into approximately 26,000 injuries per year that are attributable to these accidents.
Figure ES9. Photo. A mule deer is hit by a vehicle in Big Bend National Park, TX (copyright: Marcel Huijser). Similarly, only a very small proportion of crashes with large animals result in human fatalities. Nonetheless, an estimated 200 people die from WVCs in the United States every year. From 2001 to 2005, an average of 38,493 fatal crashes occurred.(2) Hence WVCs represent roughly 0.5 percent of fatal crashes. Direct Monetary ImpactsFor vehicle owners, the most common direct cost incurred from a WVC is damage to their vehicle. Most research indicates that more than 90 percent of collisions with deer result in damage to the driver's car or truck. Nearly 100 percent of collisions with larger animals—such as elk or moose—end with substantial vehicle damage. Due to the size and weight of the animals, damage to the vehicle can be costly. Based on numerous studies, the average cost of repairing a vehicle after colliding with a deer was estimated at $1,840. For collisions with elk and moose, the averages increase to $3,000 and $4,000, respectively. Drivers may incur other direct costs if they must have their vehicle towed after the accident. If an injury occurs, drivers and passengers may face expenses from medical care and possibly lost wages from missed work. WVCs have financial implications for public agencies as well. Law enforcement agencies face direct costs of investigation and traffic control following a collision. Transportation agencies typically are responsible for carcass removal and disposal costs and infrastructure repair costs, if necessary. Public agencies may incur some financial losses based on the monetary value of the animal itself, value associated with its hunting or license fees or recreational attraction for wildlife viewing. The best estimate of the total annual cost associated with WVCs, based on available data, is calculated to be $8,388,000,000. Collisions with deer constitute the single largest collision category involving human and vehicle costs. The average costs from a collision with a deer include the following:
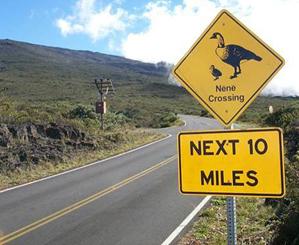
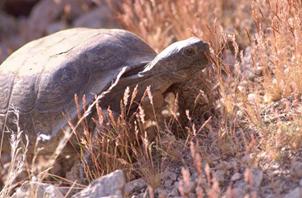
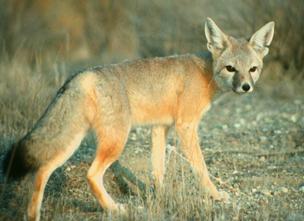
Indirect Impacts on TravelersWVCs can have other impacts on travelers that are more difficult to quantify in fiscal terms. Accidents involving large animals can lead to travel delays or secondary accidents for subsequent motorists if the vehicle or animal lies in the right of way. Some drivers also experience emotional trauma as a result of the danger they experienced and the killing of a large animal. Impacts on WildlifeWVCs are a serious safety risk for animals. In most cases, an animal that has been hit by a vehicle dies immediately or shortly after a collision. Clearly, these deaths affect the immediate survival of many individual animals. However, they also represent a serious conservation issue. For some species, the long-term survival of a local or regional population may be threatened, especially in combination with other factors such as habitat loss due to agriculture and urbanization. This study identified 21 federally listed threatened or endangered animal species in the United States for which road mortality is among the major threats to the survival of the species. These species include birds such as the Hawaiian goose (Figure ES10), reptiles such as the desert tortoise (Figure ES11), mammals such as the San Joaquin kit fox (Figure ES12), and amphibians such as the California tiger salamander.
Figure ES10. Photo. Hawaiian goose warning sign (copyright: Haleakala National Park, National Park Service).
Figure ES11. Photo. Desert tortoise (copyright: Marcel Huijser).
Figure ES12. Photo. San Joaquin kit fox (copyright: Brian L. Cypher, California State University, Stanislaus, Endangered Species Recovery Program).
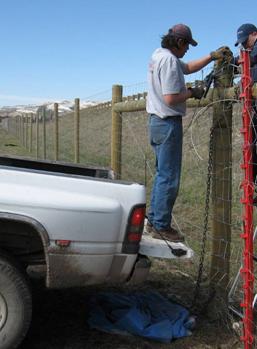
Can the Number of Collisions be Reduced? Methods for Preventing CollisionsFor this study, 34 different techniques aimed at reducing the number of WVCs were identified and reviewed. This section presents only some examples of the mitigation measures aimed at reducing WVCs; other measures are described and evaluated in the main text of the report. The measures are grouped into four major categories: efforts to change or influence the behavior of wildlife, efforts to reduce wildlife population size, efforts to change or influence a driver's behavior, and planning and design approaches. It should be noted that the Federal Highway Administration (FHWA) is not recommending these measures by including them in this report. Influencing Wildlife BehaviorWVCs can be reduced by influencing the behavior of animals. These efforts either attempt to deter animals from approaching the roadway or direct the animals toward a safer location to cross the road. Wildlife fences that separate animals from the roadway have a successful record of reducing WVCs and are now used extensively. Wildlife fences typically consist of wire mesh fence material that is 2 to 2.5 m (6.5 to 8 ft) tall, running parallel to the roadway (Figure ES13). Numerous studies in the last 20 years have demonstrated that wildlife fencing, with or without wildlife crossing structures, can reduce collisions with deer and other large animals by 87 percent on average (80–99 percent).
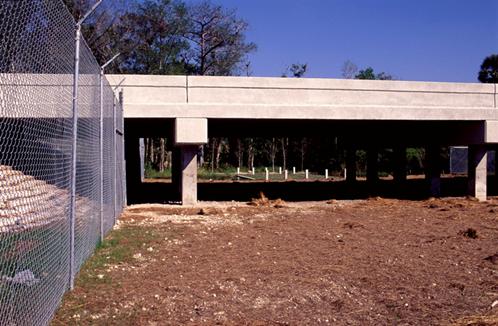
Figure ES13. Photo. Wildlife fencing along Interstate 90 near Bozeman, MT (copyright: Marcel Huijser). While correctly installed wildlife fencing is highly effective in reducing collisions, it must be carefully applied to avoid unintentional effects such as creating an absolute barrier that keeps animals from accessing habitat on the other side of the road. In addition, animals are more likely to break through the wildlife fencing if safe crossing opportunities are not provided or if these opportunities are too few, too small, or too far apart. Therefore wildlife fencing is usually combined with safe crossing opportunities, such as wildlife underpasses (Figure ES14 and fFigure ES15) and overpasses. In addition, wildlife jump-outs are usually integrated with wildlife fencing. These features allow animals that do manage to cross the fence to escape from the fenced road and right of way.
Figure ES14. Photo. Wildlife underpass in southern Florida that allows for ecosystem process (hydrology) as well as wildlife use, including the Florida panther (copyright: Marcel Huijser). Wildlife underpasses and overpasses provide safe road crossing opportunities for a wide array of species, allowing them to continue to move across the landscape. These structures are typically used in combination with wildlife fences that keep the animals from entering the roadway and that funnel the animals toward the overpasses and underpasses. In some cases wildlife underpasses and overpasses have no or very limited wildlife fencing, making them the primary measure to reduce WVCs on short road sections. The location, type, and dimensions of wildlife crossing structures must be carefully planned with regard to the species and surrounding landscape. For example, grizzly bears, deer, and elk tend to use wildlife overpasses to a greater extent than wildlife underpasses, while black bears and mountain lions use underpasses more frequently than overpasses. In addition, different species use different habitats, influencing their movements and where they want to cross the road. Other factors that should be considered are the vegetation in the direct vicinity of the crossing structure, co-use by humans, and the time it takes for animals to learn the location of the structures and to learn that they are safe to use. Although wildlife overpasses are more common in Europe than North America, some of the best studied examples are located in Banff National Park in Canada, and multiple large overpasses are planned in the United States.
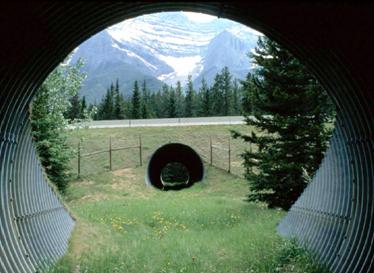
Figure ES15. Photo. Large culvert with vegetative cover and fencing on Highway 1 in Canada (copyright: Tony Clevenger). Large boulders parallel to the road can be an alternative to wildlife fencing, especially if landscape aesthetics are a concern. Preliminary data suggest that hoofed animals are reluctant to walk across large boulders. Smaller rocks have also been used at fence ends to discourage hoofed animals from wandering in between the fences. Long tunnels (or landscape bridges) are tunnels that are at least several hundreds or thousands of yards long (Figure ES16 ). Long bridges (or elevated road sections) are bridges that span a similar distance. Long tunnels and bridges are primarily constructed because of the nature of the terrain (e.g., through a mountain, across a floodplain), but in some cases they are constructed to avoid areas that are ecologically very sensitive and where no alternatives are available. If the nature of the terrain permits, animals can move freely over long tunnels or under long bridges, and because the animals are physically separated from traffic, WVCs are eliminated. However, long tunnels or bridges are rarely specifically designed to reduce WVCs.
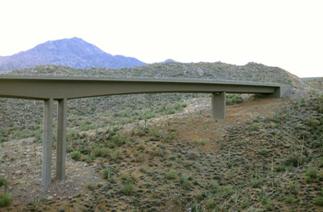
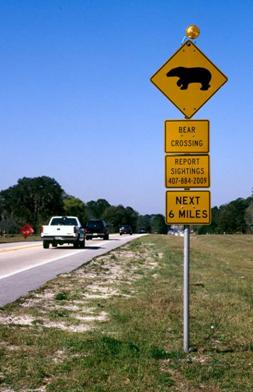
Figure ES16. Photo. Long bridge on Arizona Highway 260 constructed in such a way as to minimize the impact to soil and vegetation (copyright: Marcel Huijser). Reducing Wildlife Population SizeWildlife culling involves a substantial reduction in the population size of a particular species in a certain area. When used, this measure is typically applied to deer. Culling is sometimes done by recreational hunters through increased deer quotas and sometimes it is accomplished by hiring professionals. The elimination of does (females) is more effective than the killing of bucks (males) because there is a greater impact on the reproductive potential of a population. Culling efforts are more likely to result in a substantial reduction in deer population size if the herd size is relatively small to begin with and if it is a closed population that does not allow influx of animals from nearby places. Data on the effect of culling on deer-vehicle collisions (DVCs) are scarce. One field test in Minnesota showed that a deer population reduction program reduced winter deer densities by 46 percent and DVCs by 30 percent. Sharpshooting by professionals using bait was deemed to be the most effective and adaptable culling method in an urban setting, as opposed to controlled hunts in large parks and refuges or opportunistic sharpshooting by professionals. The effort will have to be repeated periodically, as the deer population will return to the same levels if the habitat conditions remain similar; culling is not a one-time-only measure. In addition, the effort involved for population size reduction programs increases disproportionately with higher population size reduction goals, and substantial reductions (for example ≥ 50 percent) may be hard to obtain, perhaps capping the potential reduction in DVCs at 50 percent. Finally, wildlife culling can meet with strong public opposition. Modifying Driver BehaviorEfforts aimed at helping motorists avoid collisions depend on providing the driver with information. The driver may then take action, for example, by choosing when or where to drive, remaining alert, or lowering vehicle speed (Figure ES17).
Figure ES17. Photo. Permanently flashing Florida black bear warning signs in the Ocala National Forest, FL (copyright: Marcel Huijser). Animal detection systems use sensors to detect large animals that approach the road. Once a large animal is detected, warning signals are activated to inform drivers that a large animal may be on or near the road at that time. Such systems have been installed at over 30 locations in North America and Europe. Limited data exist on the effectiveness of animal detection systems, but a Swiss study showed that collisions with large hoofed animals were reduced by 82 percent on average for seven different locations. While these data are encouraging, animal detection systems should still be regarded as experimental, as more data on their effectiveness is needed. Animal detection systems applied over long road sections do not restrict animal movements. Animal detection systems may also be applied at gaps in a wildlife fence or at fence ends. This mitigation measure still allows large animals to be on the roadway, and the posts, sensors, and other equipment associated with the system may pose a safety hazard of their own. Public information and education programs aim to increase motorists' awareness of the impacts, causes, and high risk locations of WVCs. These campaigns may also offer advice on how to avoid crashes with animals or how to reduce their severity. Dissemination of this information is often targeted to drivers at specific high risk locations or during seasons of high wildlife movement. Little research has been conducted to conclude whether these efforts are effective on their own; therefore, they are generally integrated with other mitigation measures. Planning and Design MethodsIntegration of transportation planning and wildlife management on a regional or statewide level can help to reduce WVCs. These efforts do not generally reduce WVCs in a direct or easily quantifiable manner. However, by working together, planners from transportation, resource, park, and other agencies find opportunities to share information and make planning decisions that help prevent or reduce WVCs. Examples include:
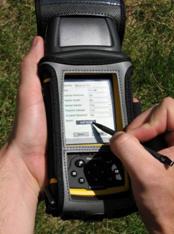
Which Methods Are Most Effective?There is no single, low-cost solution for WVCs that can or should be applied everywhere. A successful mitigation strategy requires a detailed, location-specific analysis of the problem and often involves a combination of different types of mitigation measures. Nonetheless, wildlife fences, with or without wildlife crossing structures, animal detection systems, and long tunnels or bridges, reduce or may reduce WVCs substantially (≥ 80 percent). Of these mitigation measures, wildlife fences, with or without wildlife crossing structures and animal detection systems, are among the most cost-effective measures. Are We Making Progress? Challenges Faced by Transportation AgenciesWith several successful WVC mitigation methods available, why hasn't more progress been made toward reducing the number of WVCs? This study identified several challenges that currently prevent a systematic, nationwide approach to WVC reduction. Gaps in Knowledge, Insufficient Information, and Lack of DataThere are no standards or guidelines for the collection of data on WVCs. Data are collected inconsistently and often haphazardly, and methods vary between states and agencies. Some transportation agencies do not collect this type of data at all. Without reliable, consistent data, it is difficult to identify road sections where mitigation methods may be required, to select an appropriate mitigation measure, or to evaluate whether that effort is making a difference. Future analyses should also include additional statistical methods to analyze the data.
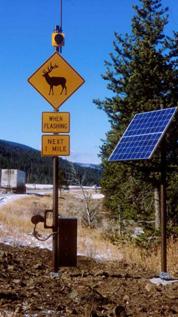
Figure ES18. Photo. Roadkill observation collection system (ROCS), a GPS-enabled PDA for animal carcass data collection (copyright: Amanda Hardy, WTI). Research and Evaluation of Mitigation MeasuresWhile several mitigation methods show promise, transportation agencies need data that show the effectiveness of different types of mitigation measures to justify their deployment. Additional research and field demonstration of WVC reduction techniques (Figure ES19) help advance the state of the practice as results depend on the type of problem, the species involved, and local circumstances. Long-term monitoring of the effectiveness of the mitigation measures is needed, as WVC numbers are highly variable in nature. In addition, wildlife use of crossing structures tends to increase over time, as animals need time to learn their locations and learn that they are safe to use. TrainingWhile many transportation agencies are interested in reducing WVCs, their staff may not have the knowledge or experience to select effective methods. DOT planners and design engineers need training and guidance materials before they can begin to implement WVC reduction plans.
Figure ES19. Photo. Animal detection system along U.S. Highway 191 in Yellowstone National Park, MT (copyright: Marcel Huijser). Where Do We Go From Here? Opportunities and Next StepsThis study has provided an opportunity to document the central issues related to WVCs on America's highways: the magnitude and trend of the problem, the dangers posed to both drivers and animals, successful and promising methods for reducing the number of collisions, and challenges that lie ahead. More importantly, the findings of this study can help policymakers make informed choices regarding future efforts to reduce WVCs. Policymakers who wish to take the lead in advancing effective WVC safety measures can begin by considering the following recommendations:
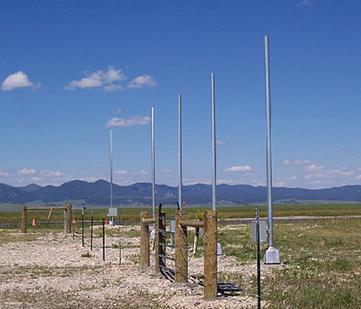
Figure ES20. Photo. Animal detection test-bed used to test the reliability of multiple animal detection systems, Lewistown, MT (copyright: Marcel Huijser, WTI).
|