U.S. Department of Transportation
Federal Highway Administration
1200 New Jersey Avenue, SE
Washington, DC 20590
202-366-4000
Federal Highway Administration Research and Technology
Coordinating, Developing, and Delivering Highway Transportation Innovations
 |
| This techbrief is an archived publication and may contain dated technical, contact, and link information |
|
Publication Number: FHWA-HRT-08-045
Date: March 2008 |
||||||||||||||||||||||||||||||||||||||||||||||||||||||||||||||||||||||||||||||||||||||||||||||||||||||||||||||||||||||||||||||||||||||||||||||
Safety Evaluation of STOP AHEAD Pavement MarkingsFHWA Contact: Roya Amjadi, This document is a technical summary of the Federal Highway Administration report, Safety Evaluation of STOP AHEAD Pavement Markings, FHWA-HRT-08-043. PDF Version (643 KB)
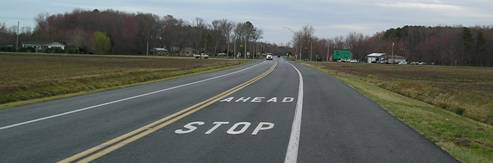
PDF files can be viewed with the Acrobat® Reader® OBJECTIVEThe Federal Highway Administration (FHWA) organized 26 States to participate in the FHWA Low-Cost Safety Improvements Pooled Fund Study as part of its strategic highway safety plan support effort. The purpose of the study is to evaluate the safety effectiveness of several low-cost safety improvement strategies through scientifically rigorous crash-based studies. One of the strategies evaluated for this study was STOP AHEAD pavement markings. STOP AHEAD pavement markings are intended to reduce the frequency of crashes related to lack of driver awareness of stop control at unsignalized intersections. The safety effectiveness of this strategy had not previously been thoroughly documented; therefore, this study attempts to provide an evaluation of STOP AHEAD pavement markings through scientifically rigorous procedures. INTRODUCTIONIntersections account for a small portion of the total highway system, yet in 2005, approximately 2.5 million intersection-related crashes occurred. This number represents 41 percent of all reported crashes. In addition, 8,655 fatal crashes (22 percent of the total 39,189 fatal crashes) occurred at or within an intersection environment in 2005.(1) Driver compliance with intersection traffic control is vital to intersection safety. Many unsignalized intersections may be unexpected or may not be visible to approaching drivers. Therefore, enhancing the visibility and conspicuity of unsignalized intersections has the potential to reduce the number of crashes associated with drivers' lack of awareness of such intersections. Providing pavement markings with supplementary messages (such as STOP AHEAD) can help alert drivers on the stop-controlled approach to the presence of an intersection. An example of a STOP AHEAD pavement marking is shown in figure 1.
Figure 1 . Example of a Rural STOP AHEAD Installation. A literature review did not uncover any studies related to the safety or operational effectiveness of STOP AHEAD pavement markings. Several studies have investigated STOP AHEAD signs, but these studies focused on operational effectiveness. One study investigated STOP AHEAD signs as a means of warning drivers of an upcoming, unexpected, and partially concealed stop-controlled intersection during daytime and nighttime driving conditions.(2) The study concluded that STOP AHEAD signs do not provide adequate visual stimulus; STOP AHEAD pavement markings may provide better visual stimulus to the driver due to the size and placement of the message. It is clear that a thorough investigation is needed to evaluate the safety effectiveness of STOP AHEAD pavement markings for different configurations of unsignalized intersections. MethodologyTwo States, Arkansas and Maryland, installed STOP AHEAD pavement markings at spot locations. Two counties in Minnesota implemented this pavement marking strategy as a blanketed effort (i.e., they were installed at all two-way stop-controlled intersections within the jurisdiction). Data were obtained from 8 sites in Arkansas, 9 sites in Maryland, and 158 sites in Minnesota. Data collected included the location and date of installation as well as the relevant geometric, traffic, and crash data. The analysis included a total of 1,669 intersection-years of data (69 intersection-years from Arkansas, 59 intersection-years from Maryland, and 1,541 intersection-years from Minnesota). Empirical Bayes (EB) methods were incorporated in a before-after analysis to determine the safety effectiveness of STOP AHEAD pavement markings. The EB methodology for observational before-after studies(3) was used for the evaluation. Safety performance functions (SPFs) were calibrated separately for each State for use in the EB methodology. Generalized linear modeling was used to estimate the model coefficients using the software package STATA®,(4) assuming a negative binomial error distribution which is consistent with the state of research in developing these models. SPFs were estimated for the following crash classifications:
The full report includes a detailed explanation of the methodology, including a description of how the estimate of percent reduction is calculated. ResultsTwo sets of results were calculated. One set contains aggregate results for Arkansas and Maryland combined, as well as for each State individually. The other set is based on a disaggregate analysis that attempts to discern factors that may be most favorable to installing STOP AHEAD pavement markings. The aggregate analysis provides evidence for the general effectiveness of the strategy while the disaggregate analysis provides insight on the situations where the strategy may be most effective or most favorable (e.g., number of approaches, type of stop control, etc.). The Minnesota results are not combined with the other two States because crash rates at the STOP AHEAD sites are relatively low in that State and the installations were blanketed. Aggregate AnalysisThe aggregate results, shown in table 1, indicate a statistically significant reduction in total crashes in both Arkansas and Maryland, and overall for the two States combined. For both right-angle and rear-end crashes, the only significant change for the two primary States was in Arkansas, for which the decreases in crashes were statistically significant at the 95-percent confidence level for both crash types. For injury crashes, the crash reduction for the two States combined is statistically significant at the 90-percent confidence level. The results from Minnesota were not included in the combined model but support the conclusion from the evaluation of the other two States' implementations that this strategy is effective for reducing crashes. Please note the large standard errors in the Minnesota results.
NOTE: Negative sign indicates an increase in crashes. Bold denotes statistically significant results at the 95% confidence level. Disaggregate AnalysisA disaggregate analysis of the Maryland and Arkansas sites was completed to determine if safety effects are more or less pronounced for specific conditions. Table 2 presents the results of the disaggregate analysis. The results of the disaggregate analysis are based on injury crashes and all crashes combined.
NOTE: Bold denotes statistically significant results at the 95% confidence level. A disaggregate analysis could not be completed for area type (i.e., urban versus rural) because there were only two sites located in urban areas out of the 17 total sites. Thus, the results apply in general to rural sites, although the analysis was based on all 17 sites. The results are as follows:
Further investigation was undertaken to ensure that the effects were not due to biases in the analysis. There are advantages and disadvantages to applying the results from the disaggregate analysis. The disaggregate analysis can shed light on specific conditions where strategies may be most effective; however, disaggregate analyses are, by nature, based on smaller sample sizes than aggregate analyses. Smaller samples lead to larger confidence intervals and less precise results. In the case of the STOP AHEAD analysis, the aggregate analysis provides support for the use of this strategy (i.e., STOP AHEAD pavement markings are associated with a general reduction in crashes). The disaggregate analysis indicates specific conditions that should be given priority due to the relative effectiveness of this strategy (three-legged and AWSC locations). Economic AnalysisAn economic analysis was completed to evaluate the economic feasibility of STOP AHEAD pavement markings. An estimate of the life cycle costs of the strategy was first developed and expressed as an annual cost. The crash benefits required to offset these costs were then estimated using the most recent FHWA unit crash cost data for unsignalized intersections. Installation and maintenance cost data provided by the two States suggests a conservatively high annual cost of $78 per approach for latex material and $366 per approach for thermoplastic material installations. This requires a $156 and $732 annual savings in crash costs per latex and thermoplastic installation, respectively, to achieve a 2:1 benefit-cost ratio. The results indicate significant reductions in total crashes, and the remainder of the economic analysis is based on total crashes; therefore, an undefined crash was used to reflect the cost of total crashes. The most recent FHWA mean comprehensive costs per undefined crash for unsignalized intersections is $55,060, based on 2001 dollar values.(5) Comprehensive crash costs represent the present value, computed at a discount rate, of all costs over the victim's expected life span that result from a crash. The major categories of costs used in the calculation of comprehensive crash costs include medical-related costs, emergency services, property damage, lost productivity, and monetized quality-adjusted life years.(5) The necessary savings to achieve a 2:1 benefit-cost ratio would require a reduction in total crashes of 0.006 crashes per intersection-year for the latex application, assuming TWSC with installations on two approaches. The corresponding number for the thermoplastic application is 0.027 crashes per intersection-year, assuming a TWSC installation. The necessary reductions per intersection-year would, however, change for an AWSC intersection. The necessary savings would require a reduction of 0.011 total crashes per intersection-year for the latex application while thermoplastic installations would require a reduction of 0.053 crashes per intersection-year. Based on the aggregate and disaggregate results, the necessary reductions are easily achievable; however, the benefits will be less pronounced for intersections with relatively low crash rates. While there is a realized benefit after installing STOP AHEAD pavement markings, a reduction of 0.05 crashes per intersection-year is not possible to achieve a 2:1 benefit-cost ratio for thermoplastic installations at AWSC locations. SummaryThe results of the aggregate analysis indicate a statistically significant reduction in total crashes for Arkansas, Maryland, and overall for the two States combined. For both right-angle and rear-end crashes, the only significant change for the two States is in Arkansas, for which there is a statistically significant reduction in both crash types at the 95-percent confidence level. The aggregate analysis in Arkansas and Maryland indicates that STOP AHEAD pavement markings may significantly reduce total crashes at unsignalized intersections. The results for Minnesota support the conclusion from the evaluation of the other two States' implementations that this strategy is effective for reducing crashes. The disaggregate analysis provided further insight into the circumstances where crash reductions were identified. Installations at three-legged intersections were found to be more effective than at four-legged intersections. The analysis also indicates a highly significant reduction in injury and total crashes for AWSC intersections. The effectiveness of STOP AHEAD pavement markings also appeared to vary by AADT, but these indications are based on too small of a sample size to support a definitive conclusion on the impact of AADT. ConclusionA reduction in crashes can be expected with the installation of STOP AHEAD pavement markings. The results are consistent between Arkansas and Maryland, which are combined in the main analysis. Minnesota was not included in the main analysis because of the relatively low crash rates at the STOP AHEAD sites; however, the results support those from Arkansas and Maryland. The aggregate analysis supports the conclusion that a total crash reduction of at least 15 percent can be expected with the installation of STOP AHEAD pavement markings as presented in table 3. It is likely that STOP AHEAD pavement markings will be most effective at locations with a high frequency of target collisions (i.e., right-angle and rear-end), particularly where driver awareness may be an issue. The disaggregate analysis supports that the reduction may not be consistent across intersection types and provides evidence for those locations where this strategy may be most effective. Given the low-cost of this strategy, even with conservative assumptions, a modest reduction in crashes is needed to justify their use. Based on the evidence provided by the estimated safety effectiveness of STOP AHEAD pavement markings, the necessary reduction to obtain a 2:1 benefit-cost ratio is easily achieved. Therefore, this strategy has the potential to reduce crashes cost-effectively, particularly at three-legged and AWSC intersections with a high-crash frequency.
1 The conservative estimates are based on the lower 95% confidence interval and are calculated as the point estimate minus 1.96 times the standard error. Note: Bold numbers indicate statistically significant results at the 95% confidence level. References
|