U.S. Department of Transportation
Federal Highway Administration
1200 New Jersey Avenue, SE
Washington, DC 20590
202-366-4000
Federal Highway Administration Research and Technology
Coordinating, Developing, and Delivering Highway Transportation Innovations
 |
| This report is an archived publication and may contain dated technical, contact, and link information |
|
Publication Number: FHWA-HRT-08-051
Date: June 2008 |
|||||||||||||||||||||||||||||||||||||||||||||||||||||||||||||||||||||||||||||||||||||||||||||||||||||||||||||||||||||||||||||||||||||||||||||||||||||||||||||||||||||||||||||||||||||||||||||||||||||||||||||||||||||||||||||||||||||||||||||||||||||||||||||||||||||||||||||||||||||||||||||||||||||||||||||||||||||||||||||||||||||||||||||||||||||||||||||||||||||||||||||||||||||||||||||||||||||||||||||||||||||||||||||||||||||||||||||||||||||||||||||||||||||||||||||||||||||||||||||||||||||||||||||||||||||||||||||||||||||||||||||||||||||||||||||||||||||||||||||||||||||||||||||||||||||||||||||||||||||||||||||||||||||||||||||||||||||||||||||||||||||||||||||||||||||||||||||||||||||||||||||||||||||||||||||||||||||||||||||||||||||||||||||||||||||||||||||||||||||||||||||||||||||||||||||||||||||||||||||||||||||||||||||||||||||||||||||||||||||||||||||||||||||||||||||||||||||||||||||||||||||||||||||||||||||||||||||||||||||||||||||||||||||||||||||||||||||||||||||||||||||||||||||||||||||||||||||||||||||||
Surrogate Safety Assessment Model and Validation: Final ReportPDF Version (3.39 MB)
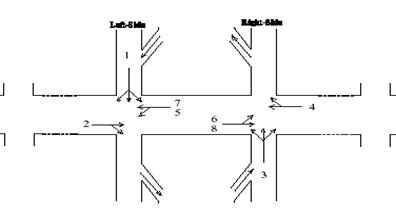
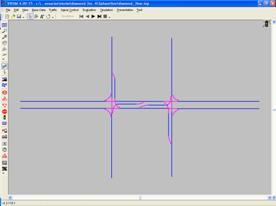
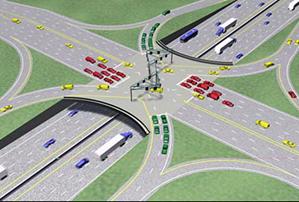
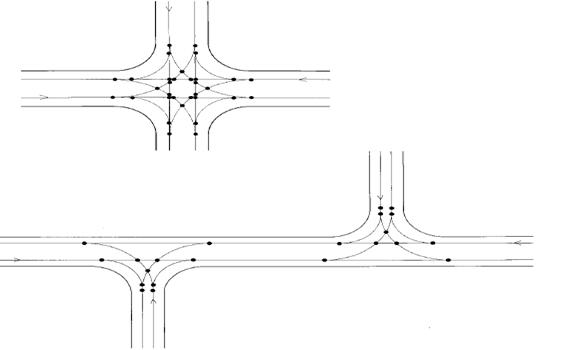
PDF files can be viewed with the Acrobat® Reader® Chapter 3. Theoretical Validation (Continued)Case 5: Three-Phase Interchange Versus Four-Phase Interchange (VISSIM)This case study compares the safety performance of the two primary types of traffic control logic for diamond interchanges. A diamond interchange, as shown in figure 60, is composed of two closely spaced signalized intersections that connect the surface street system to the freeway system. One controller is most often used to control both intersections of a diamond interchange. Because of this, both intersections of the interchange are dealt with together as a single entity. Two alternatives for interchange traffic control are typically used: three-phase signal control and four-phase signal control.
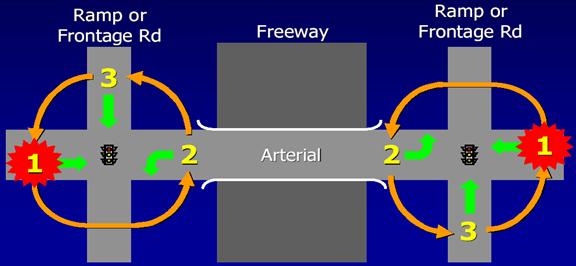
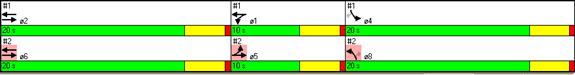
Figure 60. Illustration. Diamond Interchange. Three-phase is a legacy term that implies the concurrent service of the two cross-road movements, the two left-turn movements, and the two frontage-road movements during common phases as well as a cross-road left-turn phase that lags (or follows) that of the conflicting cross-road through movement.(7) The interior left turns lag the arterial through movements. The disadvantage of the three-phase sequencing for diamond interchange is that the vehicles on the interior of the diamond cannot be guaranteed to clear during one cycle. Three-phase sequencing is applicable for very wide interchanges over 183 m (600 ft) wide and for traffic demands that are directionally balanced and not too heavy. Figure 61 illustrates the time sequencing for three-phase control.(18)
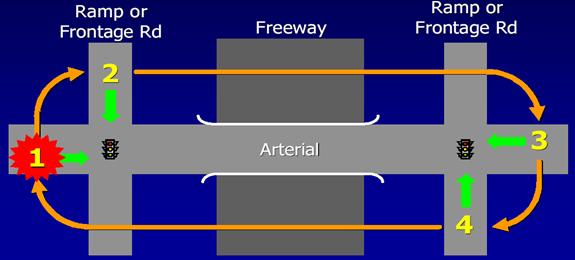
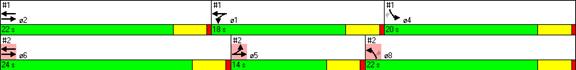
Figure 61. Screen Capture. Three-Phase Sequencing Signal Control for Diamond Interchange. Four-phase sequencing uses an overlap phase. The overlap period provides extra time for the interior area to clear and provide better progression out of the interchange. This helps to minimize interior delay and queuing even though a longer cycle length may be necessary. The four exterior movements are serviced sequentially. This control logic is suitable for narrow interchanges less than 122 m (400 ft) wide and for traffic demands that are high and/or directionally unbalanced. Figure 62 illustrates the time sequencing for the four-phase control.(18) According to the available crash prediction models for diamond interchanges, the type of signal-phase timing plan will have no impact on crash frequency. Thus, the crash prediction model will generate the same crash results for both three-phase and four-phase signal control.
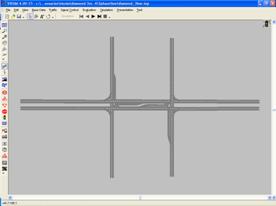
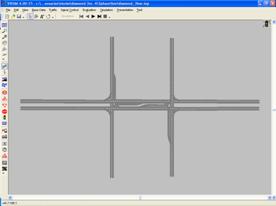
Figure 62. Screen Capture. Four-Phase Sequencing Signal Control for Diamond Interchange. Intersection Description The intersection used to test control logic for a diamond interchange is shown in figure 63 and figure 64. Because of the two closely spaced signalized intersections, the left-turn bay for each intersection is 45.75 m (150 ft) long, less than the normal 76.25-m (250-ft) length.
Figure 63. Screen Capture. Intersection for Diamond Interchange with Three-Phase Test.
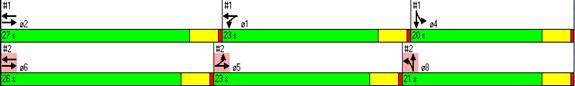
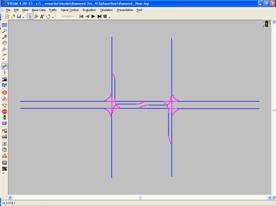
Figure 64. Screen Capture. Intersection for Diamond Interchange with Four-Phase Test. Table 35 shows the traffic volumes arriving to each approach of the intersection. Fully-actuated traffic control is applied in this test. Figure 65 through figure 70 illustrate the timing plans for each volume-level test scenario.
Note: L, TH, and R correspond to vehicles proceeding left, through, or right at the intersection.
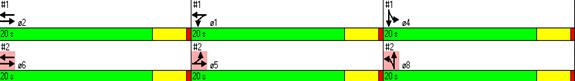
Figure 65. Screen Capture. Timing Plan for Three-Phase Diamond Interchange in Low Volumes.
Figure 66. Screen Capture. Timing Plan for Four-Phase Diamond Interchange in Low Volumes.
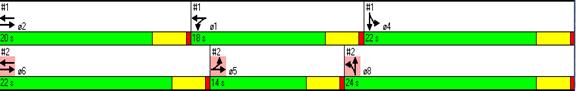
Figure 67. Screen Capture. Timing Plan for Three-Phase Diamond Interchange in Medium Volumes.
Figure 68. Screen Capture. Timing Plan Four-Phase Diamond Interchange in Medium Volumes.
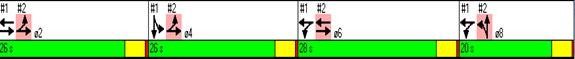
Figure 69. Screen Capture. Timing Plan for Three-Phase Diamond Interchange in High Volumes.
Figure 70. Screen Capture. Timing Plan for Four-Phase Diamond Interchange in High Volumes. Data Analysis and Comparison Results Ten replications were performed for each simulation scenario, and the resulting output trajectory data were analyzed by SSAM. The F-test and t-test were applied to compare surrogate measures of safety and the aggregations of those measures. Table 36 through table 39 list the values of all surrogate measures of safety and corresponding t-test results for different types of aggregations with the low-speed events and crash data excluded (TTC ? 0 and MaxS = 16.1 km/h (10 mi/h)).
Note: Shaded cells indicate statistically significant differences between the two alternatives. The tan and blue colors indicate extreme values to the right and left columns respectively. This table shows that the three-phase timing plan shows fewer total conflicts at low-traffic volumes but higher total conflicts at medium- and high-traffic volumes. Also, very few conflict events occur with TTC = 1.0 s.
Note: Shaded cells indicate statistically significant differences between the two alternatives. The tan and blue colors indicate extreme values to the right and left columns respectively. Consistent with the result for total conflicts, the three-phase timing plan shows fewer rear-end events for low-traffic volumes and more events for medium- and high-traffic volumes. Rear-end events make up approximately 50 percent of the total conflicts.
Note: Shaded cells indicate statistically significant differences between the two alternatives. Consistent with the result for total conflicts, the three-phase timing plan shows fewer lane-change events for low-traffic volumes (although this result is not statistically significant) and more events for medium- and high-traffic volumes.
Note: Shaded cells indicate statistically significant differences between the two alternatives. This table indicates that four-phase control reduces the severity of conflict events. Correlations with Predicted Crash Frequency The predicted crash rates for all scenarios in this test are listed in table 40 with the corresponding average number of conflict events of each type. The Spearman rank correlation coefficients are calculated for each test and listed in the right-most column. Note that because there is no term in the crash prediction model to discriminate between three-phase and four-phase control, the predicted number of crashes for each case is the same. The results from SSAM would indicate that a three-phase design results in more conflict events than a four-phase design and is thus a less safe intersection.
Note: Rows labeled "M" provide mean values and rows labeled "R" provide the ranking of each alternative. The Rs column provides Spearman rank correlation coefficients indicating agreement with theoretical crash estimates. Findings and Conclusions Based on the observation on the safety surrogate data obtained from the test, the following conclusions can be drawn:
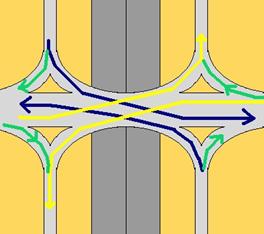
In general, when traffic volume is low, either logic- for diamond-interchange control has similar results for surrogate measures of safety. When traffic volume increases, three-phase control logic generates more conflicts than four-phase control logic and thus could be considered a less safe control strategy. In addition, the average values of the surrogate measures of safety for three-phase control are all consistently worse, reinforcing the determination that three-phase control is a less safe intersection design than four-phase control. Case 6: Single-Point Urban Interchange Versus Diamond interchange (VISSIM)The Single-Point Urban Interchange (SPUI) is a relatively new variant of the diamond (shown in figure 71). Where a diamond has two ramp intersections at the surface street (one on each side of the freeway), the ramps of a SPUI are placed so close together to make them effectively part of the same intersection. This allows one traffic signal to control all crossing movements and enables concurrent opposing left turns, which increases the capacity of the interchange above that of the three- and four-phase diamond control schemes.
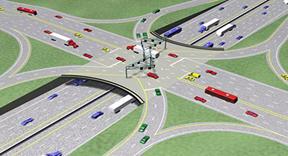
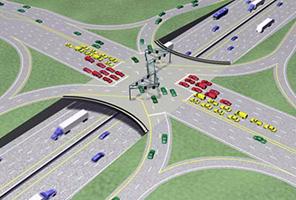
Figure 71. Screen Capture. Single-Point Urban Interchange. The traffic signal control for the SPUI has three phases, as shown in figure 72, figure 73, and figure 74.(19) PHASE 1: Cars on the surface street (shown in red) are allowed to drive straight through only (no turns). The yellow cars waiting to turn onto the freeway must wait. PHASE 2: All cars on the surface street proceeding straight through or turning left onto freeway are stopped. Cars exiting the freeway to enter the street (green) are allowed to turn left. PHASE 3: Left-turning vehicles from the freeway (green) and cars proceeding straight through on the surface street (red) are stopped. Cars on the surface street are allowed to turn onto the on-ramp for the freeway (yellow).
Figure 72. Screen Capture. Phase 1.
Figure 73. Screen Capture. Phase 2.
Figure 74. Screen Capture. Phase 3. The disadvantages of a SPUI include the following:
The goal of the comparison is to identify any differences in the safety performance use of the SPUI intersection with traditional diamond-signal control. Comparison of conventional crash prediction models cited earlier (each applied at the same volume) suggests that the SPUI averages slightly more crashes than a conventional diamond interchange at low and moderate volumes, and the trend is reversed at higher volumes (where SPUIs have fewer predicted crashes than diamond-interchange geometry). However, a recent comparison of SPUI and tight diamond-interchange crashes suggests no significant differences in total crashes, though SPUIs incurred fewer injuries/fatalities than comparable diamond interchanges.(20) Intersection Description The intersections used to test the diamond interchange versus SPUI are shown in figure 75, figure 76, and figure 77, respectively. All left-turn bays in the networks are 76.25 m (150 ft) long.
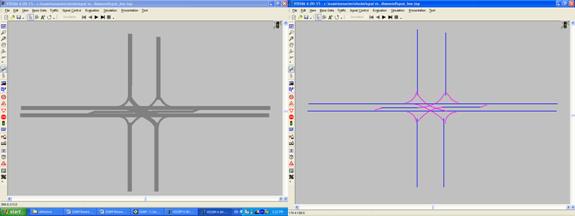
Figure 75. Screen Capture. Diamond Interchange in VISSIM.
Figure 76. Screen Capture. Link-Connector View of Diamond Interchange Model in VISSIM.
Figure 77. Screen Capture. SPUI in VISSIM. Table 41 lists the traffic volumes applied for each approach of the intersection. Fully-actuated traffic control is applied in this test. Figure 78 though figure 83 indicate the timing plans for each testing scenario.
Note: L, TH, and R correspond to vehicles proceeding left, through, or right at the intersection.
Figure 78. Illustration. Timing Plan for Diamond Interchange in Low Volumes.
Figure 79. Illustration. Timing Plan for SPUI in Low Volumes.
Figure 80. Illustration. Timing Plan for Diamond Interchange in Medium Volumes.
Figure 81. Illustration. Timing Plan SPUI in Medium Volumes.
Figure 82. Illustration. Timing Plan for Diamond Interchange in High Volumes.
Figure 83. Illustration. Timing Plan for SPUI in High Volumes. Data Analysis and Comparison Results Ten replications were performed for each simulation scenario, and the resulting output trajectory data were analyzed by SSAM. F-test and t-tests were applied to identify the statistical significance of each surrogate measure of safety. Table 42 through table 45 list the values of all surrogate measures of safety and corresponding t-test results for different types of aggregations with the low-speed events and crash data excluded (TTC ? 0 and MaxS = 16.1 km/h (10 mi/h)).
Note: Shaded cells indicate statistically significant differences between the two alternatives. The tan and blue colors indicate extreme values to the right and left columns respectively. This table indicates, when considering a threshold value of 1.5 s for TTC, that the SPUI geometry reduces the number of conflict events by 20 percent to 60 percent.
Note: Shaded cells indicate statistically significant differences between the two alternatives. This table indicates, when considering a threshold value of 1.5 s for TTC, that the SPUI geometry reduces the number of rear-end conflict events by 30 percent to 75 percent.
Note: Shaded cells indicate statistically significant differences between the two alternatives. The tan and blue colors indicate extreme values to the right and left columns respectively. The results shown in this table for lane-change conflicts are inconclusive. For high volumes, there is a definite trend for the SPUI to increase the number of lane-change conflicts.
Note: Shaded cells indicate statistically significant differences between the two alternatives. The tan and blue colors indicate extreme values to the right and left columns respectively. This table shows that the average values of surrogate measures of safety (in terms of average severity per conflict) are consistently worse for the SPUI design than the three-phase diamond interchange. Correlations with Predicted Crash Frequency The predicted crash rates for all scenarios in this test are in table 46 with the corresponding average number of conflict events of each type. Rank orders for each category of data are also listed in the table. The Spearman rank correlation coefficients are calculated for each test and listed in the right-most column of the table.
Note: Averages that are not significantly different are assigned the same rank. Rows labeled "M" provide mean values and rows labeled "R" provide the ranking of each alternative. The Rs column provides Spearman rank correlation coefficients indicating agreement with theoretical crash estimates. Findings and Conclusions Based on the observation on the safety surrogate data obtained from the test, the following conclusions can be drawn:
In general, these results indicate that a SPUI-intersection design will reduce the total number of conflicts that occur (primarily the rear-end conflicts), but when conflicts do occur, they will be more severe on average. Case 7: Cross Four-Leg Intersection Versus Offset T-Intersection (VISSIM)This comparison is between an unsignalized four-leg intersection and an offset T-intersection. According to Vogt's theory in the development of the crash prediction models for two-lane roads, T-intersections with an obtuse angle from the minor road were found to have fewer crashes than four-legged rural intersections. (21) From the results of recent studies by Bared, on an aggregate level, the expected benefit of converting a cross intersection to an offset T-intersection is a reduction in total crashes of 20 percent to 30 percent for rural 2 x 2-lane, two-way, stop-controlled intersections.(14) The reduction in fatal/injury crashes is expected to be approximately 40 percent for 2 x 2-lane intersections. One reason for this, as shown in figure 84 , is the noticeable reduction in conflict points (from 32 to 22) by converting a cross intersection to an offset T-intersection.
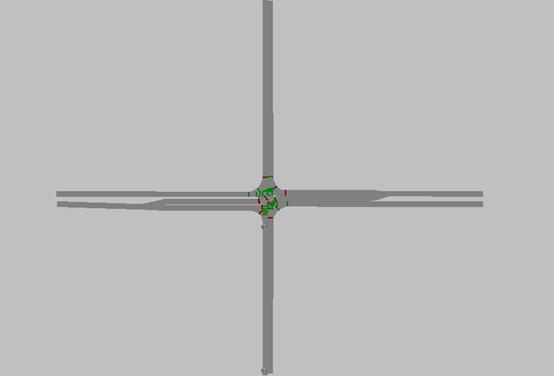
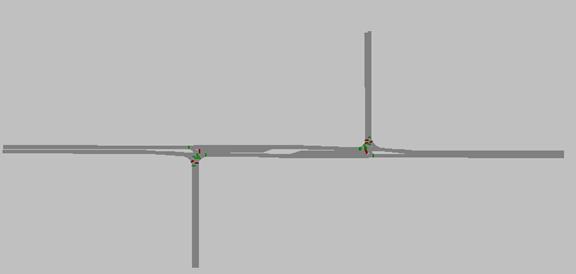
Figure 84. Illustration. Potential Conflict Points for 2 x 2-Lane Intersections.(14) Intersection Description The intersections used for this test are shown in figure 85 and figure 86, respectively. All left-turn bays are 76.25 m (250 ft) long.
Figure 85. Screen Capture. Conventional Nonsignalized Intersection.
Figure 86. Screen Capture. Offset T-Intersection. Table 47 shows traffic volumes applied for each approach of the intersection. No traffic control is used in this test.
Note: L, TH, and R correspond to vehicles proceeding left, through, or right at the intersection. Data Analysis and Comparison Results Ten replications were performed for each simulation scenario, and the resulting output trajectory data were analyzed by SSAM. The F-test and t-test were applied to compare the average number of conflict events of each event type and surrogate measures of safety between the two intersection designs. Table 48 through table 51 list the values of all surrogate measures of safety and corresponding t-test results for different types of aggregations with the low-speed events and crash data excluded (TTC ? 0 and MaxS = 16.1 km/h (10 mi/h)).
Note: CON indicates conventional intersection cross and OFFT indicates an offset T-intersection. Shaded cells indicate statistically significant differences between the two alternatives. This table indicates that the total conflicts are increased with the offset T, although as shown in the following tables, those conflicts are comprised of lane changes and rear ends only.
Note: Shaded cells indicate statistically significant differences between the two alternatives.
Note: Shaded cells indicate statistically significant differences between the two alternatives.
Note: Shaded cells indicate statistically significant differences between the two alternatives. This table indicates that for the statistically significant measures, the offset T design results in a reduction in both the crash probability and the severity for all conflict types. Correlations with Predicted Crash Frequency The predicted crash rates for all scenarios in this test are in table 52 with the corresponding surrogate measures of safety. Rank orders for each category of data are also listed in the table. The Spearman rank correlation coefficients are calculated for each test.
Note: Averages that are not significantly different are assigned the same rank. Rows labeled "M" provide mean values and rows labeled "R" provide the ranking of each alternative. The Rs column provides Spearman rank correlation coefficients indicating agreement with theoretical crash estimates. Since the offset T increases the number of conflicts that occur in the simulation model, the correlation with the reduction in crashes that is expected with an offset T is very poor. Findings and Conclusions Based on the above observations, the following conclusions can be drawn:
In general, the conventional intersection shows fewer total and lane-change conflicts than the offset T-intersection. The conflicts that occur at the offset T, however, have lower average values of surrogate measures of severity and probability of collisions. |
|||||||||||||||||||||||||||||||||||||||||||||||||||||||||||||||||||||||||||||||||||||||||||||||||||||||||||||||||||||||||||||||||||||||||||||||||||||||||||||||||||||||||||||||||||||||||||||||||||||||||||||||||||||||||||||||||||||||||||||||||||||||||||||||||||||||||||||||||||||||||||||||||||||||||||||||||||||||||||||||||||||||||||||||||||||||||||||||||||||||||||||||||||||||||||||||||||||||||||||||||||||||||||||||||||||||||||||||||||||||||||||||||||||||||||||||||||||||||||||||||||||||||||||||||||||||||||||||||||||||||||||||||||||||||||||||||||||||||||||||||||||||||||||||||||||||||||||||||||||||||||||||||||||||||||||||||||||||||||||||||||||||||||||||||||||||||||||||||||||||||||||||||||||||||||||||||||||||||||||||||||||||||||||||||||||||||||||||||||||||||||||||||||||||||||||||||||||||||||||||||||||||||||||||||||||||||||||||||||||||||||||||||||||||||||||||||||||||||||||||||||||||||||||||||||||||||||||||||||||||||||||||||||||||||||||||||||||||||||||||||||||||||||||||||||||||||||||||||||||||