Surrogate Safety Assessment Model and Validation: Final Report
PDF files can be viewed with the Acrobat® Reader®
Chapter 5. Sensitivity Analysis
PURPOSE
The sensitivity analysis serves to supplement the field validation effort. The main purpose of the sensitivity analysis is to capture the differences between using one simulation model versus another and provide guidance to the safety analysis community.
METHODOLOGY
SSAM was tested across the VISSIM, AIMSUN, PARAMICS, and TEXAS microsimulation platforms by implementing five U.S. intersections from the Hamilton Associates' database in all four platforms. The conflict summary results from each simulation for the five U.S. intersections was tabulated and analyzed with and without accounting for crashes (e.g., crashes resulting from lane changing). The performance of SSAM was compared on the various conflict measures output by SSAM (conflict rate, TTC, PET, etc.). Various threshold values were used (e.g., TTC < 1.5 s, TTC < 1.0 s, etc.) to evaluate the differences in output from each microsimulation.
The same five intersections of representative types were implemented in all four of the microsimulation platforms (VISSIM, AIMSUN, PARAMICS, and TEXAS) used in the study. This involved the following steps:
- Implement the same field intersection designs across the four microsimulation platforms.
- Run the simulation with multiple replications and collect trajectory data and measures of effectiveness (MOEs).
- Run the SSAM tool to derive surrogate measures of safety.
- Compare the results from different microsimulation platform for the same simulated case.
Implement Intersection Designs in all four of Microsimulation Platforms
SSAM was tested across VISSIM, AIMSUN, PARAMICS, and TEXAS. The sensitivity analysis was performed by implementing five U.S. intersections from the Hamilton Associates' database in all these four platforms.
For each simulated case, the four simulation models are modeled to keep the geometry data, traffic volume, signal timing, and some important network parameters the same. Other parameters such as driving-behavior parameters remain at default values in each simulation model to avoid unrealistic maneuvers. As indicated in the theoretical analysis report, in most scenarios, evaluated crashes cannot be completely eliminated from the simulation without modifying driver-behavior parameters or design geometry beyond reasonable limits. The number of crashes and low-speed events constituted a large percentage of the total conflict events that occurred in most of the scenarios tested. Moderate adjustment of simulation parameters was made during the sensitivity analysis for each microsimulation platform to reduce such crashes. Multiple replications were implemented for each simulated case in each simulation model to minimize random factors during comparison effort.
Obtain Measures for Each Case
Safety Measures for Each Case
Safety measures recorded from SSAM were tabulated for each simulated case, including total conflicts, conflict number for each conflict type, TTC, PET, etc. Each type of measure was compared across VISSIM, AIMSUN, PARAMICS, and TEXAS.
Conflicts Layout Display for Each Case
Another important task within sensitivity analysis was to compare the conflicts layout across the four simulation platforms for each simulated case.
MOEs for Each Case
Network MOEs for each simulated case were recorded and compared across the four simulation platforms (e.g., travel time and average delay).
SENSITIVITY ANALYSIS RESULTS
Five U.S. intersections from the Hamilton Associates' database were executed in the sensitivity analysis. In terms of traffic volumes and turning counts, each intersection had AM peak-hour data and PM peak-hour data. Two out of the five intersections also had mid-day data.
- Briarcliff Rd & North Druid Hills Rd, Dekalb County, Atlanta, GA.
- Roswell Road & Abernathy Road , Fulton County, Atlanta, GA.
- Lafayette Ave & Fulton Street, Grand Rapids, MI.
- Ryan Ave & Davison Ave, Detroit, MI.
- Howe Ave & Fair Oaks Boulevard, Sacramento, CA.
Intersection Description
Intersection 1: Briarcliff Rd & North Druid Hills Rd, Dekalb County, Atlanta, GA
This was a skewed intersection with two approaches having right-turn bays. All four approaches had independent left-turn bays, ranging from 32.9 m (108 ft) to 111.3 m (365 ft). The intersection was under semiactuated signal control and had three timing plans according to three peak-hour periods-AM peak, mid peak, and PM peak. Traffic volumes were around 4,300-4,800 vehicles per hour. The speed limit specified for all approaches was 56.35 km/ h (35 mi/h), and the 3-year annual collision frequency for this intersection was about 27.7. Figure 134 shows a GoogleTM map view of this intersection. Figure 135 through 138 show the intersection layout modeled within each simulation platform.
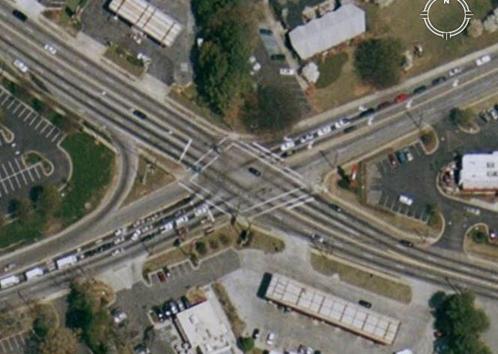
Figure 134. Photo. Google TM Map View of Briarcliff Rd & North Druid Hills Rd.
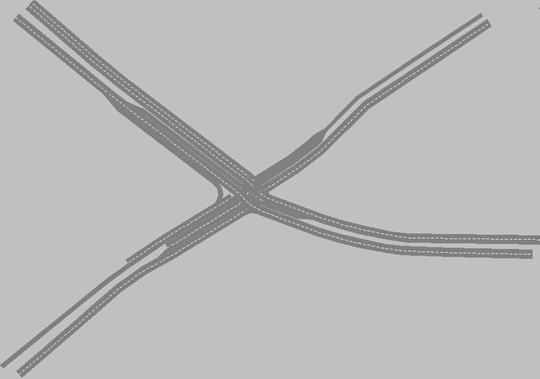
Figure 135. Screen Capture. VISSIM Model of Briarcliff Rd & North Druid Hills Rd.
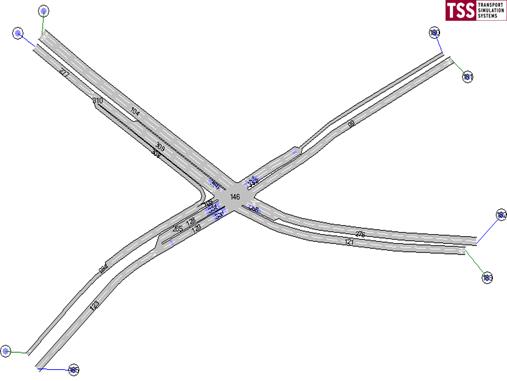
Figure 136. Screen Capture. AIMSUN Model of Briarcliff Rd & North Druid Hills Rd.
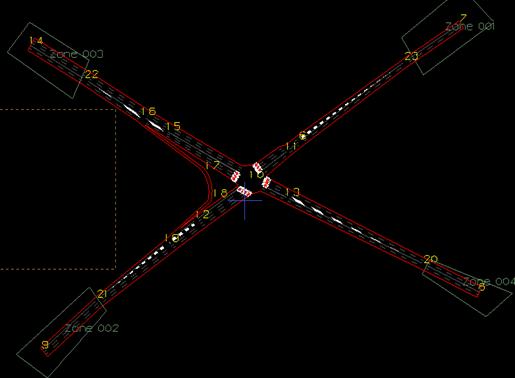
Figure 137. Screen Capture. PARAMICS Model of Briarcliff Rd & North Druid Hills Rd.
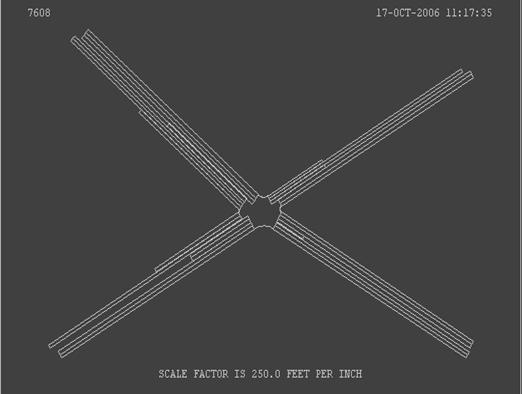
Figure 138. Screen Capture. TEXAS Model of Briarcliff Rd & North Druid Hills Rd.
Intersection 2: Roswell Road & Abernathy Road, Fulton County, Atlanta, GA
This was a skewed intersection with all approaches having right-turn bays and left-turn bays. The intersection was under semiactuated signal control and had three timing plans according to three peak-hour periodsAM peak, mid peak, and PM peak. Traffic volumes were around 5,2005,700 vehicles per hour. The speed limit specified for all approaches is 56.35 km/h (35 mi/h), and the 3-year annual collision frequency for this intersection is about 92. Figure 139 shows a GoogleTM map view of this intersection. Figure 140 through figure 143 show the intersection layout modeled within each simulation platform.
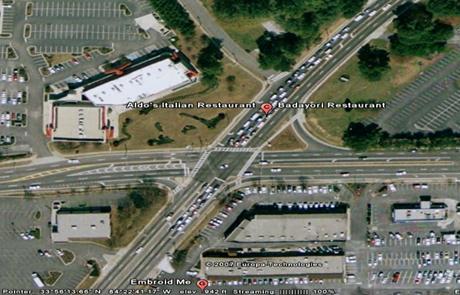
Figure 139. Photo. Google TM Map View of Roswell Road & Abernathy Road.
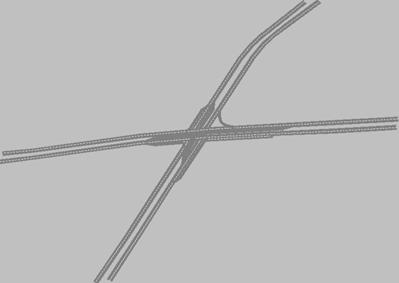
Figure 140. Screen Capture. VISSIM Model of Roswell Road & Abernathy Road.
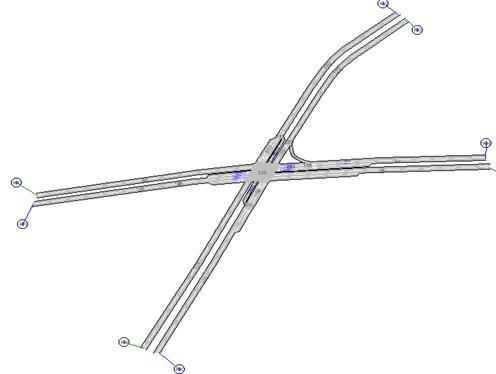
Figure 141. Screen Capture. AIMSUN Model of Roswell Road & Abernathy Road.
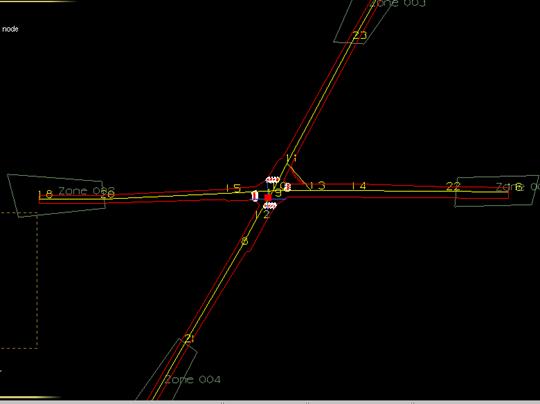
Figure 142. Screen Capture. PARAMICS Model of Roswell Road & Abernathy Road.
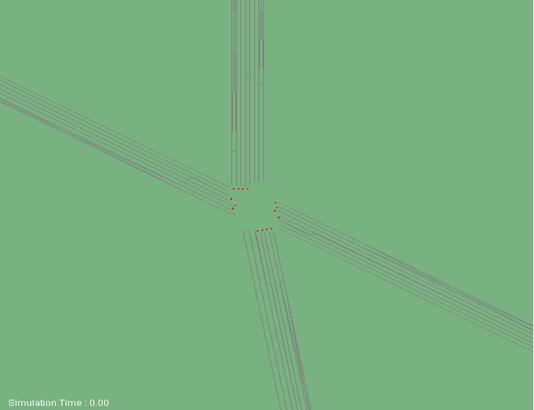
Figure 143. Screen Capture. TEXAS Model of Roswell Road & Abernathy Road.
Intersection 3: Lafayette Ave & Fulton Street, Grand Rapids, MI
This intersection was under semiactuated signal control and had two timing plans according to two peak-hour periodsAM peak and PM peak. Only S-N bound had independent left-turn bays, and there were no right-turn bays for any approach. Traffic volumes were around 1,9002,400 vehicles per hour. The speed limit specified for all approaches was 48.3 km/h (30 mi/h), and the 4-year annual collision frequency for this intersection is about 33. Figure 144 shows a GoogleTM map view of this intersection. Figure 145 through figure 148 show the intersection layout modeled within each simulation platform.
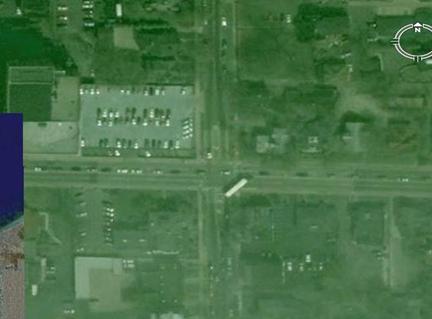
Figure 144. Photo. Google TM Map View of Lafayette Ave & Fulton Street.
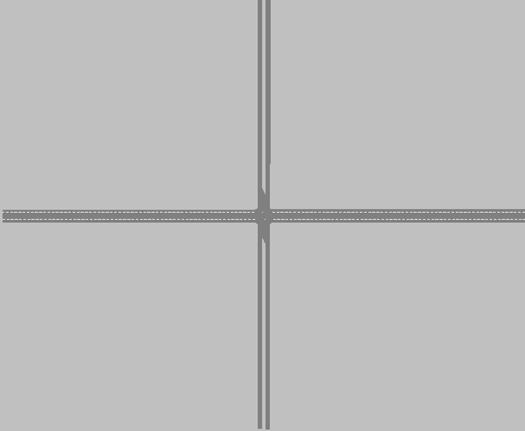
Figure 145. Screen Capture. VISSIM Model of Lafayette Ave & Fulton Street.
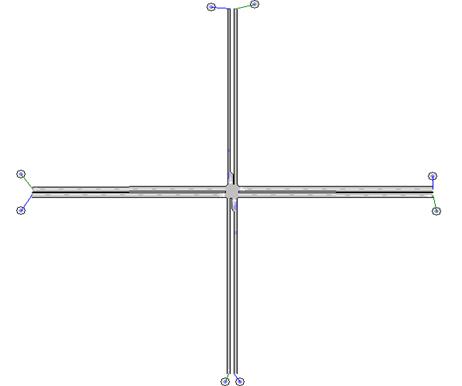
Figure 146. Screen Capture. AIMSUN Model of Lafayette Ave & Fulton Street.
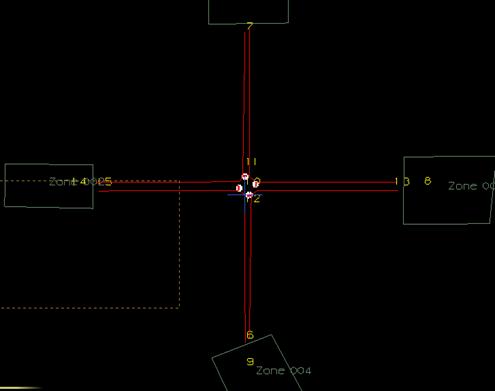
Figure 147. Screen Capture. PARAMICS Model of Lafayette Ave & Fulton Street.
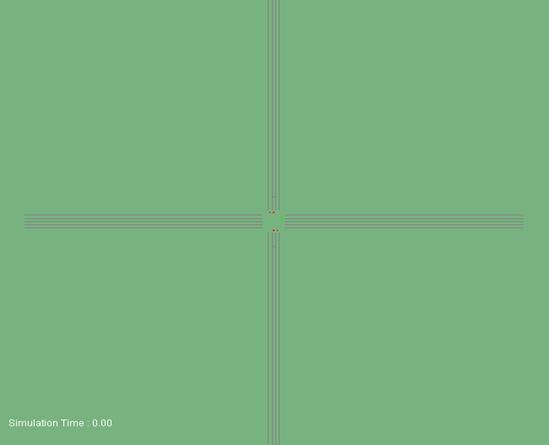
Figure 148. Screen Capture. TEXAS Model of Lafayette Ave & Fulton Street.
Intersection 4: Ryan Ave & Davison Ave, Detroit, MI
This intersection was under fixed-time signal control and had two timing plans according to two peak-hour periodsAM peak and PM peak. Only E-W bound had independent left-turn bays, and there were no right-turn bays for any approach. Traffic volumes were around 2,6003,000 vehicles per hour. The speed limit specified for N-S approaches was 40.25 km/h (25 mi/h) while the E-W approaches had a 48.36-km/h (30-mi/hr) speed limit. The 2-year annual collision frequency for this intersection was about 20.5. Figure 149 shows a GoogleTM map view of this intersection. Figure 150 through figure 153 show the intersection layout modeled within each simulation platform.
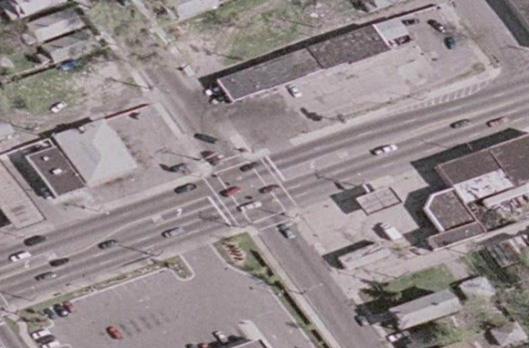
Figure 149. Photo. Google TM Map View of Ryan Ave & Davison Ave.
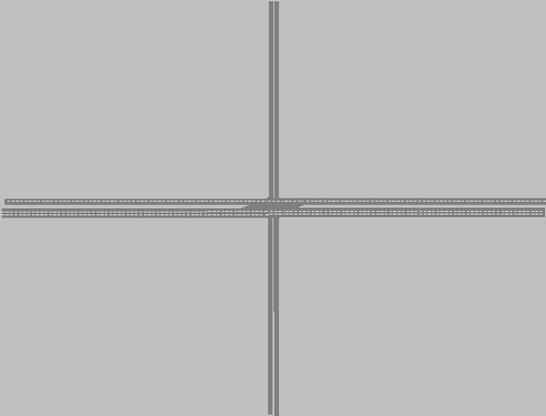
Figure 150. Screen Capture. VISSIM Model of Ryan Ave & Davison Ave.
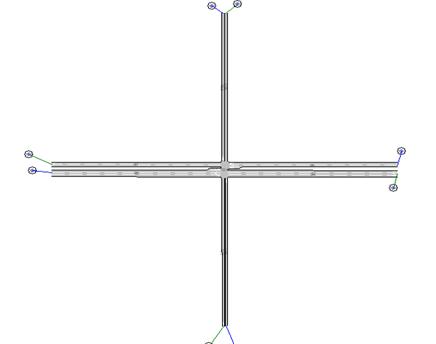
Figure 151. Screen Capture. AIMSUN Model of Ryan Ave & Davison Ave.
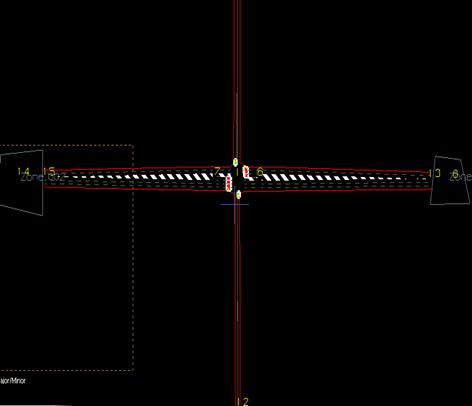
Figure 152. Screen Capture. PARAMICS Model of Ryan Ave & Davison Ave.
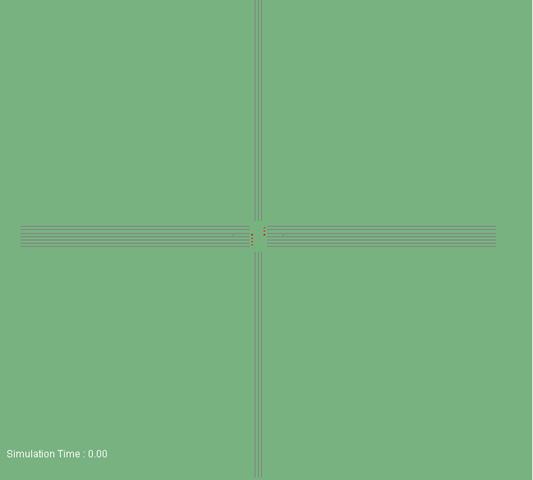
Figure 153. Screen Capture. TEXAS Model of Ryan Ave & Davison Ave.
Intersection 5: Howe Ave & Fair Oaks Boulevard, Sacramento, CA
This was a skewed intersection with independent left-turn bays and right-turn bays for all approaches. The intersection was under semiactuated signal control and had two timing plans according to two peak-hour periodsAM peak and PM peak. Traffic volumes were around 6,5008,800 vehicles per hour. The speed limit specified for N-S approaches was 64.4 km/h (40 mi/h) while the E-W approaches had a 72.45-km/h (45-mi/h) speed limit. The 3-year annual collision frequency for this intersection was about 28.3. Figure 154 shows a GoogleTM map view of this intersection. Figure 155 through figure 158 show the intersection layout modeled within each simulation platform.
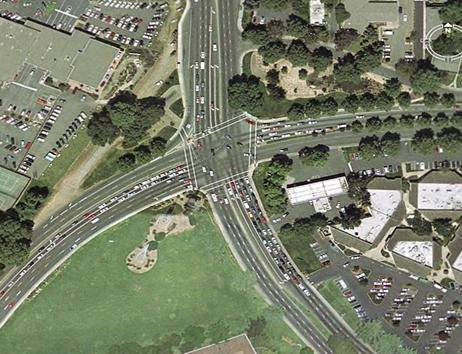
Figure 154. Photo. Google TM Map View of Howe Ave & Fair Oaks Boulevard.
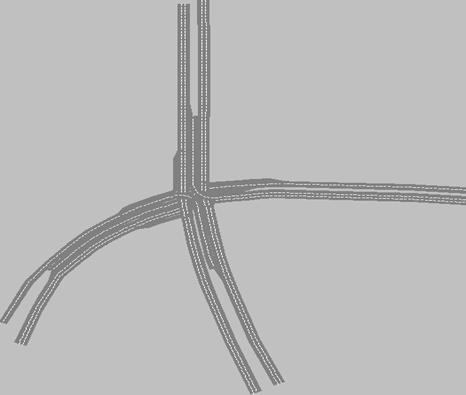
Figure 155. Screen Capture. VISSIM Model of Howe Ave & Fair Oaks Boulevard.
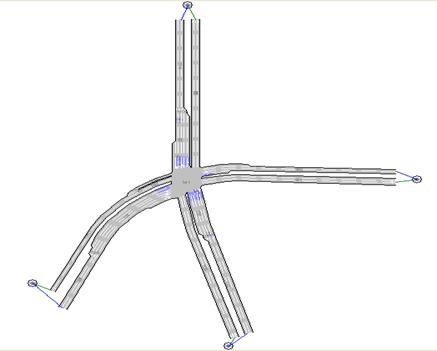
Figure 156. Screen Capture. AIMSUN Model of Howe Ave & Fair Oaks Boulevard.
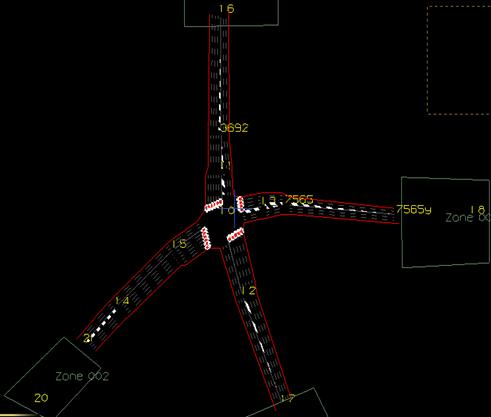
Figure 157. Screen Capture. PARAMICS Model of Howe Ave & Fair Oaks Boulevard.
Figure 158. Screen Capture. TEXAS Model of Howe Ave & Fair Oaks Boulevard.
Data Analysis and Comparison Results
Number of Conflicts (Rate)
The number of conflicts was extracted from SSAM for each case. The conflicts rate is expressed as a ratio between number of conflicts and traffic volume. With modeling limitations from each simulation platform, total conflicts were filtered out by SSAM to obtain more accurate data, resulting in three set of conflicts: total conflicts, denoted as C-N1; conflicts without abnormal deceleration (max braking rate less than -9.15 m/sec2 (-30 ft/sec2)), denoted as C-N2; and non-crash (TTC > 0) and non-low-speed (max speed = 16.1 km/h (10 mi/h)) conflicts without abnormal deceleration, denoted as C-N3. Conflicts within each TTC category were also tabulated and investigated.
Note that a maximum deceleration rate of 9.15 m/sec2 (30 ft/sec2) is considered very extreme. To put this in perspective, consider the results of the recent testing of several fleet vehicles by the Michigan State Police where it was found that among all vehicles tested (including motorcycles), the maximum deceleration rate obtained in was just under 9.15 m/sec2 (30 ft/sec2), with emergency (panic) braking conditions using vehicles equipped with anti-lock braking systems (ABS).(33)
Intersection 1: Briarcliff Rd & North Druid Hills Rd, Dekalb County, Atlanta, GA:
The number of conflicts/conflict rates under AM, mid, and PM peak-hour conditions was tabulated and is shown in table 93 through table 104. Column charts were created to compare the conflicts number generated from the four simulation platforms, as seen in figure 159 through figure 182.
As shown in the following tables and figures, for all simulation models, most of the conflicts were rear-end conflicts, and crossing conflicts were the least conflicts among all conflicts types. Crossing conflicts had a smaller TTC value while rear-end conflicts had a larger TTC value. The differences among the four simulation models were the following:
- VISSIM had the least conflict number for all categories. TEXAS had the most conflict number for all categories. TEXAS had more than 10 times the conflicts of VISSIM.
- The ascending ranking order in most cases was VISSIM, AIMSUN, PARAMICS, TEXAS. However, the order for C-N3 was VISSIM, PARAMICS, AIMSUN, TEXAS, implying AIMSUN had a higher percentage of low-speed conflicts or crashes than PARAMICS.
- VISSIM and TEXAS had no abnormal deceleration maneuvers while AIMSUN and PARAMICS had 20 to 30 percent conflicts with abnormal deceleration. Most of the abnormal deceleration maneuvers were from rear-end conflicts. More than half of the conflicts with abnormal deceleration had TTC = 1.0.
- Less than 40 percent of the conflicts from VISSIM and AIMSUN were low-speed or crash events; PARAMICS and TEXAS had a higher percentage of low-speed or crash events (60 to 75 percent). Most of the low-speed conflicts were rear-end conflicts.
- More than half of the conflicts in all simulation platforms were less severe conflicts (conflicts with TTC = 0.5), while in PARAMICS, the percentage of severe conflicts was the highest among all of the simulation platforms (based on comparison of C-N2).
Table 93. Conflicts Number Under AM Peak-Hour Condition for Intersection 1.
|
4,365 v/hr |
TTC = 1.5 |
TTC = 1.0 |
TTC = 0.5 |
|
C-N1* |
C-N2 |
C-N3 |
C-N1 |
C-N2 |
C-N3 |
C-N1 |
C-N2 |
C-N3 |
|
ALL |
|
VISSIM |
72.7/1.67** |
72.7/1.67 |
47.6/1.09 |
19.1/0.44 |
19.1/0.44 |
5.7/0.13 |
16.2/0.37 |
16.2/0.37 |
3/0.07 |
|
AIMSUN |
436.6/10 |
300.4/6.88 |
182.8/4.19 |
236.3/5.41 |
181.7/4.16 |
98.8/2.26 |
90.4/2.07 |
63.8/1.46 |
9.2/0.21 |
|
PARAMICS |
578.4/13.25 |
412.4/9.45 |
114.1/2.61 |
372.2/8.53 |
300.9/6.89 |
37.4/0.86 |
308.3/7.06 |
268.6/6.15 |
15.1/0.35 |
|
TEXAS |
2,138.7/49 |
2,138.5/48.99 |
812.5/18.61 |
857.8/19.6 |
857.6/19.65 |
372.1/8.53 |
413.6/9.48 |
413.5/9.47 |
67.7/1.55 |
|
Crossing Conflicts |
|
VISSIM |
0.9/0.02 |
0.9/0.02 |
0.4/0.01 |
0.5/0.01 |
0.5/0.01 |
0//0 |
0.5/0.01 |
0.5/0.01 |
0/0 |
|
AIMSUN |
5.5/0.13 |
3.9/0.09 |
3.6/0.08 |
3.5/0.08 |
3/0.07 |
2.7/0.06 |
0.8/0.02 |
0.6/0.01 |
0.3/0 |
|
PARAMICS |
47.3/1.08 |
43.9/1.01 |
2.5/0.06 |
46/1.05 |
42.8/0.98 |
1.4/0.03 |
44.8/1.03 |
42/0.96 |
0.6/0.01 |
|
TEXAS |
123.7/2.83 |
123.7/2.83 |
10/0.23 |
118.5/2.72 |
118.5/2.72 |
5.1/0.12 |
117.2/2.69 |
117.2/2.69 |
3.9/0.09 |
|
Rear-End Conflicts |
|
VISSIM |
57.5/1.32 |
57.5/1.32 |
40.4/0.93 |
7.8/0.18 |
7.8/0.18 |
1.4/0.03 |
6.5/0.15 |
6.5/0.15 |
0.2/0 |
|
AIMSUN |
364.1/8.34 |
256.7/5.88 |
150.6/3.45 |
206.5/4.73 |
157.2/3.6 |
82.2/1.88 |
83.4/1.91 |
58.4/1.34 |
8.1/0.19 |
|
PARAMICS |
488.5/11.19 |
330.5/7.57 |
98.2/2.25 |
295/6.76 |
229.6/5.26 |
30.4/0.7 |
239.3/5.48 |
203.5/4.66 |
13.2/0.3 |
|
TEXAS |
1921/44.01 |
1920.9/44.01 |
774.9/17.75 |
665.9/15.26 |
665.8/15.25 |
352.8/8.08 |
232.7/5.33 |
232.7/5.33 |
56.8/1.3 |
|
Lane-Changing Conflicts |
|
VISSIM |
14.3/0.33 |
14.3/0.33 |
6.8/0.16 |
10.8/0.25 |
10.8/0.25 |
4.3/0.1 |
9.2/0.21 |
9.2/0.21 |
2.8/0.06 |
|
AIMSUN |
66/1.51 |
39.8/0.91 |
28.6/0.66 |
26.3/0.6 |
21.5/0.5 |
13.9/0.32 |
6.2/0.14 |
4.8/0.11 |
0.8/0.02 |
|
PARAMICS |
42.6/0.98 |
38/0.87 |
13.4/0.31 |
31.2/0.71 |
28.5/0.65 |
5.6/0.13 |
24.2/0.55 |
23.1/0.53 |
1.3/0.03 |
|
TEXAS |
94/2.15 |
93.9/2.15 |
27.6/0.63 |
73.4/1.68 |
73.3/1.68 |
14.2/0.33 |
63.7/1.46 |
63.6/1.46 |
7/0.16 |
* C-N1: total conflict analysis by SSAM.
C-N2: Conflicts with MaxD = -9.15 m/sec2 (-30 ft/sec2).
C-N3: Conflicts with MaxD greater than and equal to -9.15 m/sec2 (-30 ft/sec2) TTC > 0 and MaxS = 16.1 km/h (10 mi/h).
** 72.7 is the conflict number, while 1.67 is the conflict rate, which is the outcome of 72.7 divided by the traffic volume.
Figure 159. Graph. Conflicts Number C-N2 Comparison for Intersection 1 at AM Peak.

Figure 160. Graph. Conflicts Number C-N3 Comparison for Intersection 1 at AM Peak.
Table 94. Conflicts Number Under Mid Peak-Hour Condition for Intersection 1.
|
4,640 v/hr |
TTC = 1.5 |
TTC = 1.0 |
TTC = 0.5 |
|
C-N1* |
C-N2 |
C-N3 |
C-N1 |
C-N2 |
C-N3 |
C-N1 |
C-N2 |
C-N3 |
|
ALL |
|
VISSIM |
74.7/1.61 |
74.7/1.61 |
59.3/1.28 |
14.9/0.32 |
14.9/0.32 |
6.2/0.13 |
11.9/0.26 |
11.9/0.26 |
3.5/0.08 |
|
AIMSUN |
310/6.68 |
231.6/4.99 |
160.1/3.45 |
190.7/4.11 |
146.7/3.16 |
88.7/1.91 |
190.7/4.11 |
64.3/1.39 |
16.5/0.36 |
|
PARAMICS |
340.1/7.33 |
208.6/4.5 |
81.4/1.75 |
145.45/3.14 |
109.6/2.36 |
21/0.45 |
111/2.39 |
96.7/2.08 |
13.1/0.28 |
|
TEXAS |
1,264.8/27.26 |
1,264.8/27.26 |
451.7/9.73 |
679.4/14.64 |
679.4/14.64 |
233.7/5.04 |
436.8/9.41 |
436.8/9.41 |
69.3/1.49 |
|
Crossing Conflicts |
|
VISSIM |
2.1/0.05 |
2.1/0.05 |
1/0.02 |
1.2/0.03 |
1.2/0.03 |
0.1/0 |
1.2/0.03 |
1.2/0.03 |
0.1/0 |
|
AIMSUN |
3.3/0.07 |
2.2/0.05 |
1.8/0.04 |
2.3/0.05 |
1.7/0.04 |
1.3/0.03 |
2.3/0.05 |
1/0.02 |
0.6/0.01 |
|
PARAMICS |
31.7/0.68 |
27.9/0.6 |
0.8/0.02 |
35.7/0.77 |
31.8/0.69 |
0.7/0.02 |
35.6/0.77 |
31.7/0.68 |
0.6/0.01 |
|
TEXAS |
109.1/2.35 |
109.1/2.35 |
7.5/0.16 |
106.3/2.29 |
106.3/2.29 |
4.8/0.10 |
104.8/2.26 |
104.8/2.26 |
3.4/0.07 |
|
Rear-End Conflicts |
|
VISSIM |
59.1/1.27 |
59.1/1.27 |
48.8/1.05 |
5.1/0.11 |
5.1/0.11 |
0.9/0.02 |
4.4/0.09 |
4.4/0.09 |
0.3/0.01 |
|
AIMSUN |
252/5.43 |
190.2/4.1 |
126.2/2.72 |
160.3/3.45 |
122.9/2.65 |
70.7/1.52 |
160.3/3.45 |
58.3/1.26 |
14.3/0.31 |
|
PARAMICS |
284.3/6.13 |
159.5/3.44 |
68.6/1.48 |
95.1/2.05 |
64.4/1.39 |
6.3/0.14 |
63/1.36 |
52.9/1.14 |
7/0.15 |
|
TEXAS |
1,075.8/23.19 |
1,075.8/23.19 |
418.3/9.02 |
511.7/11.03 |
511.7/11.03 |
217.7/4.69 |
277.9/5.99 |
277.9/5.99 |
59.1/1.27 |
|
Lane-Changing Conflicts |
|
VISSIM |
13.5/0.29 |
13.5/0.29 |
9.5/0.2 |
8.6/0.19 |
8.60.19 |
5.2/0.11 |
6.3/0.14 |
6.3/0.14 |
3.1/0.07 |
|
AIMSUN |
54.7/1.18 |
39.2/0.84 |
32.1/0.69 |
28.1/0.61 |
22.1/0.48 |
16.7/0.36 |
28.1/0.61 |
5/0.11 |
1.6/0.03 |
|
PARAMICS |
24.1/0.52 |
21.2/0.46 |
12/0.26 |
14.7/0.32 |
13.4/0.29 |
6.3/0.14 |
12.4/0.27 |
12.1/0.26 |
5.5/0.12 |
|
TEXAS |
79.9/1.72 |
79.9/1.72 |
25.9/0.56 |
61.4/1.32 |
61.4/1.32 |
11.2/0.24 |
54.1/1.17 |
54.1/1.17 |
6.8/0.15 |
* C-N1: total conflict analysis by SSAM.
C-N2: Conflicts with MaxD = -9.15 m/sec2 (-30 ft/sec2).
C-N3: Conflicts with MaxD greater than and equal to -9.15 m/sec2 (-30 ft/sec2) TTC > 0 and MaxS = 16.1 km/h (10 mi/h).
Figure 161. Graph. Conflicts Number C-N2 Comparison for Intersection 1 at Mid Peak.
Figure 162. Graph. Conflicts Number C-N3 Comparison for Intersection 1 at Mid Peak.
Table 95. Conflicts Number Under PM Peak-Hour Condition for Intersection 1.
|
4,790 v/hr |
TTC = 1.5 |
TTC = 1.0 |
TTC = 0.5 |
|
C-N1* |
C-N2 |
C-N3 |
C-N1 |
C-N2 |
C-N3 |
C-N1 |
C-N2 |
C-N3 |
|
ALL |
|
VISSIM |
44.7/0.93 |
44.7/0.93 |
38.4/0.8 |
5.4/0.11 |
5.4/0.11 |
2.4/0.05 |
4.1/0.09 |
4.1/0.09 |
1.5/0.03 |
|
AIMSUN |
177.1/36.97 |
152.4/3.18 |
111.9/2.34 |
109.4/2.28 |
93.5/1.95 |
59.8/1.25 |
52.9/1.1 |
43.9/0.92 |
13.5/0.28 |
|
PARAMICS |
285.9/5.97 |
180.2/3.76 |
62.2/1.3 |
145.5/3.04 |
109.6/2.29 |
21/0.44 |
111/2.32 |
96.7/2.02 |
13.1/0.27 |
|
TEXAS |
760.2/15.87 |
760.1/15.87 |
283.9/5.93 |
503.2/10.51 |
503.1/10.5 |
170.3/3.56 |
400.1/8.35 |
400/8.35 |
97.8/2.04 |
|
Crossing Conflicts |
|
VISSIM |
1.4/0.03 |
1.4/0.03 |
0.94/0.02 |
1.2/0.03 |
1.2/0.03 |
0.3/0.01 |
1/0.02 |
1/0.02 |
0.1/0 |
|
AIMSUN |
1.6/0.03 |
0.9/0.02 |
0.7/0.01 |
1.2/0.03 |
0.7/0.01 |
0.5/0.01 |
0.5/0.01 |
0.4/0.01 |
0.2/0 |
|
PARAMICS |
36/0.75 |
32.1/0.67 |
1/0.02 |
35.7/0.75 |
31.8/0.66 |
0.7/0.01 |
35.6/0.74 |
31.7/0.66 |
0.6/0.01 |
|
TEXAS |
87.9/1.84 |
87.9/1.84 |
6.6/0.14 |
85.1/1.78 |
85.1/1.78 |
3.9/0.08 |
83.8/1.75 |
83.8/1.75 |
2.6/0.05 |
|
Rear-End Conflicts |
|
VISSIM |
37.6/0.78 |
37.60.78 |
33.5/0.7 |
1.6/0.03 |
1.6/0.03 |
0.5/0.01 |
1.1/0.02 |
1.1/0.02 |
0.3/0.01 |
|
AIMSUN |
146.6/3.06 |
126.9/2.65 |
88.7/1.85 |
93.9/1.96 |
79.4/1.66 |
47/0.98 |
49.9/1.04 |
41.3/0.86 |
11.8/0.25 |
|
PARAMICS |
225.8/4.71 |
127.7/2.67 |
49.4/1.03 |
95.1/1.99 |
64.4/1.34 |
14/0.29 |
63/1.32 |
52.9/1.1 |
7/0.15 |
|
TEXAS |
619.4/12.93 |
619.4/12.93 |
262.5/5.48 |
375.6/7.84 |
375.6/7.84 |
158.7/3.31 |
277.9/5.8 |
277.9/5.8 |
91.1/1.9 |
|
Lane-Changing Conflicts |
|
VISSIM |
5.7/0.12 |
5.7/0.12 |
4.4/0.09 |
2.6/0.05 |
2.6/0.05 |
1.6/0.03 |
2/0.04 |
2/0.04 |
1.1/0.02 |
|
AIMSUN |
28.9/0.6 |
24.6/0.51 |
22.5/0.47 |
14.3/0.3 |
13.4/0.28 |
12.3/0.26 |
2.5/0.05 |
2.2/0.05 |
1.5/0.03 |
|
PARAMICS |
24.1/0.5 |
20.4/0.43 |
11.8/0.25 |
14.7/0.31 |
13.4/0.28 |
6.3/0.13 |
12.4/0.26 |
12.1/0.25 |
5.5/0.11 |
|
TEXAS |
52.9/1.1 |
52.8/1.1 |
14.8/0.31 |
42.5/0.89 |
42.4/0.89 |
7.7/0.16 |
38.4/0.8 |
38.3/0.8 |
4.1/0.09 |
* C-N1: total conflict analysis by SSAM.
C-N2: Conflicts with MaxD = -9.15 m/sec2 (-30 ft/sec2).
C-N3: Conflicts with MaxD greater than and equal to -9.15 m/sec2 (-30 ft/sec2) TTC > 0 and MaxS = 16.1 km/h (10 mi/h).
Figure 163. Graph. Conflicts Number C-N2 Comparison for Intersection 1 at PM Peak.
Figure 164. Graph. Conflicts Number C-N3 Comparison for Intersection 1 at PM Peak.
Intersection 2: Roswell Road & Abernathy Road, Fulton County, Atlanta, GA:
The number of conflicts/conflict rates under AM, mid, and PM peak-hour conditions was tabulated and is shown in table 96 to table 98. Column charts were created to compare the conflicts number generated from the four simulation platforms, as seen in figure 165 through figure 170.
As shown in the following tables and figures, for all simulation models, most of the conflicts were rear-end conflicts, and crossing conflicts were the least conflicts among all conflicts types. Crossing conflicts had a smaller TTC value while rear-end conflicts had a larger TTC value. Most of the low-speed conflicts were rear-end conflicts. The differences among the four simulation models were the following:
- VISSIM had the least conflict number for all categories. TEXAS had the most conflict number for all categories. TEXAS had 10 times more conflicts than VISSIM.
- The ascending ranking order in most cases was VISSIM, PARAMICS, AIMSUN, TEXAS. However, for the TTC < 0.5 category, the order was VISSIM, PARAMICS, AIMSUN, TEXAS, implying that PARAMICS had a higher percentage of severe conflicts than AIMSUN.
- VISSIM and TEXAS had almost no abnormal deceleration maneuvers, while AIMSUN and PARAMICS had 10 to 30 percent conflicts with abnormal deceleration. Most of the abnormal deceleration maneuvers were from rear-end conflicts. Conflicts with abnormal deceleration were almost evenly distributed in the three TTC categories for AIMSUN. While in PARAMICS, more than half of the conflicts with abnormal deceleration had a TTC = 1.0.
- Most of the conflicts in TEXAS and AIMSUN were less severe conflicts (conflicts with TTC = 0.5), while in PARAMICS and VISSIM most conflicts were severe conflicts (conflicts with TTC < 0.5) (based on comparison of C-N2).
- The percentage of lane-change conflicts in TEXAS was the smallest.
Table 96. Conflicts Number Under AM Peak-Hour Condition for Intersection 2.
|
5,260 v/hr |
TTC = 1.5 |
TTC = 1.0 |
TTC = 0.5 |
|
C-N1* |
C-N2 |
C-N3 |
C-N1 |
C-N2 |
C-N3 |
C-N1 |
C-N2 |
C-N3 |
|
ALL |
|
VISSIM |
189.3/3.6 |
189.3/3.6 |
85.8/1.63 |
92.9/1.77 |
92.9/1.77 |
14.4/0.27 |
82.9/1.58 |
82.9/1.58 |
7.2/0.14 |
|
AIMSUN |
1091.3/20.75 |
914.9/17.39 |
493.8/9.39 |
548.5/10.43 |
449.7/8.55 |
232.2/4.41 |
138.8/2.64 |
91.3/1.74 |
23.6/0.45 |
|
PARAMICS |
728.6/13.85 |
515.3/9.8 |
207.7/3.95 |
438.7/8.34 |
347.1/6.6 |
89.5/1.7 |
337.2/6.41 |
283.6/5.39 |
34.4/0.65 |
|
TEXAS |
2,679.8/50.95 |
2,679.8/50.95 |
991.7/18.85 |
1,164.7/22.14 |
1,164.7/22.14 |
487.7/9.27 |
559/10.63 |
559/10.63 |
92.5/1.76 |
|
Crossing Conflicts |
|
VISSIM |
1.3/0.02 |
1.3/0.02 |
0/0 |
1.3/0.02 |
1.3/0.02 |
0/0 |
1.3/0.02 |
1.3/0.02 |
0/0 |
|
AIMSUN |
14.4/0.27 |
8.9/0.17 |
7.2/0.14 |
11.5/0.22 |
6.7/0.13 |
5.7/0.11 |
4.5/0.09 |
2.8/0.05 |
2.2/0.04 |
|
PARAMICS |
12.2/0.23 |
10.7/0.2 |
0.5/0.01 |
11.8/0.22 |
10.4/0.2 |
0.2/0 |
11.6/0.22 |
10.2/0.19 |
0/0 |
|
TEXAS |
109.1/2.07 |
109.1/2.07 |
13.8/0.26 |
103/1.96 |
103/1.96 |
8.4/0.16 |
98.3/1.87 |
98.3/1.87 |
3.9/0.07 |
|
Rear-End Conflicts |
|
VISSIM |
141.4/2.69 |
141.4/2.69 |
66.5/1.26 |
58.3/1.11 |
58.3/1.11 |
4.9/0.09 |
53.2/1.01 |
53.2/1.01 |
1.6/0.03 |
|
AIMSUN |
899.5/17.1 |
742/14.11 |
376.9/7.17 |
434.6/8.26 |
348.2/6.62 |
169.1/3.21 |
115.4/2.19 |
71.4/1.36 |
11.9/0.23 |
|
PARAMICS |
653.8/112.43 |
449.5/8.55 |
181.4/3.45 |
382.3/7.27 |
296.8/5.64 |
77/1.46 |
290.8/5.53 |
241.9/4.6 |
29.8/0.57 |
|
TEXAS |
2,360.8/44.88 |
2,360.8/44.88 |
931.2/17.7 |
892.1/16.96 |
892.1/16.96 |
452.9/8.61 |
311.6/5.92 |
311.6/2.92 |
75.4/1.43 |
|
Lane-Changing Conflicts |
|
VISSIM |
46.6/0.89 |
46.6/0.89 |
19.3/0.37 |
33.3/0.63 |
33.3/0.63 |
9.5/0.18 |
28.4/0.54 |
28.4/0.54 |
5.6/0.11 |
|
AIMSUN |
177.4/3.37 |
164/3.12 |
109.7/2.09 |
102.4/1.95 |
94.8/1.8 |
57.4/1.09 |
18.9/0.36 |
17.1/0.33 |
9.5/0.18 |
|
PARAMICS |
62.6/1.19 |
55.1/1.05 |
25.8/0.49 |
44.6/0.85 |
39.9/0.76 |
12.3/0.23 |
24.8/0.66 |
31.5/0.6 |
4.6/0.09 |
|
TEXAS |
209.9/3.99 |
209.9/3.99 |
46.7/0.89 |
169.6/3.22 |
169.6/3.22 |
26.4/0.5 |
149.1/2.83 |
149.1/2.83 |
13.2/0.25 |
* C-N1: total conflict analysis by SSAM.
C-N2: Conflicts with MaxD = -9.15 m/sec2 (-30 ft/sec2).
C-N3: Conflicts with MaxD greater than and equal to -9.15 m/sec2 (-30 ft/sec2) TTC > 0 and MaxS = 16.1 km/h (10 mi/h).
Figure 165. Graph. Conflicts Number C-N2 Comparison for Intersection 2 at AM Peak.
Figure 166. Graph. Conflicts Number C-N3 Comparison for Intersection 2 at AM Peak.
Table 97. Conflicts Number Under Mid Peak-Hour Condition for Intersection 2.
|
5,685 v/hr |
TTC = 1.5 |
TTC = 1.0 |
TTC = 0.5 |
|
C-N1* |
C-N2 |
C-N3 |
C-N1 |
C-N2 |
C-N3 |
C-N1 |
C-N2 |
C-N3 |
|
ALL |
|
VISSIM |
246.3/4.33 |
246.3/4.33 |
107.2/1.89 |
114.7/2.02 |
114.7/2.02 |
13.7/0.24 |
104.3/1.83 |
104.3/1.83 |
7.1/0.12 |
|
AIMSUN |
1173.9/20.65 |
1021.2/17.96 |
622.6/10.95 |
628.2/11.05 |
531/9.34 |
308.4/5.42 |
135.1/2.38 |
80.8/1.42 |
19.8/0.35 |
|
PARAMICS |
989.1/17.4 |
692.8/12.19 |
271/4.77 |
576.1/10.13 |
457.8/8.05 |
105.1/1.85 |
452.6/7.96 |
358.1/6.77 |
45.5/0.8 |
|
TEXAS |
5,101.6/89.74 |
5,101.6/89.74 |
1,197.3/21.06 |
1,735/30.52 |
1,735/30.52 |
574.4/10.1 |
818.8/14.4 |
818.8/14.4 |
130.9/2.3 |
|
Crossing Conflicts |
|
VISSIM |
2.8/0.05 |
2.8/0.05 |
0.2/0 |
2.6/0.05 |
2.6/0.05 |
0/0 |
2.6/0.05 |
2.6/0.05 |
0/0 |
|
AIMSUN |
7.9/0.14 |
6/0.11 |
3.8/0.07 |
5.4/0.09 |
4/0.07 |
2.5/0.04 |
2.5/0.04 |
1.8/0.03 |
0.3/0.01 |
|
PARAMICS |
18.4/0.32 |
15.8/0.28 |
1.6/0.03 |
17.4/0.31 |
14.9/0.26 |
0.9/0.02 |
16.5/0.29 |
14.2/0.25 |
0.2/0 |
|
TEXAS |
113.2/1.99 |
113.2/1.99 |
13.1/0.23 |
107.5/1.89 |
107.5/1.89 |
7.9/0.14 |
103.7/1.82 |
103.7/1.82 |
4.2/0.07 |
|
Rear-End Conflicts |
|
VISSIM |
181.2/3.19 |
181.2/3.19 |
84.5/1.49 |
70.8/1.25 |
70.8/1.25 |
6/0.11 |
64.8/1.14 |
64.8/1.14 |
2.3/0.04 |
|
AIMSUN |
967.6/17.02 |
827.9/14.56 |
489.9/8.62 |
504.5/8.87 |
413.6/7.28 |
238.2/4.19 |
118.3/2.08 |
65.9/1.16 |
12.8/0.23 |
|
PARAMICS |
880.4/15.49 |
595.3/10.47 |
245.3/4.31 |
489.1/8.6 |
378.4/6.66 |
94.4/1.66 |
375.2/6.6 |
313.5/5.51 |
41.9/0.74 |
|
TEXAS |
4,585.7/80.66 |
4,585.7/80.66 |
1,107.8/19.49 |
1,309/23.03 |
1,309/23.03 |
522.3/9.19 |
425.8/7.49 |
425.8/7.49 |
99.7/1.75 |
|
Lane-Changing Conflicts |
|
VISSIM |
62.3/1.1 |
62.3/1.1 |
22.5/0.4 |
41.3/0.73 |
41.3/0.73 |
7.7/0.14 |
36.9/0.65 |
36.9/0.65 |
4.8/0.08 |
|
AIMSUN |
198.4/3.49 |
187.3/3.29 |
128.9/2.27 |
118.3/2.08 |
113.4/1.99 |
67.7/1.19 |
14.3/0.25 |
13.1/0.23 |
6.7/0.12 |
|
PARAMICS |
90.3/1.59 |
81.7/1.44 |
24.1/0.42 |
69.6/1.22 |
64.5/1.13 |
9.8/0.17 |
60.9/1.07 |
57.4/1.01 |
3.4/0.06 |
|
TEXAS |
402.7/7.08 |
402.7/7.08 |
76.4/1.34 |
318.5/5.6 |
318.5/5.6 |
44.2/0.78 |
289.3/5.09 |
289.3/5.09 |
27/0.47 |
* C-N1: total conflict analysis by SSAM.
C-N2: Conflicts with MaxD = -9.15 m/sec2 (-30 ft/sec2).
C-N3: Conflicts with MaxD greater than and equal to -9.15 m/sec2 (-30 ft/sec2) TTC > 0 and MaxS = 16.1 km/h (10 mi/h).
Figure 167. Graph. Conflicts Number C-N2 Comparison for Intersection 2 at Mid Peak.
Figure 168. Graph. Conflicts Number C-N3 Comparison for Intersection 2 at Mid Peak.
Table 98. Conflicts Number Under PM Peak-Hour Condition for Intersection 2.
|
5,585 v/hr |
TTC = 1.5 |
TTC = 1.0 |
TTC = 0.5 |
|
C-N1* |
C-N2 |
C-N3 |
C-N1 |
C-N2 |
C-N3 |
C-N1 |
C-N2 |
C-N3 |
|
ALL |
|
VISSIM |
226.8/4.06 |
226.8/4.06 |
101.2/1.81 |
119.4/2.14 |
119.4/2.14 |
22.1/0.4 |
104.6/1.87 |
104.6/1.87 |
11.1/0.2 |
|
AIMSUN |
786.6/14.08 |
687/12.3 |
415/7.43 |
445.5/7.98 |
380.3/6.81 |
215.1/3.85 |
109.4/1.96 |
71.7/1.28 |
14.7/0.26 |
|
PARAMICS |
708.6/12.69 |
485.1/8.69 |
169.8/3.04 |
387.7/6.94 |
313.8/5.62 |
61.7/1.1 |
302.1/5.41 |
269.3/4.82 |
30.4/0.54 |
|
TEXAS |
4,209.1/75.36 |
4,208.9/75.36 |
1,366.2/24.46 |
1,670.3/29.91 |
1,670.1/29.9 |
663.9/11.89 |
789.7/14.14 |
789.5/14.14 |
142.6/2.55 |
|
Crossing Conflicts |
|
VISSIM |
1.7/0.03 |
1.7/0.03 |
0.2/0 |
1.6/0.03 |
1.6/0.03 |
0.1/0 |
1.6/0.03 |
1.6/0.03 |
0.1/0 |
|
AIMSUN |
14.9/0.27 |
11.3/0.2 |
6.4/0.11 |
10.3/0.18 |
8.1/0.15 |
3.4/0.06 |
6.3/0.11 |
6/0.11 |
1.4/0.03 |
|
PARAMICS |
17.3/0.31 |
16/0.29 |
1.2/0.02 |
16.8/0.3 |
15.5/0.28 |
0.7/0.02 |
16.3/0.29 |
15/0.27 |
0.2/0 |
|
TEXAS |
98/1.75 |
98/1.75 |
14.1/0.25 |
94.1/1.68 |
94.1/1.68 |
10.3/0.18 |
91.4/1.64 |
91.4/1.64 |
7.9/0.14 |
|
Rear-End Conflicts |
|
VISSIM |
149.3/2.67 |
149.3/2.67 |
70.5/1.26 |
62.6/1.12 |
62.6/1.12 |
6.4/0.11 |
57/1.03 |
57/1.02 |
2.8/0.05 |
|
AIMSUN |
626.4/11.22 |
542.7/9.72 |
321.4/5.75 |
345.5/6.19 |
287.8/5.15 |
162.8/2.91 |
90.1/1.61 |
53.8/0.96 |
8.3/0.15 |
|
PARAMICS |
612.7/10.97 |
396.6/7.1 |
147.4/2.64 |
313.3/5.61 |
244.5/4.38 |
55/0.98 |
235.1/4.21 |
205.8/3.68 |
28.1/0.5 |
|
TEXAS |
3,744.9/67.05 |
3,744.9/67.05 |
1,340/23.99 |
1,280.9/22.93 |
1,280.9/22.93 |
609/10.9 |
442.9/7.93 |
442.9/7.93 |
113.2/2.03 |
|
Lane-Changing Conflicts |
|
VISSIM |
75.8/1.36 |
75.8/1.36 |
30.5/0.55 |
55.2/0.99 |
55.2/0.99 |
15.6/0.28 |
46/0.82 |
46/0.82 |
8.2/0.15 |
|
AIMSUN |
145/2.6 |
133/2.38 |
87.2/1.56 |
89.7/1.61 |
84.4/1.51 |
48.9/0.88 |
13/0.23 |
11.9/0.21 |
5/0.09 |
|
PARAMICS |
78.6/1.41 |
72.5/1.3 |
21.2/0.38 |
57.6/1.03 |
53.8/0.96 |
6/0.11 |
50.7/0.91 |
48.5/0.87 |
2.1/0.04 |
|
TEXAS |
366.2/6.56 |
366/6.55 |
8.2/0.15 |
295.3/5.29 |
295.1/5.28 |
44.6/0.8 |
255.4/4.57 |
255.2/4.57 |
21.5/0.38 |
* C-N1: total conflict analysis by SSAM.
C-N2: Conflicts with MaxD = -9.15 m/sec2 (-30 ft/sec2).
C-N3: Conflicts with MaxD greater than and equal to -9.15 m/sec2 (-30 ft/sec2) TTC > 0 and MaxS = 16.1 km/h (10 mi/h).
Figure 169. Graph. Conflicts Number C-N2 Comparison for Intersection 2 at PM Peak.
Figure 170. Graph. Conflicts Number C-N3 Comparison for Intersection 2
at PM Peak.
Intersection 3: Lafayette Ave & Fulton Street, Grand Rapids, MI:
The number of conflicts/conflict rates under AM and PM peak-hour conditions was tabulated and is shown in table 99 and table 100. Column charts were created to compare the conflicts number generated from the four simulation platforms, as shown in figure 171 through figure 174.
As shown in the following tables and figures, for all simulation models, most of the conflicts were rear-end conflicts, and crossing conflicts were the least conflicts among all conflicts types. Crossing conflicts had a smaller TTC value while rear-end conflicts had a larger TTC value. The differences among the four simulation models were the following:
- VISSIM had the least conflict number for all categories.
- The ascending ranking order in most cases was VISSIM, PARAMICS, TEXAS, AIMSUN. However, for the TTC < 0.5 category, the order was VISSIM, AIMSUN, TEXAS, PARAMICS, implying that PARAMICS had a higher percentage of severe conflicts than AIMSUN.
- VISSIM and TEXAS had almost no abnormal deceleration maneuvers, while AIMSUN and PARAMICS had 9 to 15 percent conflicts with abnormal deceleration. Most of the abnormal deceleration maneuvers were from rear-end conflicts.
- Less than 15 percent of conflicts from VISSIM were low-speed or crash events; AIMSUN, PARAMICS, and TEXAS had a higher percentage of low-speed or crash events (25 to 70 percent). Most of the low-speed conflicts were rear-end conflicts.
- Most of the conflicts in VISSIM and AIMSUN were less severe conflicts (conflicts with TTC = 0.5), while in PARAMICS and TEXAS, the percentage of severe conflicts (conflicts with TTC < 0.5) was higher than in the other two simulation platforms (based on comparison of C-N2).
- The percentage of lane change conflicts in TEXAS was the smallest.
Table 99. Conflicts Number Under AM Peak-Hour Condition for Intersection 3.
|
1,975 v/hr |
TTC = 1.5 |
TTC = 1.0 |
TTC = 0.5 |
|
C-N1* |
C-N2 |
C-N3 |
C-N1 |
C-N2 |
C-N3 |
C-N1 |
C-N2 |
C-N3 |
|
ALL |
|
VISSIM |
47.8/2.42 |
47.8/2.42 |
41.1/2.08 |
4.2/0.21 |
4.2/0.21 |
0.9/0.05 |
3.7/0.19 |
3.7/0.19 |
0.6/0.03 |
|
AIMSUN |
138.3/7.00 |
126.7/6.42 |
104.6/5.3 |
79/4 |
71.5/3.62 |
55.3/2.8 |
9.8/0.5 |
7.4/0.37 |
1/0.05 |
|
PARAMICS |
72.6/3.68 |
63.1/3.19 |
27.2/1.38 |
50.9/2.58 |
46.6/2.36 |
12/0.61 |
39.9/2.02 |
37.3/1.89 |
3.2/0.16 |
|
TEXAS |
104.8/5.31 |
104.7/5.3 |
45.2/2.29 |
45.7/2.31 |
45.6/2.31 |
15/0.76 |
30.3/1.53 |
30.2/1.53 |
2/0.1 |
|
Crossing Conflicts |
|
VISSIM |
0.8/0.04 |
0.8/0.04 |
0/0 |
0.8/0.04 |
0.8/0.04 |
0/0 |
0.8/0.04 |
0.8/0.04 |
0/0 |
|
AIMSUN |
6.8/0.34 |
3.2/0.16 |
3.2/0.16 |
2.9/0.15 |
0.5/0.03 |
0.5/0.03 |
0.2/0.01 |
0.1/0.01 |
0.1/0.01 |
|
PARAMICS |
2/0.1 |
2/0.1 |
0.4/0.02 |
2/0.1 |
2/0.1 |
0.4/0.02 |
1.7/0.09 |
1.7/0.09 |
0.1/0.01 |
|
TEXAS |
31.9/1.62 |
31.8/1.61 |
3.8/0.19 |
30.9/1.56 |
30.8/1.56 |
2.8/0.14 |
29.7/1.5 |
29.6/1.5 |
1.6/0.08 |
|
Rear-End Conflicts |
|
VISSIM |
42.4/2.15 |
42.4/2.15 |
37.9/1.92 |
1.6/0.08 |
1.6/0.08 |
0.1/0.01 |
1.4/0.07 |
1.4/0.07 |
0/0 |
|
AIMSUN |
119.3/6.04 |
111.9/5.67 |
91.6/4.64 |
68.7/3.48 |
63.8/3.23 |
49/2.48 |
9.3/0.47 |
7/0.35 |
0.6/0.03 |
|
PARAMICS |
54.9/2.78 |
48.9/2.48 |
26.1/1.32 |
36.5/1.85 |
32.8/1.66 |
11.2/0.57 |
26.7/1.35 |
24.1/1.22 |
3/0.15 |
|
TEXAS |
70.9/3.59 |
70.9/3.59 |
39.9/2.02 |
14.4/0.73 |
14.4/0.73 |
11.8/0.6 |
0.6/.03 |
0.6/0.03 |
0.4/0.02 |
|
Lane-Changing Conflicts |
|
VISSIM |
4.6/0.23 |
4.6/0.23 |
3.2/0.16 |
1.8/0.09 |
1.8/0.09 |
0.8/0.04 |
1.5/0.08 |
1.5/0.08 |
0.6/0.03 |
|
AIMSUN |
12.2/0.62 |
11.6/0.59 |
9.8/0.5 |
7.4/0.37 |
7.2/0.36 |
5.8/0.29 |
0.3/0.02 |
0.3/0.02 |
0.3/0.02 |
|
PARAMICS |
15.7/0.79 |
12.2/0.62 |
0.7/0.04 |
12.4/0.63 |
11.8/0.6 |
0.4/0.02 |
11.5/0.58 |
11.5/0.58 |
0.1/0.01 |
|
TEXAS |
2/0.1 |
2/0.1 |
1.5/0.08 |
0.4/0.02 |
0.4/0.02 |
0.4/0.02 |
0/0 |
0/0 |
0/0 |
* C-N1: total conflict analysis by SSAM.
C-N2: Conflicts with MaxD = -9.15 m/sec2 (-30 ft/sec2).
C-N3: Conflicts with MaxD greater than and equal to -9.15 m/sec2 (-30 ft/sec2) TTC > 0 and MaxS = 16.1 km/h (10 mi/h).
Figure 171. Graph. Conflicts Number C-N2 Comparison for Intersection 3
at AM Peak.
Figure 172. Graph. Conflicts Number C-N3 Comparison for Intersection 3
at AM Peak.
Table 100. Conflicts Number Under PM Peak-Hour Condition for Intersection 3.
|
2,400 v/hr |
TTC = 1.5 |
TTC = 1.0 |
TTC = 0.5 |
|
C-N1* |
C-N2 |
C-N3 |
C-N1 |
C-N2 |
C-N3 |
C-N1 |
C-N2 |
C-N3 |
|
ALL |
|
VISSIM |
73.6/3.07 |
73.6/3.07 |
59.9/2.5 |
9/0.38 |
9/0.38 |
2.1/0.09 |
8.1/0.34 |
8.1/0.34 |
1.2/0.05 |
|
AIMSUN |
218.4/9.1 |
199/8.29 |
148.6/6.19 |
133.3/5.55 |
120.3/4.01 |
82.8/3.45 |
19.1/0.8 |
15.5/0.65 |
1.4/0.06 |
|
PARAMICS |
124.1/5.17 |
98.5/4.1 |
41.2/1.72 |
76.5/3.19 |
67.3/2.8 |
15.2/0.63 |
59.9/2.5 |
55.3/2.3 |
4/0.17 |
|
TEXAS |
179.7/7.49 |
179.6/7.48 |
62.2/2.59 |
70.5/2.94 |
70.4/0.93 |
19.9/0.83 |
43.1/1.8 |
43/1.79 |
3.4/0.14 |
|
Crossing Conflicts |
|
VISSIM |
1.5/0.06 |
1.5/0.06 |
0.2/0.01 |
1.4/0.06 |
1.4/0.06 |
0.1/0 |
1.3/0.05 |
1.3/0.05 |
0/0 |
|
AIMSUN |
13.3/0.55 |
7.5/0.31 |
6.9/0.29 |
6.7/0.28 |
2.1/0.09 |
1.5/0.06 |
0.6/0.03 |
0.6/0.03 |
0.2/0.01 |
|
PARAMICS |
2.6/0.11 |
2.3/0.1 |
0.9/0.04 |
1.8/0.08 |
1.8/0.08 |
0.4/0.61 |
1.5/0.06 |
1.5/0.06 |
0.1/0 |
|
TEXAS |
41.9/1.75 |
41.8/1.74 |
4.5/0.19 |
40.7/1.7 |
40.6/1.69 |
3.3/0.14 |
40/1.67 |
39.9/1.66 |
2.6/0.11 |
|
Rear-End Conflicts |
|
VISSIM |
61.4/2.56 |
61.4/2.56 |
52.6/2.19 |
4.4/0.18 |
4.4/0.18 |
0.5/0.02 |
4/0.17 |
4/0.17 |
0.1/0 |
|
AIMSUN |
176.6/7.36 |
165.5/6.9 |
122/5.08 |
108.8/4.53 |
101.6/4.23 |
68.9/2.87 |
18.1/0.75 |
14.5/0.6 |
0.9/0.04 |
|
PARAMICS |
102/4.25 |
80.3/3.35 |
39.3/1.64 |
58.3/2.43 |
50.7/2.11 |
14.6/0.61 |
43.3/1.8 |
39.1/1.63 |
3.8/0.16 |
|
TEXAS |
134.6/5.61 |
134.6/5.61 |
55.4/2.31 |
29.3/1.22 |
29.3/1.22 |
16.2/0.68 |
3.1/0.13 |
3.1/0.13 |
0.8/0.03 |
|
Lane-Changing Conflicts |
|
VISSIM |
10.7/0.45 |
10.7/0.45 |
7.1/0.3 |
3.2/0.13 |
3.2/0.13 |
1.5/0.06 |
2.8/0.12 |
2.8/0.12 |
1.1/0.05 |
|
AIMSUN |
28.5/1.19 |
26/1.08 |
19.7/0.82 |
17.8/0.74 |
16.6/0.69 |
12.4/0.52 |
0.4/0.02 |
0.4/0.02 |
0.3/0.01 |
|
PARAMICS |
19.5/0.81 |
15.9/0.66 |
1/0.04 |
16.4/0.68 |
14.8/0.62 |
0.2/0.01 |
15.1/0.63 |
14.7/0.61 |
0.1/0 |
|
TEXAS |
3.2/0.13 |
3.2/0.13 |
2.3/0.1 |
0.5/0.02 |
0.5/0.02 |
0.4/0.02 |
0/0 |
0/0 |
0/0 |
* C-N1: total conflict analysis by SSAM.
C-N2: Conflicts with MaxD = -9.15 m/sec2 (-30 ft/sec2).
C-N3: Conflicts with MaxD greater than and equal to -9.15 m/sec2 (-30 ft/sec2) TTC > 0 and MaxS = 16.1 km/h (10 mi/h).
Figure 173. Graph. Conflicts Number C-N2 Comparison for Intersection 3
at PM Peak.
Figure 174. Graph. Conflicts Number C-N3 Comparison for Intersection 3
at PM Peak.
Intersection 4: Ryan Ave & Davison Ave, Detroit, MI:
The number of conflicts/conflict rates under AM and PM peak-hour conditions was tabulated and is shown in table 101 and table 102. Column charts were created to compare the conflicts number generated from the four simulation platforms, as seen in figure 175 to figure 178.
As shown in the following tables and figures, for all simulation models, most of the conflicts were rear-end conflicts, and crossing conflicts were the least conflicts among all conflicts types. Crossing conflicts had a smaller TTC value while rear-end conflicts had a larger TTC value. The differences among the four simulation models were the following:
- TEXAS had the most conflict number for most of the categories.
- PARAMICS had a higher percentage of severe conflicts than AIMSUN.
- VISSIM and TEXAS had almost no abnormal deceleration maneuvers, while AIMSUN and PARAMICS had 10 percent conflicts with abnormal deceleration, and most of the abnormal deceleration maneuvers were from rear-end conflicts.
- PARAMICS and TEXAS had a higher percentage of low-speed or crash events (over 50 percent). Most of the low-speed conflicts were rear-end conflicts.
- Most of the conflicts in VISSIM, AIMSUN, and TEXAS were less severe conflicts (conflicts with TTC = 0.5), while in PARAMICS, most conflicts were severe conflicts (conflicts with TTC < 0.5), based on comparison of C-N2.
- The percentage of lane change conflicts in TEXAS was the smallest.
Table 101. Conflicts Number Under AM Peak-Hour Condition for Intersection 4.
|
2,613 v/hr |
TTC = 1.5 |
TTC = 1.0 |
TTC = 0.5 |
|
C-N1* |
C-N2 |
C-N3 |
C-N1 |
C-N2 |
C-N3 |
C-N1 |
C-N2 |
C-N3 |
|
ALL |
|
VISSIM |
64.8/2.48 |
64.8/2.48 |
44.1/1.69 |
13.4/0.51 |
13.4/0.51 |
3.3/0.13 |
11.1/0.42 |
11.1/0.42 |
1.3/0.05 |
|
AIMSUN |
158.4/6.06 |
146.5/5.61 |
117.6/4.5 |
96.9/3.71 |
89.4/3.42 |
67.6/2.59 |
22.9/0.88 |
18.9/0.72 |
6.3/0.24 |
|
PARAMICS |
60.8/2.33 |
54/2.07 |
17.7/0.68 |
44.6/1.71 |
42.8/1.64 |
7.8/0.3 |
36.7/1.4 |
36.2/1.39 |
1.7/0.07 |
|
TEXAS |
170.5/6.53 |
170.5/6.53 |
58.1/2.22 |
75.4/2.89 |
75.4/2.89 |
23.2/0.89 |
51.5/1.97 |
51.5/1.97 |
7.2/0.28 |
|
Crossing Conflicts |
|
VISSIM |
1/0.04 |
1/0.04 |
0.1/0 |
1/0.04 |
1/0.04 |
0.1/0 |
0.9/0.03 |
0.9/0.03 |
0/0 |
|
AIMSUN |
3.8/0.15 |
3.3/0.13 |
1.6/0.06 |
3/0.11 |
2.6/0.1 |
0.9/0.03 |
2.3/0.09 |
2.3/0.09 |
0.6/0.02 |
|
PARAMICS |
16.1/0.62 |
16.1/0.62 |
3.4/0.13 |
15.9/0.61 |
15.9/0.61 |
3.2/0.12 |
13.1/0.5 |
13.1/0.5 |
0.4/0.02 |
|
TEXAS |
36.6/1.4 |
36.6/1.4 |
3.8/0.15 |
35.5/1.36 |
35.5/1.36 |
2.7/0.1 |
35/1.34 |
35/1.34 |
2.2/0.08 |
|
Rear-End Conflicts |
|
VISSIM |
54.8/2.1 |
54.8/2.1 |
38.9/1.49 |
6.3/0.24 |
6.3/0.24 |
0.4/0.02 |
6.1/0.23 |
6.1/0.23 |
0.3/0.01 |
|
AIMSUN |
126.6/4.85 |
119.2/4.56 |
96/3.67 |
78.9/3.02 |
73.5/2.81 |
55.9/2.14 |
19.8/0.76 |
16/0.61 |
5.5/0.21 |
|
PARAMICS |
40.2/1.54 |
34.1/1.31 |
11.8/0.45 |
26.8/1.03 |
25.3/0.97 |
4.3/0.16 |
22.2/0.85 |
21.8/0.83 |
1.2/0.05 |
|
TEXAS |
123.3/4.72 |
123.3/4.72 |
50.9/1.95 |
32.5/1.24 |
32.5/1.24 |
18.6/0.71 |
10.2/0.39 |
10.2/0.39 |
4.2/0.16 |
|
Lane-Changing Conflicts |
|
VISSIM |
9/0.34 |
9/0.34 |
5.1/0.2 |
6.1/0.23 |
6.1/0.23 |
2.8/0.11 |
4.1/0.16 |
4.1/0.16 |
1/0.04 |
|
AIMSUN |
28/1.07 |
24/0.92 |
20/0.77 |
15/0.57 |
13.3/0.51 |
10.8/0.41 |
0.8/0.03 |
0.6/0.02 |
0.2/0.01 |
|
PARAMICS |
4.5/0.17 |
3.8/0.15 |
2.5/0.1 |
1.9/0.07 |
1.6/0.06 |
0.3/0.01 |
1.4/0.05 |
1.3/0.05 |
0.1/0 |
|
TEXAS |
10.6/0.41 |
10.6/0.41 |
3.4/0.13 |
7.4/0.28 |
7.4/0.28 |
1.9/0.07 |
6.3/0.24 |
6.3/0.24 |
0.8/0.03 |
* C-N1: total conflict analysis by SSAM.
C-N2: Conflicts with MaxD = -9.15 m/sec2 (-30 ft/sec2).
C-N3: Conflicts with MaxD greater than and equal to -9.15 m/sec2 (-30 ft/sec2) TTC > 0 and MaxS = 16.1 km/h (10 mi/h).
Figure 175. Graph. Conflicts Number C-N2 Comparison for Intersection 4
at AM Peak.
Figure 176. Graph. Conflicts Number C-N3 Comparison for Intersection 4
at AM Peak.
Table 102. Conflicts Number Under PM Peak-Hour Condition for Intersection 4.
|
3,017 v/hr |
TTC = 1.5 |
TTC = 1.0 |
TTC = 0.5 |
|
C-N1* |
C-N2 |
C-N3 |
C-N1 |
C-N2 |
C-N3 |
C-N1 |
C-N2 |
C-N3 |
|
ALL |
|
VISSIM |
111.1/3.68 |
111.1/3.68 |
61.4/2.04 |
37.9/1.26 |
37.9/1.26 |
5.3/0.18 |
33.8/1.12 |
33.8/1.12 |
1.5/0.05 |
|
AIMSUN |
227.5/7.54 |
208.1/6.9 |
161.1/5.34 |
135/4.47 |
123.4/4.09 |
89/2.95 |
30.5/1.01 |
24.2/0.8 |
8.9/0.29 |
|
PARAMICS |
88.7/2.94 |
72.8/2.41 |
22.7/0.75 |
60.7/2.01 |
56.7/1.88 |
9.4/0.31 |
50.1/1.66 |
48.7/1.61 |
2.4/0.08 |
|
TEXAS |
408/13.52 |
408/13.52 |
155.7/5.16 |
226.6/7.51 |
226.6/7.51 |
85.6/2.84 |
173.2/5.74 |
173.2/5.74 |
40/1.33 |
|
Crossing Conflicts |
|
VISSIM |
18.6/0.62 |
18.6/0.62 |
0.8/0.03 |
18.6/0.62 |
18.6/0.62 |
0.8/0.03 |
18.1/0.6 |
18.1/0.6 |
0.3/0.01 |
|
AIMSUN |
5/0.17 |
4.4/0.15 |
2.5/0.08 |
3.5/0.12 |
3.3/0.11 |
1.4/0.05 |
2.1/0.07 |
2.1/0.07 |
0.2/0.01 |
|
PARAMICS |
11.5/0.38 |
11.5/0.38 |
1.2/0.04 |
11.5/0.38 |
11.5/0.38 |
1.2/0.04 |
10.2/0.34 |
10.2/0.34 |
0/0 |
|
TEXAS |
49.6/1.64 |
49.6/1.64 |
4.9/0.16 |
48.5/1.61 |
48.5/1.61 |
3.8/0.13 |
47.4/1.57 |
47.4/1.57 |
2.8/0.09 |
|
Rear-End Conflicts |
|
VISSIM |
73.6/2.44 |
73.6/2.44 |
52.3/1.73 |
9.9/0.33 |
9.9/0.33 |
1.6/0.05 |
8.4/0.28 |
8.4/0.28 |
0.3/0.01 |
|
AIMSUN |
176.5/5.85 |
164.5/5.45 |
124.3/4.12 |
107.2/3.55 |
98.5/3.26 |
69.3/2.3 |
27/0.89 |
21.1/0.7 |
7.8/0.26 |
|
PARAMICS |
67.9/2.25 |
54.3/1.8 |
17/0.56 |
45.4/1.5 |
41.9/1.39 |
7.2/0.24 |
37.3/1.24 |
36.2/1.2 |
2.1/0.07 |
|
TEXAS |
280/9.28 |
280/9.28 |
130.1/4.31 |
110.6/3.67 |
110.6/3.67 |
66.7/2.21 |
63.2/2.09 |
63.2/2.09 |
26.1/0.87 |
|
Lane-Changing Conflicts |
|
VISSIM |
18.9/0.63/ |
18.90.63 |
8.3/0.28 |
9.4/0.31 |
9.4/0.31 |
2.9/0.1 |
7.3/0.24 |
7.3/0.24 |
0.9/0.03 |
|
AIMSUN |
46/1.52 |
39.2/1.3 |
34.3/1.14 |
24.3/0.81 |
21.6/0.72 |
18.3/0.61 |
1.4/0.05 |
1/0.03 |
0.9/0.03 |
|
PARAMICS |
9.3/0.31 |
7/0.23 |
4.5/0.15 |
3.8/0.13 |
3.3/0.11 |
1/0.03 |
2.6/0.09 |
2.3/0.08 |
0.3/0.01 |
|
TEXAS |
78.4/0.6 |
78.4/2.6 |
20.7/0.69 |
67.5/2.24 |
67.5/2.24 |
15.1/0.5 |
62.6/2.07 |
62.6/2.07 |
11.1/0.37 |
* C-N1: total conflict analysis by SSAM.
C-N2: Conflicts with MaxD = -9.15 m/sec2 (-30 ft/sec2).
C-N3: Conflicts with MaxD greater than and equal to -9.15 m/sec2 (-30 ft/sec2) TTC > 0 and MaxS = 16.1 km/h (10 mi/h).
Figure 177. Graph. Conflicts Number C-N2 Comparison for Intersection 4
at PM Peak.
Figure 178. Graph. Conflicts Number C-N3 Comparison for Intersection 4
at PM Peak.
Intersection 5: Howe Ave & Fair Oaks Boulevard, Sacramento, CA:
The number of conflicts/conflict rates under AM and PM peak-hour conditions was tabulated and are shown in table 103 and table 104. Column charts were created to compare the conflicts number generated from the four simulation platforms, as seen in figure 179 through figure 182.
As shown in the following tables and figures, for all simulation models, most of the conflicts were rear-end conflicts, and crossing conflicts were the least conflicts among all conflicts types. Crossing conflicts had a smaller TTC value while rear-end conflicts had a larger TTC value. The differences among the four simulation models were the following:
- VISSIM had the least conflict number for all categories. TEXAS had the most conflict number for all categories except for lane change category.
- The ascending ranking order in most cases was VISSIM, PARAMICS, AIMSUN, TEXAS.
- VISSIM and TEXAS had almost no abnormal deceleration maneuvers, while AIMSUN and PARAMICS had 30 to 40 percent conflicts with abnormal deceleration).
- Most of the abnormal deceleration maneuvers were from rear-end conflicts. Conflicts with abnormal deceleration were almost evenly distributed in the three TTC categories for AIMSUN. While in PARAMICS, more than half of the conflicts with abnormal deceleration have TTC = 1.0.
- Most of the conflicts were less severe conflicts (conflicts with TTC = 0.5), and PARAMICS had a higher percentage of severe conflicts (conflicts with TTC < 0.5) than others, based on comparison of C-N2.
- The percentage of lane change conflicts in TEXAS was the smallest.
Table 103. Conflicts Number Under AM Peak-Hour Condition for Intersection 5.
|
6,425 v/hr |
TTC = 1.5 |
TTC = 1.0 |
TTC = 0.5 |
|
C-N1* |
C-N2 |
C-N3 |
C-N1 |
C-N2 |
C-N3 |
C-N1 |
C-N2 |
C-N3 |
|
ALL |
|
VISSIM |
180.9/2.82 |
180.9/2.82 |
102.4/1.59 |
69.1/1.08 |
69.1/1.08 |
13.8/0.21 |
57.6/0.9 |
57.6/0.9 |
5.2/0.08 |
|
AIMSUN |
899/13.99 |
561.6/8.74 |
418/6.51 |
567.7/8.84 |
355.7/5.54 |
237.3/3.69 |
250.7/3.9 |
140.8/2.19 |
48.4/0.75 |
|
PARAMICS |
527.5/8.21 |
330.4/5.14 |
146.4/2.28 |
227.2/3.54 |
164.5/2.56 |
74.5/1.16 |
133.8/2.08 |
121.7/1.89 |
74.5/1.16 |
|
TEXAS |
1,970.6/30.67 |
1,769.5/27.54 |
584.4/9.1 |
641.8/9.99 |
640.9/9.98 |
294.9/4.59 |
301/4.68 |
300.3/4.67 |
75.9/1.18 |
|
Crossing Conflicts |
|
VISSIM |
0.1/0 |
0.1/0 |
0/0 |
0.1/0 |
0.1/0 |
0/0 |
0/0 |
0/0 |
0/0 |
|
AIMSUN |
8/0.12 |
7.2/0.11 |
6.6/0.1 |
5.8/0.09 |
5.5/0.09 |
5.4/0.08 |
0.4/0.01 |
0.1/0 |
0/0 |
|
PARAMICS |
1.4/0.02 |
1.4/0.02 |
0.2/0 |
0.7/0.01 |
0.7/0.01 |
0/0 |
0.7/0.01 |
0.7/0.01 |
0/0 |
|
TEXAS |
12.5/0.19 |
12.5/0.19 |
0/0 |
12.5/0.19 |
12.5/0.19 |
0/0 |
12.4/0.19 |
12.4/0.19 |
0/0 |
|
Rear-End Conflicts |
|
VISSIM |
124.4/1.94 |
124.4/1.94 |
79.8/1.24 |
30.1/0.47 |
30.1/0.47 |
3.7/0.06 |
26.7/0.42 |
26.7/0.42 |
0.8/0.01 |
|
AIMSUN |
736.1/11.46 |
431.3/6.71 |
303.9/4.73 |
475/7.39 |
282.6/4.4 |
175.7/2.73 |
237.4/3.69 |
133.8/2.08 |
46.1/0.72 |
|
PARAMICS |
457.8/7.13 |
289.2/4.5 |
128.2/2 |
185.2/2.88 |
138.5/2.16 |
55.2/0.86 |
111.1/1.73 |
101.1/1.57 |
55.2/0.86 |
|
TEXAS |
1,854.6/28.87 |
1,854.2/28.86 |
551.4/8.58 |
557.7/8.68 |
557.5/8.68 |
277.2/4.31 |
229.8/3.58 |
229.8/3.58 |
67.6/1.05 |
|
Lane-Changing Conflicts |
|
VISSIM |
56.4/0.88 |
56.4/0.88 |
22.6/0.35 |
38.9/0.61 |
38.9/00.61 |
10.1/0.16 |
30.9/0.48 |
30.9/0.48 |
4.4/0.07 |
|
AIMSUN |
154.9/2.41 |
123.1/1.92 |
107.5/1.67 |
86.9/1.35 |
67.6/1.05 |
56.2/0.87 |
12.9/0.2 |
6.9/0.11 |
2.3/0.04 |
|
PARAMICS |
68.3/1.06 |
39.8/0.62 |
18/0.28 |
41.3/0.64 |
25.3/0.39 |
19.3/0.3 |
22/0.34 |
19.9/0.31 |
19.3/0.3 |
|
TEXAS |
103.5/1.61 |
102.8/1.6 |
33/0.51 |
71.6/1.11 |
70.9/1.1 |
17.7/0.28 |
58.8/0.92 |
58.1/0.9 |
8.3/0.13 |
* C-N1: total conflict analysis by SSAM.
C-N2: Conflicts with MaxD = -9.15 m/sec2 (-30 ft/sec2).
C-N3: Conflicts with MaxD greater than and equal to -9.15 m/sec2 (-30 ft/sec2) TTC > 0 and MaxS = 16.1 km/h (10 mi/h).
Figure 179. Graph. Conflicts Number C-N2 Comparison for Intersection 5
at AM Peak.
Figure 180. Graph. Conflicts Number C-N3 Comparison for Intersection 5
at AM Peak.
Table 104. Conflicts Number Under PM Peak-Hour Condition for Intersection 5.
|
8,815 v/hr |
TTC = 1.5 |
TTC = 1.0 |
TTC = 0.5 |
|
C-N1* |
C-N2 |
C-N3 |
C-N1 |
C-N2 |
C-N3 |
C-N1 |
C-N2 |
C-N3 |
|
ALL |
|
VISSIM |
307.7/3.49 |
307.7/3.49 |
157.9/1.79 |
137.7/1.56 |
137.7/1.56 |
29.3/0.33 |
114.2/1.3 |
114.2/1.3 |
10.6/0.12 |
|
AIMSUN |
1339.8/15.2 |
1016.8/11.53 |
663.8/7.53 |
827.1/9.38 |
619.1/7.02 |
356.1/4.04 |
387.4/4.39 |
247.6/2.81 |
70.7/0.8 |
|
PARAMICS |
828.5/9.4 |
537.8/6.1 |
217.4/2.47 |
419.8/4.76 |
298.5/3.39 |
74.5/0.85 |
276.9/3.14 |
222.5/2.52 |
74.5/0.85 |
|
TEXAS |
4,580/51.96 |
4,579.7/51.95 |
1,610/18.26 |
1,967/22.31 |
1,966.8/22.31 |
847/9.61 |
1,066.6/12.1 |
1,066.4/12.1 |
265.6/3.01 |
|
Crossing Conflicts |
|
VISSIM |
0.4/0 |
0.4/0 |
0/0 |
0.4/0 |
0.4/0 |
0/0 |
0.4/0 |
0.4/0 |
0/0 |
|
AIMSUN |
12.7/0.14 |
11.2/0.13 |
8.2/0.09 |
10.3/0.121 |
9.4/0.11 |
7.4/0.08 |
2.1/0.02 |
1.8/0.02 |
0.4/0 |
|
PARAMICS |
0.6/0.01 |
0.6/0.01 |
0/0 |
0.6/0.01 |
0.6/0.01 |
0/0 |
0.5/0.01 |
0.5/0.01 |
0/0 |
|
TEXAS |
33.9/0.38 |
33.9/0.38 |
0.2/0 |
33.2/0.38 |
33.2/0.38 |
0.2/0 |
32.5/0.37 |
32.5/0.37 |
0.2/0 |
|
Rear-End Conflicts |
|
VISSIM |
190.5/2.16 |
190.5/2.16 |
110.3/1.25 |
58/0.66 |
58/0.66 |
7.8/0.09 |
51.2/0.58 |
51.2/0.58 |
2.5/0.03 |
|
AIMSUN |
1080.6/12.26 |
813.9/9.23 |
498.4/5.65 |
696.8/7.9 |
509.8/5.78 |
270.1/3.06 |
372.3/4.22 |
238.3/2.7 |
65.9/0.75 |
|
PARAMICS |
734.8/8.34 |
474.6/5.38 |
181.2/2.06 |
359.8/4.08 |
256.6/2.91 |
55.2/0.63 |
242.2/2.75 |
191.4/2.17 |
55.2/0.63 |
|
TEXAS |
4,126/46.81 |
4,125.8/46.8 |
1,487.5/16.87 |
1,600.3/18.15 |
1,600.2/18.15 |
776.3/8.81 |
749.8/8.51 |
749.7/8.5 |
230.9/2.62 |
|
Lane-Changing Conflicts |
|
VISSIM |
116.8/1.33 |
116.8/1.33 |
47.6/0.54 |
79.3/0.9 |
79.3/0.9 |
21.5/0.24 |
62.6/0.71 |
62.6/0.71 |
8.1/0.09 |
|
AIMSUN |
246.5/2.8 |
191.7/2.17 |
157.2/1.78 |
120/1.36 |
99.9/1.13 |
78.6/0.89 |
13/0.15 |
7.5/0.09 |
4.4/0.05 |
|
PARAMICS |
93.1/1.06 |
62.6/0.71 |
36.2/0.41 |
59.4/0.67 |
41.3/0.47 |
19.3/0.22 |
34.2/0.39 |
30.6/0.35 |
19.3/0.22 |
|
TEXAS |
420.1/4.77 |
420/4.76 |
122.3/1.39 |
333.5/3.78 |
333.4/3.78 |
70.5/0.8 |
284.3/3.23 |
284.2/3.22 |
34.5/0.39 |
* C-N1: total conflict analysis by SSAM.
C-N2: Conflicts with MaxD = -9.15 m/sec2 (-30 ft/sec2).
C-N3: Conflicts with MaxD greater than and equal to -9.15 m/sec2 (-30 ft/sec2) TTC > 0 and MaxS = 16.1 km/h (10 mi/h).
Figure 181. Graph. Conflicts Number C-N2 Comparison for Intersection 5
at PM Peak.
Figure 182. Graph. Conflicts Number C-N3 Comparison for Intersection 5
at PM Peak.
In general, most of the conflicts were rear-end conflicts, and Crossing conflicts were the least. Crossing conflicts had a smaller TTC value while rear-end conflicts had a larger TTC value. Differences among VISSIM, AIMSUN, PARAMICS, and TEXAS were as follows:
- For all cases, VISSIM had the least conflict number across all categories.
- For most of the cases, TEXAS had the most conflict number across all categories. When traffic volume was increasing, the ratio between conflicts number from VISSIM and conflicts number from TEXAS also increased.
- The ascending ranking order in most cases was VISSIM, AIMSUN, PARAMICS, TEXAS. When there was less traffic, the ranking order was VISSIM, PARAMICS, TEXAS, AIMSUN.
- AIMSUN had a higher percentage of low-speed conflicts or crashes than PARAMICS, while PARAMICS had a higher percentage of severe conflicts than AIMSUN.
- VISSIM and TEXAS had no abnormal deceleration maneuvers, while AIMSUN and PARAMICS had 10 to 40 percent conflicts with abnormal deceleration. Most of the abnormal deceleration maneuvers were from rear-end conflicts. More than half of the conflicts with abnormal deceleration had TTC = 1.0.
- Conflicts with abnormal deceleration were almost evenly distributed in the three TTC categories for AIMSUN. In PARAMICS, more than half of the conflicts with abnormal deceleration had TTC = 1.0.
- VISSIM and AIMSUN had a smaller percentage of low-speed or crash events than PARAMICS and TEXAS. PARAMICS and TEXAS had over 50 percent of total conflicts as low-speed conflicts or crashes. Most of the low-speed conflicts were rear-end conflicts.
- Most conflicts in VISSIM, AIMSUN, and TEXAS were less severe conflicts (conflicts with TTC = 0.5), while in PARAMICS, most conflicts were severe conflicts (conflicts with TTC < 0.5), based on comparison of C-N2.
- The percentage of lane change conflicts in TEXAS was the smallest.
Previous | Table of Contents | Next |


