U.S. Department of Transportation
Federal Highway Administration
1200 New Jersey Avenue, SE
Washington, DC 20590
202-366-4000
Federal Highway Administration Research and Technology
Coordinating, Developing, and Delivering Highway Transportation Innovations
 |
| This report is an archived publication and may contain dated technical, contact, and link information |
|
Publication Number: FHWA-HRT-08-051
Date: June 2008 |
|||||||||||||||||||||||||||||||||||||||||||||||||||||||||||||||||||||||||||||||||||||||||||||||||||||||||||||||||||||||||||||||||||||||||||||||||||||||||||||||||||||||||||||||||||||||||||||||||||||||||||||||||||||||||||||||||||||||||||||||||||||||||||||||||||||||||||||||||||||||||||||||||||||||||||||||||||||||||||||||||||||||||||||||||||||||||||||||||||||||||||||||||||||||||||||||||||||||||||||||||||||||||||||||||||||||||||||||||||||||||||||||||||||||||||||||||||||||||||||||||||||||||||||||||||||||||||||||||||||||||||||||||||||||||||||||||||||||||||||||||||||||||||||||||||||||||||||||||||||||||||||||||||||||||||||||||||||||||||||||||||||||||||||||||||||||||||||||||||||||||||||||||||||||||||||||||||||||||||||||||||||||||||||||||||||||||||||||||||||||||||||||||||||||||||||||||||||||||||||||||||||||||||||||||||||||||||||||||||||||||||||||||||||||||||||||||||||||||||||||||||||||||||||||||||||||||||||||||||||||||||||||||||||||||||||||||||||||||||||||||||||||||||||||||||||||||||||||||||||||
Surrogate Safety Assessment Model and Validation: Final ReportPDF Version (3.39 MB)
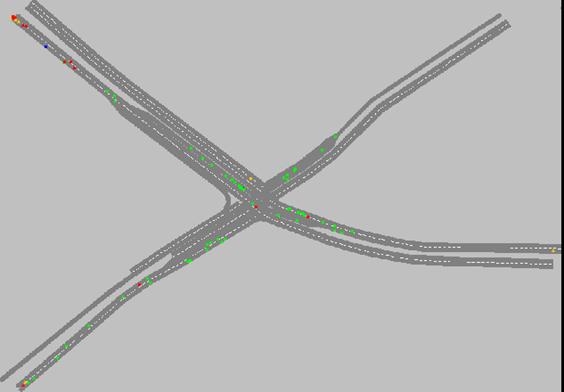
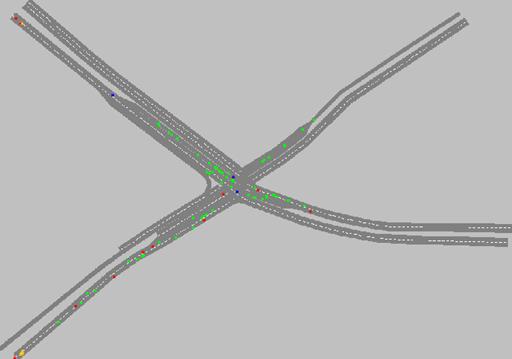
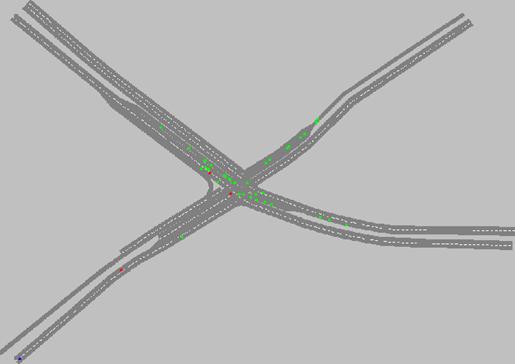
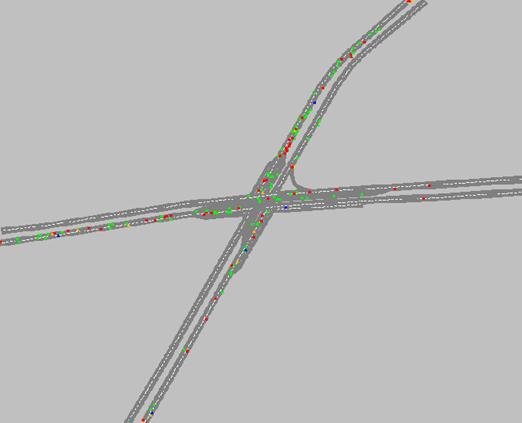
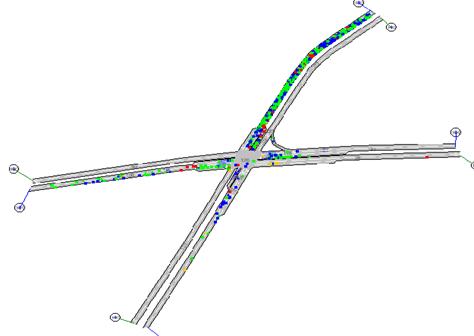
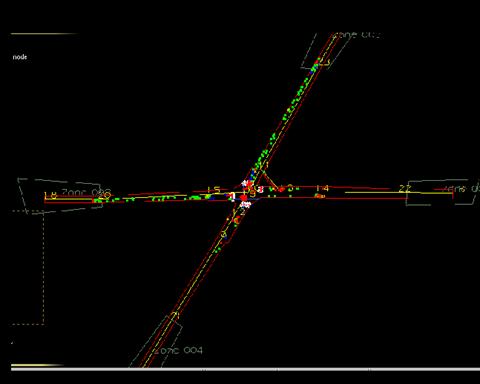
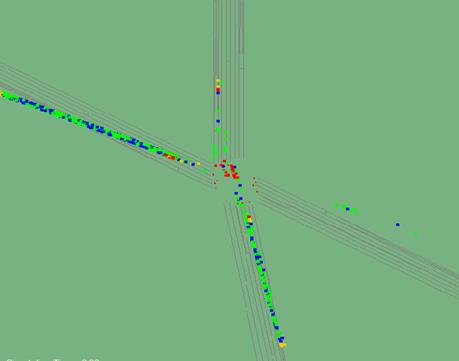
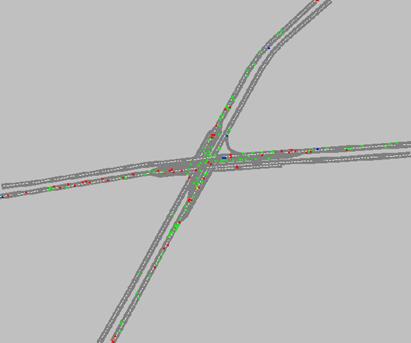
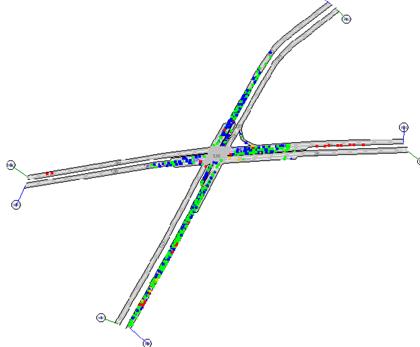
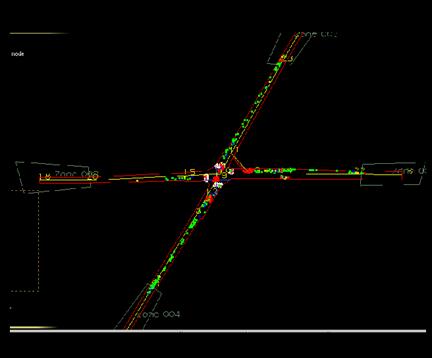
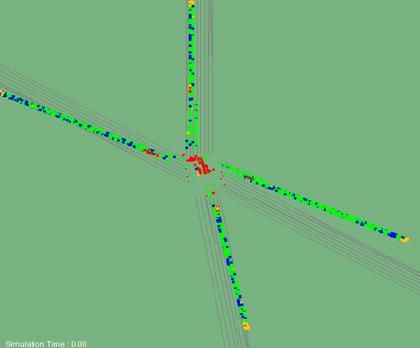
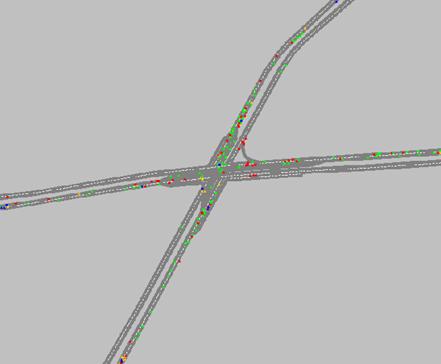
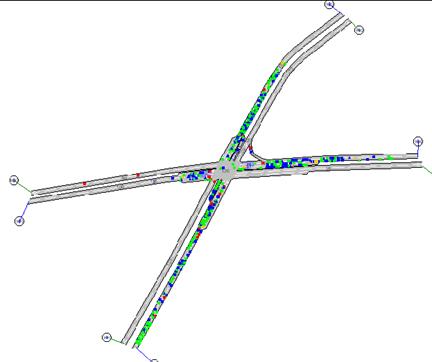
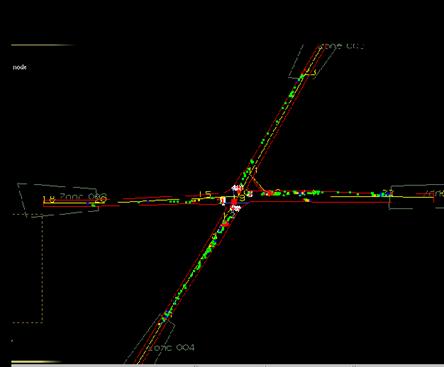
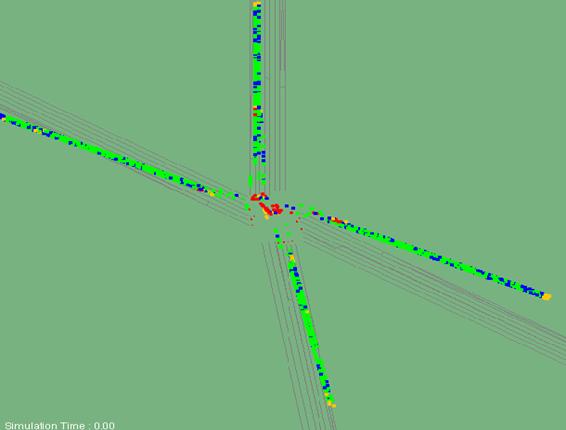
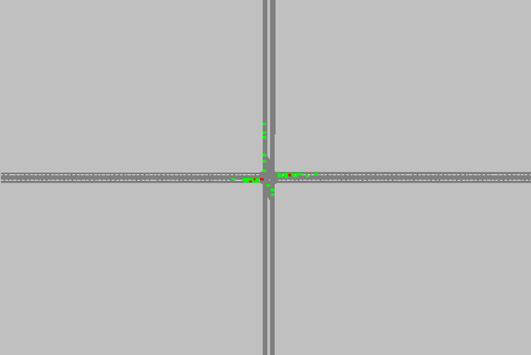
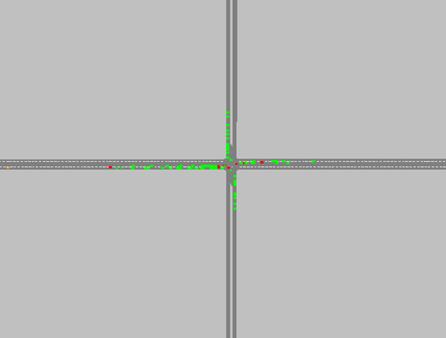
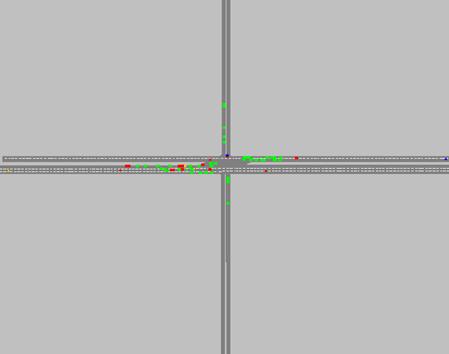
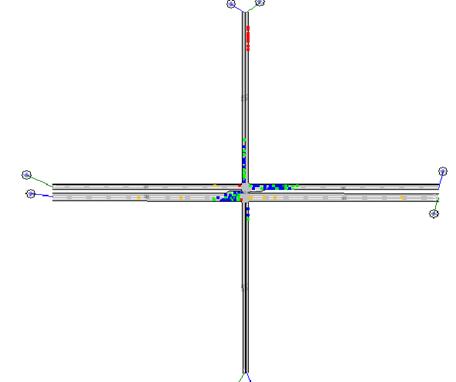
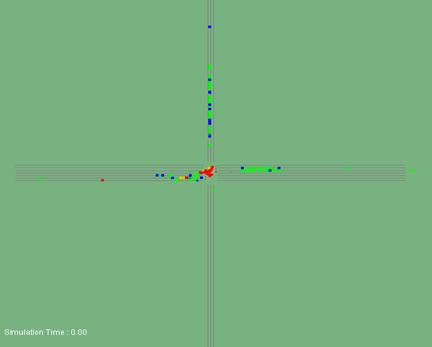
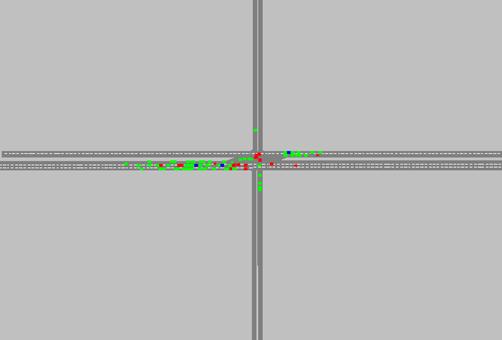
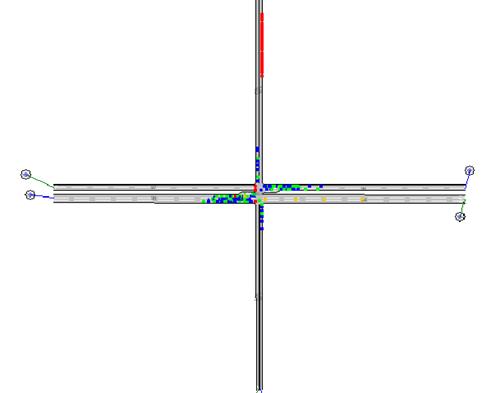
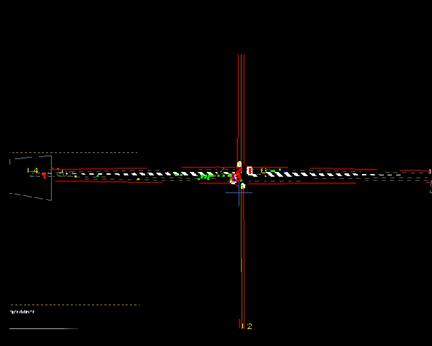
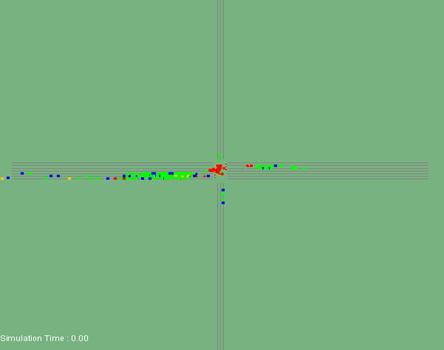
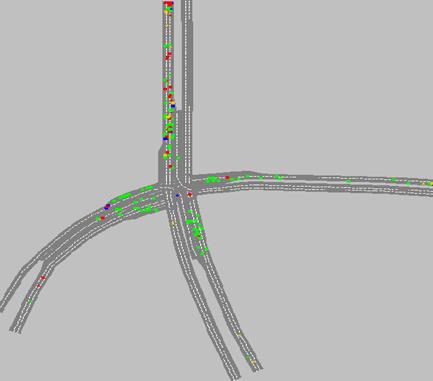
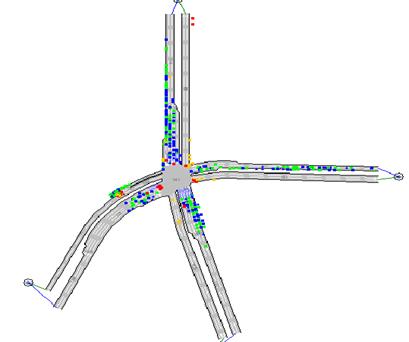
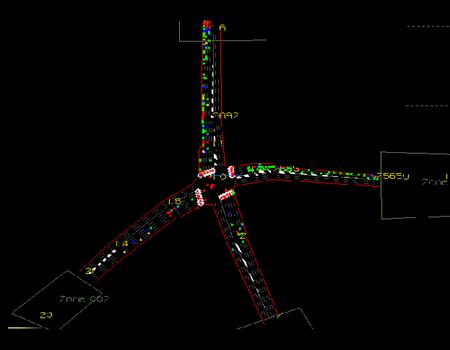
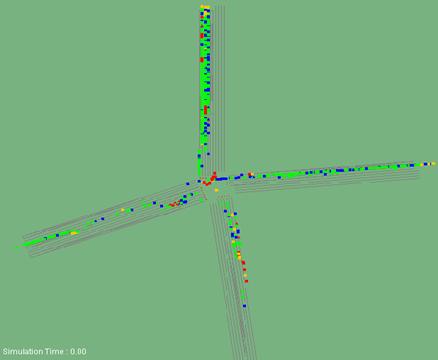
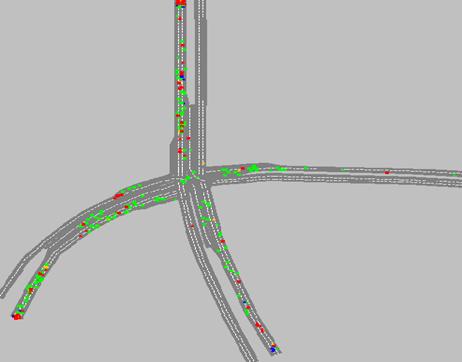
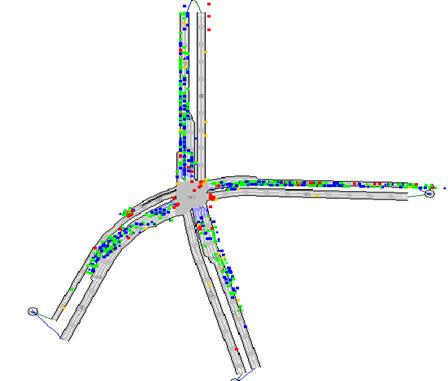
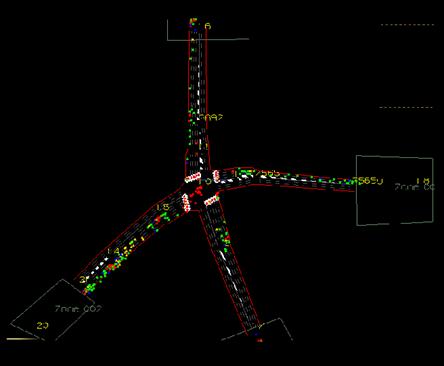
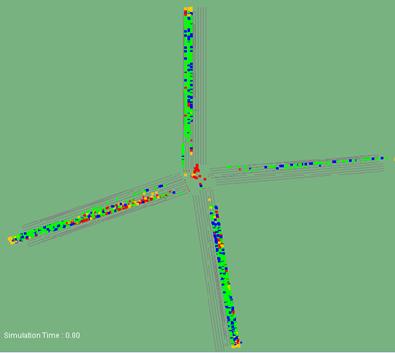
PDF files can be viewed with the Acrobat® Reader® Chapter 5. Sensitivity Analysis (Continued)Conflict layouts displayed on the map screen of SSAM are shown below. For better visualization, each figure shows only conflicts with one replication. Different types of conflicts are shown with different shapescrossing conflict with ovals, rear-end conflicts with rectangles, and lane-changing conflicts with triangles. Different colors represent different levels of severity of conflictsRed represents crashes, orange represents conflicts with 0 < TTC = 0.5, blue represents conflicts with 0.5 < TTC = 1.0, and green represents conflicts with 1.0 < TTC = 1.5. As shown in the following figures, VISSIM always generated the least conflicts among the simulation platforms, and TEXAS generated the most conflicts. When the intersection was relatively simple (less lanes, less or no left-turn/right-turn bay), most conflicts generated by VISSIM were green, which meant those conflicts fall into the category of Intersection 1: Briarcliff Rd & North Druid Hills Rd, Dekalb County, Atlanta, GA: Figure 183 through figure 186 show the conflicts layout for intersection 1 under AM peak-hour condition. Figure 187 through figure 190 show the conflicts layout for intersection 1 under mid peak-hour condition, and figure 191 through figure 194 show the conflicts layout for intersection 1 under PM peak-hour condition. The following can be seen in the figures below:
Figure 183. Screen Capture. VISSIM Conflict Layout for AM Peak Hour of Intersection 1 (Total 85).
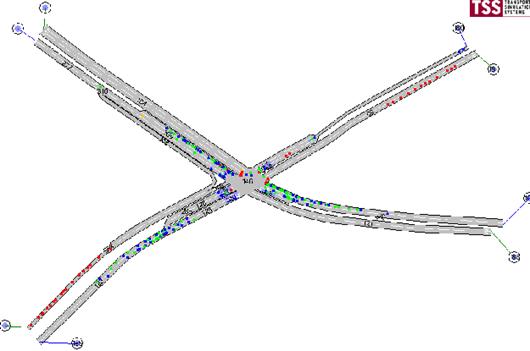
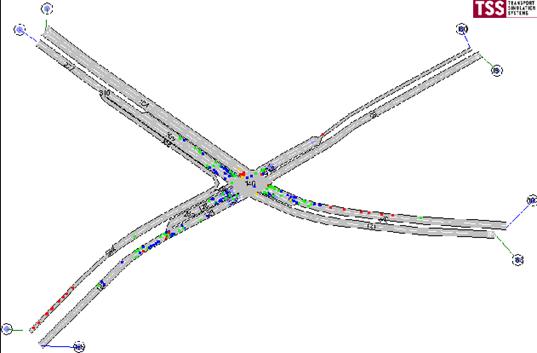
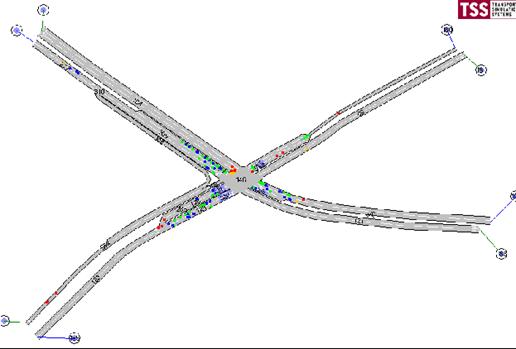
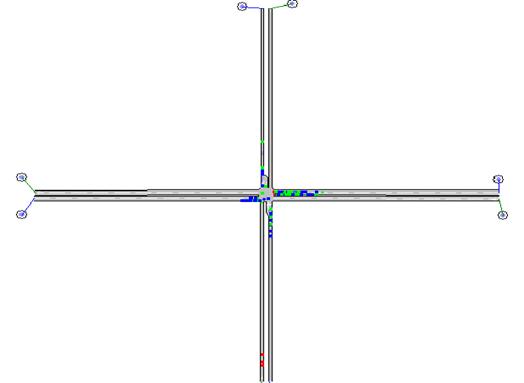
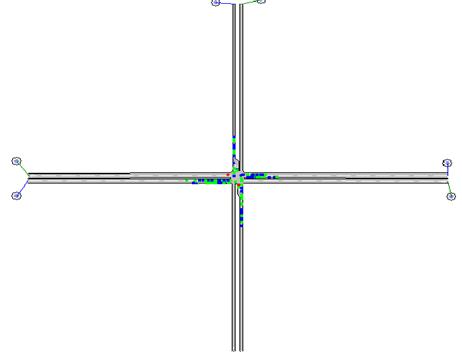
Figure 184. Screen Capture. AIMSUN Conflict Layout for AM Peak Hour of Intersection 1 (Total 271).
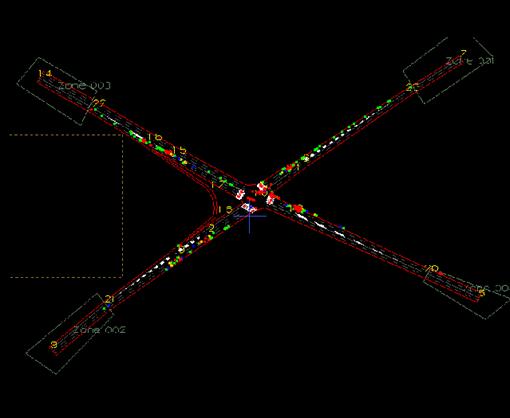
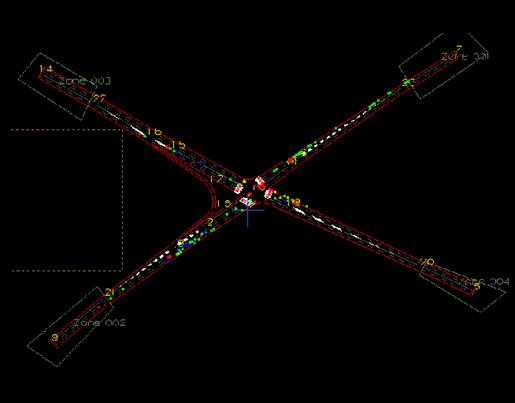
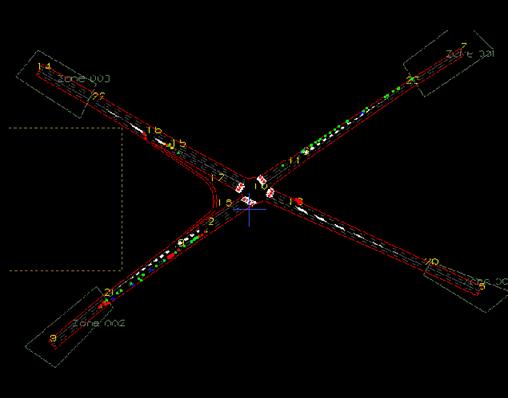
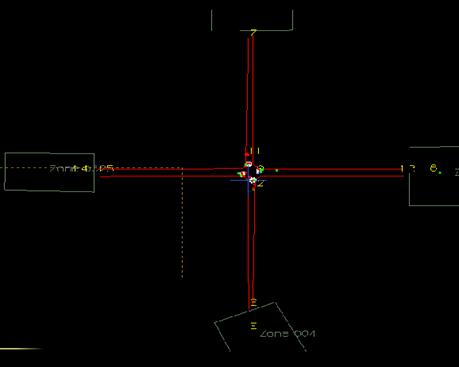
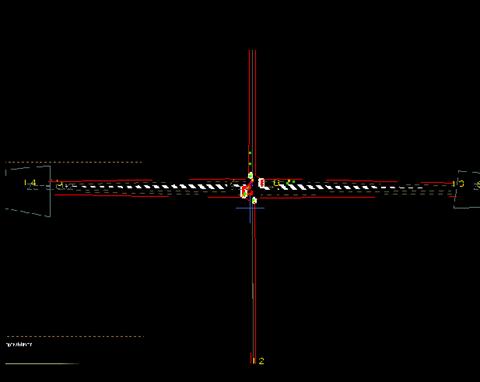
Figure 185. Screen Capture. PARAMICS Conflict Layout for AM Peak Hour of Intersection 1 (Total 427).
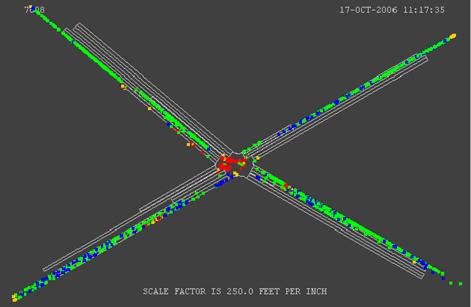
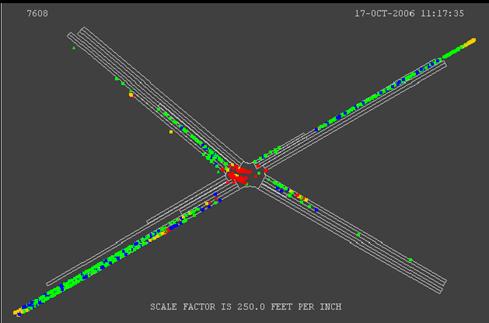
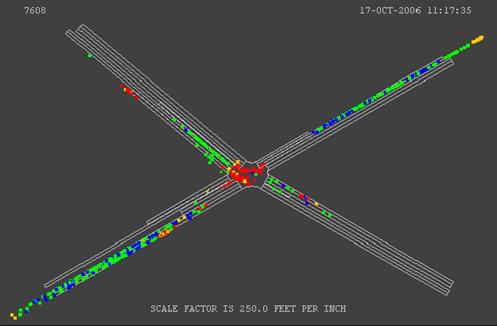
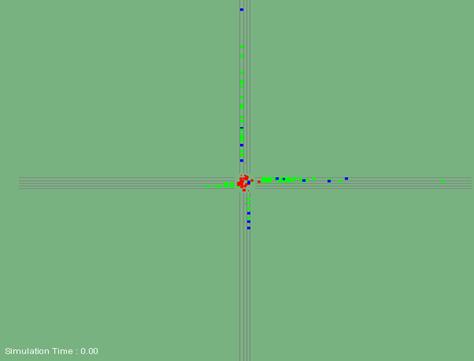
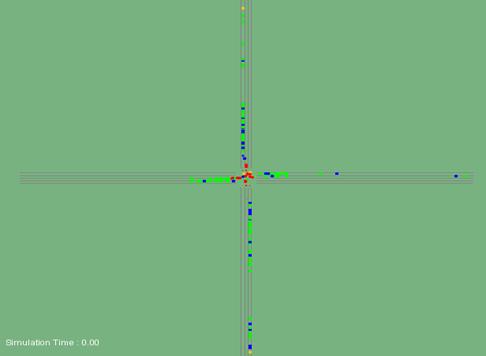
Figure 186. Screen Capture. TEXAS Conflict Layout for AM Peak Hour of Intersection 1 (Total 2,178).
Figure 187. Screen Capture. VISSIM Conflict Layout for Mid Peak Hour of Intersection 1 (Total 84).
Figure 189. Screen Capture. PARAMICS Conflict Layout for Mid Peak Hour of Intersection 1 (Total 209).
Figure 190. Screen Capture. TEXAS Conflict Layout for Mid Peak Hour of Intersection 1 (Total 1,359).
Figure 191. Screen Capture. VISSIM Conflict Layout for PM Peak Hour of Intersection 1 (Total 47).
Figure 192. Screen Capture. AIMSUN Conflict Layout for PM Peak Hour of Intersection 1 (Total 156).
Figure 193. Screen Capture. PARAMICS Conflict Layout for PM Peak Hour of Intersection 1 (Total 118).
Figure 194. Screen Capture. TEXAS Conflict Layout for PM Peak Hour of Intersection 1 (Total 878). Intersection 2: Roswell Road & Abernathy Road, Fulton County, Atlanta, GA: Figure 195 through figure 198 show the conflicts layout for intersection 2 under AM peak-hour condition. Figure 199 through figure 202 show the conflicts layout for intersection 2 under mid peak-hour condition. And figure 203 to figure 206 shows the conflicts layout for intersection 2 under PM peak-hour condition. The following can be seen in the figures below:
Figure 195. Screen Capture. VISSIM Conflict Layout for AM Peak Hour of Intersection 2 (Total 181).
Figure 196. Screen Capture. AIMSUN Conflict Layout for AM Peak Hour of Intersection 2 (Total 997).
Figure 197. Screen Capture. PARAMICS Conflict Layout for AM Peak Hour of Intersection 2 (Total 565).
Figure 198. Screen Capture. TEXAS Conflict Layout for AM Peak Hour of Intersection 2 (Total 2,242).
Figure 199. Screen Capture. VISSIM Conflict Layout for Mid Peak Hour of Intersection 2 (Total 215).
Figure 200. Screen Capture. AIMSUN Conflict Layout for Mid Peak Hour of Intersection 2 (Total 1,107).
Figure 201. Screen Capture. PARAMICS Conflict Layout for Mid Peak Hour of Intersection 2 (Total 708).
Figure 202. Screen Capture. TEXAS Conflict Layout for Mid Peak Hour of Intersection 2 (Total 5,173).
Figure 203. Screen Capture. VISSIM Conflict Layout for PM Peak Hour of Intersection 2 (Total 214).
Figure 204. Screen Capture. AIMSUN Conflict Layout for PM Peak Hour of Intersection 2 (Total 619).
Figure 205. Screen Capture. PARAMICS Conflict Layout for PM Peak Hour of Intersection 2 (Total 485).
Figure 206. Screen Capture. TEXAS Conflict Layout for PM Peak Hour of Intersection 2 (Total 4,652). Intersection 3: Lafayette Ave & Fulton Street, Grand Rapids, MI: Figure 207 through figure 210 show the conflicts layout for intersection 3 under AM peak-hour condition. Figure 211 through figure 214 show the conflicts layout for intersection 3 under PM peak-hour condition. The following can be seen in the figures below:
Figure 207. Screen Capture. VISSIM Conflict Layout for AM Peak Hour of Intersection 3 (Total 59).
Figure 208. Screen Capture. AIMSUN Conflict Layout for AM Peak Hour of Intersection 3 (Total 128).
Figure 209. Screen Capture. PARAMICS Conflict Layout for AM Peak Hour of Intersection 3 (Total 46).
Figure 210. Screen Capture. TEXAS Conflict Layout for AM Peak Hour of 7,500B (Total 138).
Figure 211. Screen Capture. VISSIM Conflict Layout for PM Peak Hour of Intersection 3 (Total 93).
Figure 212. Screen Capture. AIMSUN Conflict Layout for PM Peak Hour of Intersection 3 (Total 184).
Figure 213. Screen Capture. PARAMICS Conflict Layout for PM Peak Hour of Intersection 3 (Total 45).
Figure 214. Screen Capture. TEXAS Conflict Layout for PM Peak Hour of Intersection 3 (Total 182). Intersection 4: Ryan Ave & Davison Ave, Detroit, MI: Figure 215 through figure 218 show the conflicts layout for intersection 4 under AM peak-hour condition. Figure 219 through figure 222 shows the conflicts layout for intersection 4 under PM peak-hour condition. The following can be seen from the figures below:
Figure 215. Screen Capture. VISSIM Conflict Layout for AM Peak Hour of Intersection 4 (Total 78).
Figure 216. Screen Capture. AIMSUN Conflict Layout for AM Peak Hour of Intersection 4 (Total 143).
Figure 217. Screen Capture. PARAMICS Conflict Layout for AM Peak Hour of Intersection 4 (Total 45).
Figure 218. Screen Capture. TEXAS Conflict Layout for AM Peak Hour of Intersection 4 (Total 206).
Figure 219. Screen Capture. VISSIM Conflict Layout for PM Peak Hour of Intersection 4 (Total 104).
Figure 220. Screen Capture. AIMSUN Conflict Layout for PM Peak Hour of Intersection 4 (Total 229).
Figure 221. Screen Capture. PARAMICS Conflict Layout for PM Peak Hour of Intersection 4 (Total 111).
Figure 222. Screen Capture. TEXAS Conflict Layout for PM Peak Hour of Intersection 4 (Total 379). Intersection 5: Howe Ave & Fair Oaks Boulevard, Sacramento, CA: Figure 223 through figure 226 shows the conflicts layout for intersection 5 under AM peak-hour condition. Figure 227 to figure 230 shows the conflicts layout for intersection 5 under PM peak-hour condition. The following can be seen in the figures below:
Figure 223. Screen Capture. VISSIM Conflict Layout for AM Peak Hour of Intersection 5 (Total 185).
Figure 224. Screen Capture. AIMSUN Conflict Layout for AM Peak Hour of Intersection 5 (Total 558).
Figure 225. Screen Capture. PARAMICS Conflict Layout for AM Peak Hour of Intersection 5 (Total 352).
Figure 226. Screen Capture. TEXAS Conflict Layout for AM Peak Hour of Intersection 5 (Total 1,972).
Figure 227. Screen Capture. VISSIM Conflict Layout for PM Peak Hour of Intersection 5 (Total 301).
Figure 228. Screen Capture. AIMSUN Conflict Layout for PM Peak Hour of Intersection 5 (Total 988).
Figure 229. Screen Capture. PARAMICS Conflict Layout for PM Peak Hour of Intersection 5 (Total 389).
Figure 230. Screen Capture. TEXAS Conflict Layout for PM Peak Hour of Intersection 5 (Total 4,349). In general, the following observations can be made:
Beside number of conflicts, SSAM also extracted other surrogate safety measures, such as TTC, PET, and so on. In this section, those measures are tabulated and analyzed. Intersection 1: Briarcliff Rd & North Druid Hills Rd, Dekalb County, Atlanta, GA: Table 105 through table 108 list the surrogate safety measures generated from running the four simulation models for intersection 1. Corresponding figures provide 3-D views of the comparison for some of the measures among the four simulation models.
Figure 231. Graph. 3-D View of the Comparison on Major Surrogate Safety Measures for Intersection 1 at AM Peak. Table 106. Safety Measures Under Mid Peak Hour for Intersection 1.
Figure 232. Graph. 3-D View of the Comparison on Major Surrogate Safety Measures for Intersection 1 at Mid Peak. Table 107. Safety Measures Under PM Peak Hour for Intersection 1.
Figure 233. Graph. 3-D View of the Comparison on Major Surrogate Safety Measures for Intersection 1 at PM Peak. Intersection 2: Roswell Road & Abernathy Road, Fulton County, Atlanta, GA: Table 108 through table 110 list the surrogate safety measures generated from running the four simulation models for intersection 2. Corresponding figures provide 3-D views of the comparison for some of the measures among the four simulation models. Table 108. Safety Measures Under AM Peak Hour for Intersection 2.
Figure 234. Graph. 3-D View of the Comparison on Major Surrogate Safety Measures for Intersection 2 at AM Peak. Table 109. Safety Measures Under Mid Peak Hour for Intersection 2.
Figure 235. Graph. 3-D View of the Comparison on Major Surrogate Safety Measures for Intersection 2 at Mid Peak. Table 110. Safety Measures Under PM Peak Hour for Intersection 2.
Figure 236. Graph. 3-D View of the Comparison on Major Surrogate Safety Measures for Intersection 2 at PM Peak. Intersection 3: Lafayette Ave & Fulton Street, Grand Rapids, MI: Table 111 and table 112 list the surrogate safety measures generated from running the four simulation models for intersection 3. Corresponding figures provide 3-D views of the comparison for some of the measures among the four simulation models Table 111. Safety Measures Under AM Peak Hour for Intersection 3.
Figure 237. Graph. 3-D View of the Comparison on Major Surrogate Safety Measures for Intersection 3 at AM Peak. Table 112. Safety Measures Under PM Peak Hour for Intersection 3.
Figure 238. Graph. 3-D View of the Comparison on Major Surrogate Safety Measures for Intersection 3 at PM Peak. Intersection 4: Ryan Ave & Davison Ave, Detroit, MI: Table 113 and table 114 list the surrogate safety measures generated from running the four simulation models for intersection 4. Corresponding figures provide 3-D views of the comparison for some of the measures among the four simulation models. Table 113. Safety Measures under AM Peak Hour for Intersection 4.
Figure 239. Graph. 3-D View of the Comparison on Major Surrogate Safety Measures for Intersection 4 at AM Peak. Table 114. Safety Measures Under PM Peak Hour for Intersection 4.
Figure 240. Graph. 3-D View of the Comparison on Major Surrogate Safety Measures for Intersection 4 at PM Peak. Intersection 5: Howe Ave & Fair Oaks Boulevard, Sacramento, CA: Table 115 and table 116 list the surrogate safety measures generated from running the four simulation models for intersection 5. Corresponding figures provide 3-D views of the comparison for some of the measures among the four simulation models. Table 115. Safety Measures Under AM Peak Hour for Intersection 5.
Figure 241. Graph. 3-D View of the Comparison on Major Surrogate Safety Measures for Intersection 5 at AM Peak. Table 116. Safety Measures Under PM Peak Hour for Intersection 5.
Figure 242. Graph. 3-D View of the Comparison on Major Surrogate Safety Measures for Intersection 5 at PM Peak. In general, safety measures from VISSIM were consistently safer than those from the other three simulation platforms, while AIMSUN was the least safe among all of the simulation platforms. Some measures (TTC, PET, DeltaS, and MaxS) in VISSIM showed safer conflicts than in TEXAS, while others (DR, MaxD) showed the opposite results. There were no strong differences among these simulation platforms with all of the surrogate safety measures. MOEs from running the simulations for each intersection are recorded and tabulated, as shown in table 117 through table 121. Table 117. MOEs for Intersection 1.
Table 118. MOEs for Intersection 2.
Table 119. MOEs for Intersection 3.
Table 120. MOEs for Intersection 4.
Table 121. MOEs for Intersection 5.
In general, the performance MOE results indicated the following:
SummaryThe sensitivity analysis exercise was performed to identify differences between the SSAM-related outputs of each simulation model vendor’s system on the same traffic facility designs. Five intersections were selected for modeling from the same source as the 83 intersections used in the field validation study. As much as possible, the intersections were modeled identically in each of the four simulation systems. The goal of this exercise was not to calibrate the models to field data but rather to assess the ability of each model to produce reasonable estimates of both traditional performance MOEs (delay, throughput, average vehicle speed, etc.) and the new surrogate measures of safety developed in this project (total conflicts, average TTC, PET, etc.). The sensitivity analysis activity indicated that there was a fairly wide range of results that could be obtained from applying different simulation models to the same facility designs. In general, intersections modeled in VISSIM had the lowest total number of conflicts, and intersections modeled in TEXAS had the highest total number of conflicts occurring, with frequency of approximately 10 times higher than VISSIM. Conflict totals from AIMSUN and Paramics simulation systems fell within those two. Modifications made to the TEXAS model after this analysis is completed, as communicated to the project team by Rioux Engineering, should reduce the total numbers as well as eliminate many of the crossing crashes that occur in TEXAS. The abnormally high number of conflicts in TEXAS reflected that (somewhat paradoxically) the driver behavior modeling in TEXAS included active conflict avoidance, where the other models had a more reactive driver behavior approach to conflict avoidance. This was particularly manifested in the extreme braking/deceleration events observed in the AIMSUN and Paramics simulation systems. In all of the simulation systems, rear-end conflict events made up the bulk of the total conflicts at all levels of critical TTC (0.5s, 1.0s, and 1.5s), even after eliminating low-speed events from the analysis (i.e., vehicles interacting in queues at close-proximity TTC may be below critical threshold but no reasonable human observer would count these events as conflicts). There were no strong differences in the average values of the TTC across all of the models, although AIMSUN and Paramics did exhibit higher average values for DR and lower values for PET, indicating that vehicles in Paramics and AIMSUN drive less safely than in VISSIM or TEXAS (still considering the paradox noted above). In general, the traffic performance measures such as throughput and delay were fairly variable but vaguely comparable from all systems during relatively light traffic, but the differences in the default driving behaviors and modeling assumptions became more pronounced as reflected in these measures when congestion levels increased. In the case of high traffic input volumes (as is true in the real world as well), some of the simulation systems rapidly broke down into the congested flow regime, thus causing the average performance results to diverge significantly. All of the simulation systems exhibit modeling inaccuracies that lead SSAM to identify conflict events with TTC = 0 (crashes). The operating assumption at the beginning of this project was that none of the simulation systems would have any crashes during the simulation because the vehicles were avoiding each other at all times. In some cases, modeling inaccuracies had been explained by simulation system developers as being an artifact of the animation process but not due to the underlying driver and vehicle behavior logic. The level of nanoscopic analysis applied by SSAM revealed that this was not truethe driver and vehicle behavior logic in the simulation systems did not reflect crash avoidance under all vehicle-to-vehicle interaction scenarios. In hindsight, this is not surprising because the logical rules necessary to ensure this level of detailed crash avoidance would add additional processing burden to the systems, resulting in much poorer computational performance, particularly for traffic facility networks. It is generally assumed that very detailed collision avoidance behavior (or misbehavior) is of minor significance when simulation analysis is focused on the accurate (and perhaps only relative) assessment of measures such as throughput and delay. This study does not suggest that such measures may be inaccurate; however, the non-negligible occurrence of conspicuous and questionable behavior found in this analysis does raise some concern. These virtual crashes represent a serious issue that, as shown in the field validation study of the previous chapter, can seriously confound the ability of the models to produce justifiable metrics for safety analysis. In some simulation systems, these crashes could be filtered out by appropriate identification of the analysis area. In AIMSUN and VISSIM, crashes occur at entry and exit areas of links. It can easily be argued that these events do not represent the area of interest for safety analysis, and any maneuvering happening in these areas should be ignored. A geographic extent filter has been added to SSAM for this purpose. In the future, however, as additional analysts gain experience in using and analyzing safety with these measures, the responsibility should be shifted from the analyst to the models. The TRJ output should probably be provided starting some point significantly after the link entrance and stop significantly before the link exit. This will add processing logic to the systems that could further decrease computational performance. In some of the simulation systems, conspicuous vehicle behavior problems were not localized to areas away from the intersection that could easily be filtered out. Crashes from vehicles driving through each other should be eliminated (or at least limited to very rare events) by the simulation system vendors by adding processing logic to their models in the future. Efforts are already underway to improve TEXAS and VISSIM based on findings from SSAM analysis. However, in some cases, the user configuration plays a significant role as well. Interestingly, SSAM is useful in identifying modeling inaccuracies in each of the systems. For example, in VISSIM, the placement and orientation of connectors and links can significantly influence the occurrence of these virtual crashes. Using SSAM, the placement can be refined to remove the virtual crashes. However, in the case of lane-changing events, the logic of the simulation models must be enhanced to address these virtual crashes to enhance the credibility of safety analysis using the vendors’ tools. Additional collaborative research and development work is suggested for the future to continue to improve the safety measures from the simulation models as the technique still holds major promise. |
|||||||||||||||||||||||||||||||||||||||||||||||||||||||||||||||||||||||||||||||||||||||||||||||||||||||||||||||||||||||||||||||||||||||||||||||||||||||||||||||||||||||||||||||||||||||||||||||||||||||||||||||||||||||||||||||||||||||||||||||||||||||||||||||||||||||||||||||||||||||||||||||||||||||||||||||||||||||||||||||||||||||||||||||||||||||||||||||||||||||||||||||||||||||||||||||||||||||||||||||||||||||||||||||||||||||||||||||||||||||||||||||||||||||||||||||||||||||||||||||||||||||||||||||||||||||||||||||||||||||||||||||||||||||||||||||||||||||||||||||||||||||||||||||||||||||||||||||||||||||||||||||||||||||||||||||||||||||||||||||||||||||||||||||||||||||||||||||||||||||||||||||||||||||||||||||||||||||||||||||||||||||||||||||||||||||||||||||||||||||||||||||||||||||||||||||||||||||||||||||||||||||||||||||||||||||||||||||||||||||||||||||||||||||||||||||||||||||||||||||||||||||||||||||||||||||||||||||||||||||||||||||||||||||||||||||||||||||||||||||||||||||||||||||||||||||||||||||||||||||