U.S. Department of Transportation
Federal Highway Administration
1200 New Jersey Avenue, SE
Washington, DC 20590
202-366-4000
Federal Highway Administration Research and Technology
Coordinating, Developing, and Delivering Highway Transportation Innovations
 |
| This report is an archived publication and may contain dated technical, contact, and link information |
|
Publication Number: FHWA-HRT-08-070
Date: October 2008 |
||||||||||||||||||||||||||||||||||||||||||||||||||||||||||||||||||||||||||||||||||||||||||||||||||||||||||||||||||||||||||||||||||||||||||||||||||||||||||||||||||||||||||||||||||||||||||||||||||||||||||||||||||||||||||||||||||||||||||||||||||||||||||||||||||||||||||||||||||||||||||||||||||||||||||||||||||||||||||||||||||||||||||||||||||||||||||||||||||||||||||||||||||||||||||||||||||||||||||||||||||||||||
Test Track and Driving Simulator Evaluations of Warnings to Prevent Right-Angle Crashes at Signalized IntersectionsPDF Version (460 KB)
PDF files can be viewed with the Acrobat® Reader® FOREWORDThe Federal Highway Administration (FHWA) Office of Safety Research and Development (R&D) is focused on improving highway operations and safety by increasing the knowledge and understanding of the effects of intersection design on operational efficiency and safety. Intelligent Transportation Systems (ITS) have been shown to have both safety and operational benefits. ITS is a worldwide initiative to incorporate communications and information technology in transportation systems. This study was conducted to investigate the potential for an ITS countermeasure to reduce the number of collisions that result from red-light violations at signalized intersections. In the United States, red-light violations result in about 1,200 fatalities or incapacitating injuries each year. At intersections where it is installed, a system that detects violations as they are about to occur and then warns all drivers who are at risk of a consequent collision could reduce the frequency of this type of fatal crash by as much as 88 percent. This research examined one of the assumptions underlying the estimated 88-percent crash reduction. Michael F. Trentacoste Director Office of Safety Research and Development Notice This document is disseminated under the sponsorship of the
U.S. Department of Transportation in the interest of information exchange. The
U.S. Government assumes no liability for the use of the information contained in this document. The
U.S. Government does not endorse products or manufacturers. Trademarks or manufacturers' names appear in this report only because they are considered essential to the objective of the document. Quality Assurance Statement The Federal Highway Administration (FHWA) provides high-quality information to serve Government, industry, and the public in a manner that promotes public understanding. Standards and policies are used to ensure and maximize the quality, objectivity, utility, and integrity of its information. FHWA periodically reviews quality issues and adjusts its programs and processes to ensure continuous quality improvement. Technical Report Documentation Page
Form DOT F 1700.7 (8-72) Reproduction of completed page authorized SI* (Modern Metric) Conversion Factors Table of Contents
List of Figures
List of Tables
Executive SummaryThe two experiments reported here were conducted to evaluate the feasibility of warning drivers who are at risk of a collision with a red-light violator. There are approximately 1,200 fatalities yearly as a result of right-angle collisions between red-light violators and vehicles that have the right of way. In the first of two experiments, a driving simulator was used to assess three alternative infrastructure-based victim warning configurations against a control configuration. The second of these experiments used a test track to validate one of the warnings that was simulated in the first experiment. The warnings evaluated in the simulator were (1) a half-second amber followed by a red signal, (2) an immediate change from a green signal to a red that was supplemented by red wig-wag signals and an electronic stop sign symbol and simulated strobe lights (all mounted on the traffic signal mast arm), and (3) mast arm warnings plus the onset of simulated in-pavement red-light-emitting diodes and simulated "intelligent" rumble strips. Driver responses to the three warning conditions were compared to responses in the control condition, the onset of a 4-s amber signal. Two-hundred and two drivers participated in the study, with approximately 50 drivers in each of the four conditions. Warnings were deemed to be sufficient to prevent a collision with a red-light violator if the arrival of the participant at the intersection was delayed by at least 1 s, per the arrival time that would be expected if they continued at the speed they were traveling when the warning was initiated. Based on the 1-s delay criterion, the most conspicuous warning, which included in-pavement lights and intelligent rumble strips, theoretically prevented 67 percent of the potential collisions. That warning was more than twice as effective in preventing potential collisions as the control condition (4-s amber). A closed-road test track experiment was conducted to validate the findings from the driving simulation. The test track warning included an immediate red signal, wig-wag red lights, an electronic stop sign symbol, and strobe lights. Sixty drivers participated in the test track experiment. Half of these received the warning when 55 m (180 ft) from the intersection stop line, and half received the warning when they were 32 m (105 ft) from the intersection stop line. Ninety percent of the drivers who received the warning at 55 m (180 ft) stopped within 5 m (17 ft) of the stop line, while only one driver who received the warning at 32 m (105 ft) from the stop line stopped. The decelerations of the drivers that stopped for the warning were similar to those observed in the simulator. This study provides evidence that conspicuous infrastructure warnings might be effective in preventing collisions with red-light violators. In this study, no other vehicles were traveling either ahead or behind, and a majority of drivers braked aggressively for such a warning. However, important human factors questions remain pertaining to driver reactions to such warnings when other vehicles are ahead or behind and the effectiveness of infrastructure-based, vehicle-based, and combined infrastructure- and vehicle-based warnings. The Federal Highway Administration (FHWA) is currently conducting research to address these issues. IntroductionBackgroundAt signalized intersections, straight crossing-path crashes occur when a vehicle violates a red light and collides with a vehicle crossing from an approach that has the right-of-way. The consequences of straight crossing-path crashes at signalized intersections are serious. (1) In 2006, there were 1,197 fatalities in 1,058 collisions of this type in the United States.(2) Zimmerman and Bonneson report that the median time into the red phase of the violations that result in collisions is about 9 s. In their sample of 41 red-light violation collisions, time-into-red ranged from 0.6 to 44.2 s, with a mean of 14.1 s.(3) They suggest that the majority of red-light violation related collisions occur after queues have cleared. In this situation, both the signal violator and victim are likely to be traveling close to free-flow speed. Ferlis described an infrastructure-based Intelligent Transportation System (ITS) countermeasure for reducing straight crossing-path crashes at signalized intersections.(4) He estimated that, where deployed, this infrastructure-based warning to both the violator and victim could reduce straight crossing-path collisions by as much as 88 percent. The Ferlis estimate was based on the assumptions that 80 percent of violators would respond if warned, and 40 percent of potential victims would respond if warned. The present research tested the Ferlis assumption that 40 percent of potential victims who are warned would respond to avoid a right-angle collision. Two experiments are reported—one based in a driving simulator, and one conducted on a closed-road course. ApproachTwo experiments were designed to test the assumption that 40 percent of potential victims would respond to a red-light violation warning. The first experiment used a driving simulator to assess three alternative victim warning configurations and a control configuration. The second experiment used a closed-road course to validate one of the warnings that was simulated in the first experiment. It is recognized that red-light violators can only be reliably detected when they are relatively close to an intersection. Ferlis suggested that a violator approaching an intersection at 56 k/h (35 mi/h) could be detected about 43 m (141 ft) from an intersection.(4) Because warnings to potential victims cannot occur earlier than detection of potential violators, it is possible that potential victims might be already committed to entering the intersection. Therefore, any victim warning needs to be compelling and immediately comprehensible. The warning system envisioned by Ferlis had three major elements: (1) sensors to detect the speed of vehicles approaching a red traffic signal, (2) an algorithm to compute the likelihood of an approaching vehicle to run a red light, and (3) a warning to potential violators and their potential victims. The experiments were designed to assess the probability that selected warnings would induce potential victims to slow or stop when the warnings were presented at a point on the intersection approach where they had already committed to proceeding through an intersection without stopping, regardless of whether or not the signal remained green. Simulator ExperimentTo assess the response to an unexpected warning, it is first necessary to create an expectation that the traffic signals are operating as usual. To build that expectation in the driving simulator, participants drove through 32 intersections before they were presented a warning. Upon approach to 25 of those 32 intersections, no slowing or stopping was required in response to signals that cycled back to green well before the participants needed to slow or stop, and none changed to amber when the participant was close to the intersection. Upon approach to the remaining four intersections, the signal changed from green, but the participant always had at least 168 m (550 ft) or 8.3 s to slow or stop. Thus, previous to the 33rd intersection, participants never needed to make a rapid decision in response to traffic signals. Furthermore, at the six intersections that immediately preceded the 33rd, the light turned green before the participant vehicle was within 122 m (400 ft) of the stop line. At the 33rd intersection, when they reached a trigger distance of either 55 m (180 ft) or 66 m (215 ft), participants were presented with one of the three warnings or with a 4-s amber (the control condition). Test Track ExperimentTo build an expectation of normal phase changes in the closed-road test track experiment, participants drove through the same intersection 24 times before a warning was presented. On 20 of the 24 intersection approaches before the warning was presented, a 4-s amber was presented. Some of those phase changes occurred when the participant was less than 2 s from the stop line. On the remaining four approaches, a green signal was presented. Thus, in the simulator the intended expectation at the warning intersection was that of a green light. In contrast, in the closed road the intended expectation at the warning intersection was a high probability of a 4-s amber signal. In both the simulation and in the field, the warning should have been unexpected. Dilemma Zone BehaviorThe dilemma zone, as defined here, is the area upstream of the stop line where drivers are inconsistent in stop-and-go decisions when confronted with the onset of an amber signal. Although the primary purpose of these studies was to examine driver response to unexpected warnings at signalized intersections, the 4-s amber presentations that occurred in proximity to the intersections also provided an opportunity to examine dilemma zone behavior.(5) The test track experiment findings with respect to dilemma-zone decisionmaking may be found in separate reports by El-Shawarby et al.cit_bf(6,7,8)However, responses to amber-signal onsets are summarized briefly in the Results section of this report. Driving Simulation (Experiment 1)Driving Simulator CharacteristicsThe simulator (as configured for this experiment) consisted of a late model compact car chassis that was mounted inside of a section of a cylindrical projection screen. The cylindrical screen had a vertical radius of 2.7 m (107 inches). When looking at the center of the projections, the driver' eye point was set 20 cm (8 inches) back from the center of the cylinder. An Electrohome Marquee 9500LC projected a 1,920 by 1,200 pixel image onto the screen. The image covered the driver' forward field-of-view 88 degrees horizontally 50 degrees vertically. A Silicon Graphics Infinte Reality 2 graphics subsystem generated the images at 60 Hz. The vehicle brake, accelerator, and steering wheel inputs were routed to a Silicon Graphics ONYX2 computer that hosted a vehicle dynamics model. The vehicle dynamics model updated the virtual world on a per frame basis. Key features of the vehicle dynamics model were as follows:
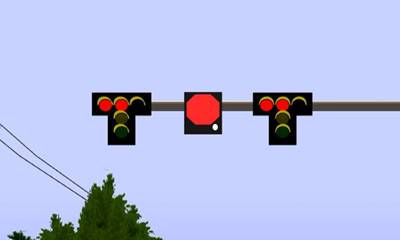
Methods—Driving SimulationConditions TestedFour signal conditions were tested in the simulator: three specially designed infrastructure-to-driver warning displays and a conventional 4-s amber phase that served as a control condition. The three potential warning displays varied in conspicuity and in the degree to which they differed from current infrastructure. Four-Second Amber (Control)The control signal condition was a 4-s amber that was initiated when the distance of the participant vehicle to the stop line became equal to or less than to a particular trigger distance. The warning trigger distance was either 55 m (180 ft) or 66 m (215 ft). The difference between control condition responses and warning condition responses was intended to provide a measure against which responses to the warnings could be compared. Condition 1This signal condition consisted of a short amber (0.5 s) followed by a red. This condition was included because it could be implemented easily at low cost by using existing infrastructure. The distinguishing feature of this warning is the early onset of the red. Although this warning alternative has the advantage of a low installation cost relative to the other warnings, it is possible that the early red onset would not be compelling enough. Also, because the red is delayed 0.5 s relative to the other warnings, it may delay braking by up to 0.5 s and thus require even more aggressive braking than the other warnings. Condition 2The second warning condition was to immediately change the signal from green to red and to supplement the red signal lenses with additional signs and lights. Added red lenses (wig-wag lights) were situated on both sides of the normal red lens alternated at 1 Hz. This was combined with a variable message sign that was scaled to be 1 m (4 ft) on a side and was positioned between two signal heads, which were aligned with the approach lanes. When this otherwise black sign was activated, a large red hexagonal stop symbol was presented, and two expanding white spots simulated strobe lights in the lower corners of the sign. The spots alternated at 2 Hz. Figure 1 depicts a driver' view of this warning.
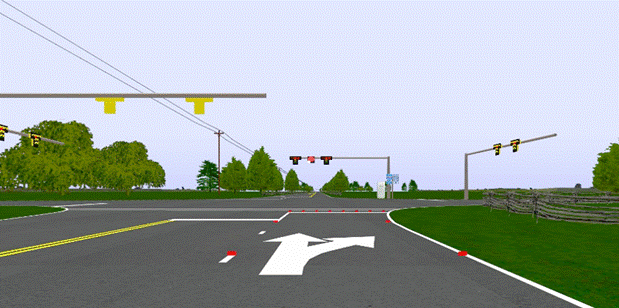
Figure 1. Illustration. Supplemental visual warning displays from the driving simulation. Condition 3The third warning condition included all the features from Condition 2, plus simulated intelligent rumble strips and simulated red light-emitting diodes (LEDs) along the lane markings. Intelligent rumble strips are devices that could be embedded in the roadway and would be detectable only when triggered by a collision warning system.(4) Intelligent rumble strips would produce the same auditory and tactile stimulation as the conventional rumble strips that are used as lane deviation and speed advisory warnings. Intelligent rumble strips were simulated by activating a 1.9-cm (0.75-inch) vertical heave of the simulator' motion base at 4 Hz for 1 s. The vertical heave resulted in both haptic and auditory stimulation that closely approximated the sensations generated by a series of four speed advisory rumble strips. Because of a programming error, the intelligent rumble strips were triggered when the participant vehicle was 61 m (200 ft) from the intersection stop line regardless of the trigger distance for the visual warnings. The simulated in-road LEDs were placed every 6 m (20 ft) along both the left- and right-lane markings of the through lane and every 60 cm (24 inches) across the intersection stop line. The simulated LEDs, are shown in figure 2.
Figure 2. Illustration. The simulated intersection with simulated in-road LEDs activated. Trigger DistancesIn addition to four signal conditions, two trigger distances were used for initiating the signal conditions: 66 m (215 ft) and 55 m (180 ft). Table 1 shows the two trigger distances and their metric equivalents. When the study began, the trigger distance for activating the warning and control conditions was 66 m (215 ft). Selection of this distance rested on an assumed perception-reaction time of 1 s and an instructed travel speed of 72 km/h (45 mi/h). Under these assumptions, a complete stop at the stop line in response to a warning would require 0.65 g of constant deceleration. It seemed reasonable to assume that no participant would attempt to stop for the amber signal given that deceleration requirement. However, the assumption proved to be wrong. Of the first 11 participants in the control (4-s amber) condition, 4 participants came to a complete stop before crossing the stop line. They were able to do this because perception-reaction times were less than 1 s and because decelerations peaked at 0.9 g (the maximum allowed by the vehicle dynamics model). Because such a high proportion of control condition participants were stopping, the trigger distance was reduced from 66 m (215 ft) to 55 m (180 ft). Assuming a 1-s response time, the 55-m (180-ft) trigger distance would require 0.85 g of constant deceleration. The warning trigger distance was 66 m (215 ft) for the first
1 ft = 0.305 m ParticipantsParticipants were licensed drivers recruited from the Washington, DC, metropolitan area. Useable data were obtained from 202 of 214 participants. Twelve participants (5.6 percent) failed to complete the experiment because of simulator sickness symptoms. There were two age groups (younger, 18 to 65 years of age; and older, 66 to 87 years of age). Age and gender were approximately balanced across the four warning conditions. ProtocolParticipants reviewed and signed an informed consent document upon arrival at the research center. They were then asked a series of questions to screen for impairment by illness, drugs, or alcohol. Vision was tested to ensure that they met or exceeded a minimum visual acuity of 20/40 in at least one eye. Next, participants were escorted to the driving simulator facility where they were asked to perform the Sharpened Romberg postural stability test and to complete the Simulator Sickness Questionnaire (SSQ).(9,10) The Sharpened Romberg and SSQ were completed before the participant entered the vehicle to provide baselines against which post-simulation health status could be assessed.
Simulated RoadwayThe simulated roadway was a contiguous series of 1.3-km (0.8-mi) segments of a straight and level two-lane rural highway. In the middle of each segment, the same intersection recurred. At this intersection, the road widened to include a dedicated left-turn lane. Although the same roadway segment recurred 33 times, the roadside scenery varied slightly from segment to segment. Bridges, guardrails, trees, and fences close to the roadway remained the same on each segment, but widely spaced buildings (e.g., churches and houses) varied between segments. Except for the absence of vertical curvature in the simulation, the roadway was modeled on US 29 and the intersection of US 29 with State Route 234 in Manassas, VA. Experimental DesignThe research design was entirely between groups with only one observation per participant. Statistical power was achieved by the use of a relatively large participant sample size rather than by repeated measurement of the same participants. The between groups design was necessitated by the assumptions underlying the study. First, it was assumed that red-light violator warnings would be rare and that any individual might experience such a warning only once or twice over a driving career. If true, an individual' response to repeated warnings would be of little or no interest. Second, it was assumed that, as with most new traffic control devices, currently licensed drivers would receive little or no information about an infrastructure-based warning device. Given these assumptions, it was deemed imperative that any red-light violator warning be intuitive and quickly comprehensible on first exposure and without the requirement of previous training or experience. As stated in the introduction, traffic signals previous to the final (warning) intersection were timed to build an expectation that the final signal would be functioning normally and would likely be green. Table 2 shows the signal functioning intended to build this expectation. Assuming a 1-s brake response time to the onset of an amber at any intersection before the 33rd, no decision to immediately brake would have required a deceleration of more than 1.8 m/s2 (5.9 ft/s2), or 0.18 g. Because deceleration rates and braking latency were under participants' control, the number of braking, stopping, and slowing events varied among participants. Based on the distance from the signal at amber onset and on the duration of the red, the table indicates the signals for which most participants came to a complete stop (one asterisk), and the signals for which no accelerator release or brake response was required to avoid braking at more than 3 m/s2 (10 ft/s2), or 0.31 g (two asterisks). At the first two intersections, the signals remained green at all times. At all other intersections, there was an amber-phase onset. However, the amber and red phases occurred when the participant was far enough from the intersection that slowing or stopping was only required at seven intersections, which are indicated by a single asterisk in table 2. At the 33rd intersection, a 4-s amber was triggered at 531 m (1,741 ft). The red phase that followed was 14 s. The light then turned green. Assuming the participant maintained 72 km/h (45 mi/h), the vehicle would have been 169 m (553 ft) from the stop line when the light turned green. Given that up to that point, the signals had changed only once when the vehicle was closer than 169 m (553 ft) and that (at the instructed speed) the vehicle was only 8 s from the stop line at green onset, it was assumed that the participant would not be anticipating another phase change at the 33rd intersection.
1 ft = 0.305 m Independent Variables Four between group variables were tested. Signal condition had four categories, and the other variables each had two categories:
Dependent Measures The dependent measures in this study were as follows:
Table 3 summarizes the experimental design and shows the number of participants within each cell.
1 ft = 0.305 m Delay in Reaching Stop Line Because the purpose of the warnings is to prevent drivers from being in the intersection when a red-light violator is crossing their path, it is critical that the warning delay their arrival to the intersection until the threat has passed. To evaluate warning effectiveness, a violator was assumed to be traveling at the same speed as the participant and to have been detected at the warning trigger distance (i.e., either 66 m (215 ft) or 55 m (180 ft)). Thus, if both vehicles proceeded at the same speed they were traveling when the violator was detected, then they would collide in the intersection. To allow some leeway for variation from the assumed scenario, a minimum of 1-s arrival delay of the potential victim (participant driver) was deemed to represent a success. If the violator continued at 72.5 km/h (45 mi/h), a 1-s delay in arrival of the participant would result in the participant passing 20 m (66 ft) behind the violator. The delay in arrival was calculated from each participant's actual speed, rather than the instructed speed. The amount of delay in seconds was then converted to a binary variable: 0 if less than 1 s, 1 if equal to or greater than 1 s. Initial Speed Although the delay in reaching stop line variable was calculated based on initial speed, the decision to delay or continue at the current speed could be influenced by the driver' speed when the warning is initiated. Because the warning was triggered based on distance, not time to intersection, lower speeds would allow lower deceleration rates, longer response times, or both. Therefore, initial speed was analyzed for possible influences on the other results. Accelerator Release Time Accelerator release time was measured because it provides the first available indication that the warning stimulus has been detected. Accelerator release time is sometimes referred to as perception time.(10) Brake Response Time Brake response time is the most frequently used measure of driver latency to react to the onset of amber signals. In the traffic engineering literature, brake response time is often referred to as perception-reaction time.(12) In field studies, brake response time is often measured from the onset of an amber signal to the onset of the vehicle brake lights (e.g., Wortman and Matthias, 1983; and Gates et al., 2007).(5) However, in this study, the beginning of brake pedal deflection is used as the terminator for brake response time. Maximum Deceleration Maximum deceleration was measured to suggest the intensity of the braking that followed the brake responses to the signal conditions. It was the largest frame-to-frame deceleration that was recorded between the onset of the amber/warning signal and crossing the stop line. It was only recorded for participants for whom a brake response time was recorded. Results—Driving SimulationDelay in Reaching Stop LineThe primary measure of a collision warning' effectiveness is whether or not a collision is avoided. The hypothetical threat for which the signal conditions were triggered was a red-light violator who approached the intersection on the cross street. A 1 s or greater delay of the participant in reaching the intersection, based on the participant' speed when the warning was initiated, was counted as an avoided collision.
A logit model was used to analyze the delay results. A logit analysis was used because the independent variables were classification variables and the dependent variable (delay) was binary. Although logit analysis is similar to the more familiar analysis of variance in that it includes both main effects and interactions, it differs in the way statistical significance is evaluated. Rather than providing statistical significance for each effect, the model as a whole is evaluated, with effects dropped from the model until the model no longer accounts for the observed variability. In a logit analysis, the best fitting model is the most parsimonious model for which the goodness-of-fit does not differ significantly from the full model.(13,14) That is, variables and interactions are dropped from the model until a model with the fewest variables that still enables reconstruction of the obtained pattern of results is identified. The dependent measure was the 1-s delay (yes or no). The independent variables in the full (saturated) logit model were age, gender, signal condition, trigger distance, and all interactions of these variables. The final model included signal condition, age, trigger distance, and the interaction of trigger distance with signal condition. Table 4 shows the results as a function of the variables in the best fitting model. Older drivers were more likely to be delayed regardless of trigger distance or warning condition.
1 ft = 0.305 m However, it is wrong to infer the greater effectiveness of the warning with older adults is directly attributable to age. As reported below, older adults were, on average, traveling slower when the warnings came on. Initial speed can also predict delay outcome. Indeed, when initial speed is entered as a covariate in the logit model, age and the interaction of trigger distance with signal condition can be dropped from the model with no significant loss in prediction. Table 5 shows the percent of participants delayed as a function of the two variables that remained significant after accounting for initial speed—signal condition and trigger distance. The warning treatments were more effective at 66 m (215 ft) than at 55 m (180 ft). The greater the conspicuity of the warning, the greater the proportion of participants who delayed.
1 ft = 0.305 m Table 6 shows the percentage of participants delayed without regard to trigger distance.
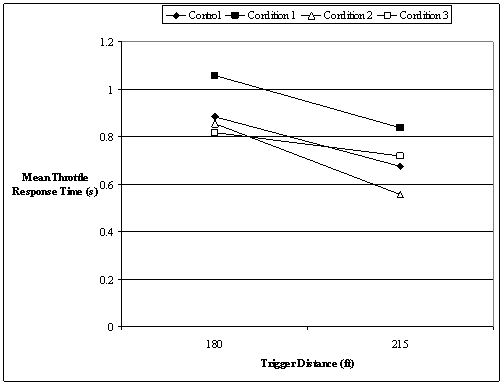
Initial SpeedAmong the younger adults, the instruction to maintain 72 km/h (45 mi/h) was successful. At the beginning of the final phase change event (i.e., onset of the warning or amber signal), the mean speed of the younger adult groups was 71.5 km/h (44.4 mi/h) with a standard deviation of 6.6 km/h (4.1 mi/h). The older adults tended to drive below the instructed speed. They had a mean speed at the beginning of the final phase change event of 66.8 km/h (41.5 mi/h) with a standard deviation of 7.4 km/h (4.6 mi/h). Initial speed was not significantly related to any of the other independent variables (all p > 0.17). Accelerator Release Response TimeOf the 202 participants, 156 responded with accelerator releases between the onset of the warning/amber phase and arrival at the stop line. Of these 156 accelerator releases, 4 response times were deemed to be outliers and excluded from further analyses. There were no outliers with extreme short responses. Long response outliers were identified as responses that were more than 2 s. Those responses were more than 1.5 times the interquartile range from the upper edge of that range. The interquartile range is defined as the distance between the 25th-percentile response time and the 75th-percentile response time. Of the four response times deemed outliers, one came from an older adult and three came from younger adults. Assuming a 72 km/h (45 mi/h) approach speed, 2 s after the onset of the warning participants would have been 25 m (83 ft) or 15 m (48 ft) from the stop line, depending on whether the trigger distance was 66 m (215 ft) or 55 m (180 ft), respectively. A full factorial analysis of variance was conducted on the 152 remaining accelerator release times. Signal condition, age group, gender, and trigger distance were the independent variables. The significant main effects are represented in figure 3 where it can be seen that responses at the 66-m (215-ft) trigger distance were faster than at the 55-m (180-ft) trigger distance,F (1, 120) = 3.7, p < 0.05, and that responses to the 0.5-s amber were longer than to the other conditions, F (3, 120) = 12.7, p < 0.01.
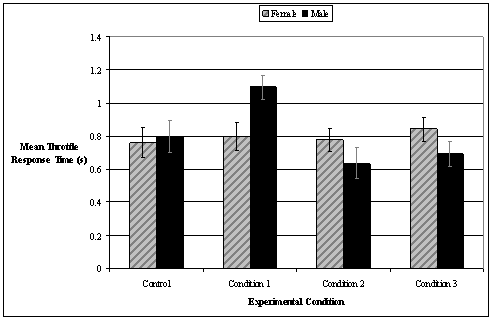
1 ft = 0.305 m Figure 3. Line graph. Mean accelerator release times as a function of experimental condition and distance at which the phase change was triggered. Although the warning condition effect was significant, it was solely attributable to the male drivers. As seen in figure 4, gender and experimental condition interacted, F (3, 120) = 3.9,p < 0.05, such that females showed almost no difference in response time across the four warning conditions.
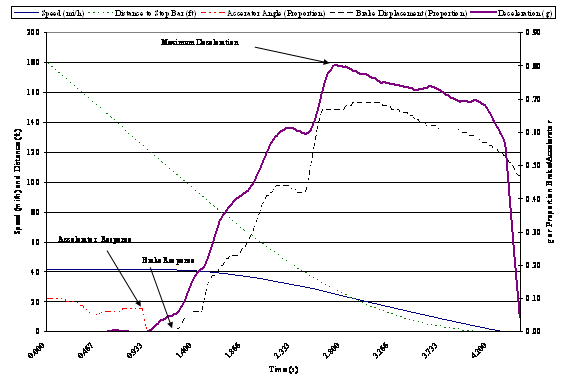
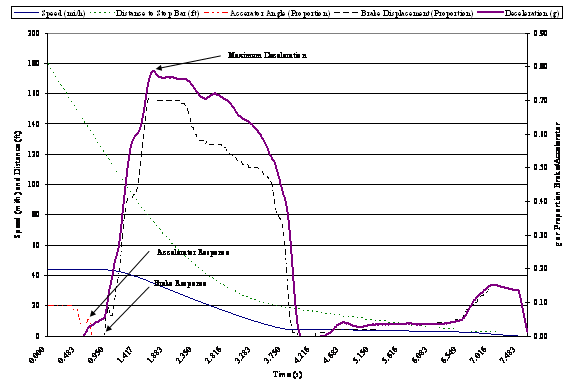
Figure 4. Bar graph. Gender by condition interaction in accelerator release time. The above accelerator release times were not conditional on whether the participant subsequently braked or came to a stop. When only the accelerator releases of participants who subsequently were delayed by at least 1 s are considered, then the results are quite different. In the case of these 86 participants, the only significant factor was age, F (1, 56) = 7.1, p < 0.05, where drivers in the older group began their accelerator release an average of 0.16 s later than drivers in the younger group. Brake Application Response TimeInitial analyses of the brake response times indicated a number of outliers, as defined in the preceding section. Exclusion of participants with brake response times greater than 2.2 s or less than 0.3 s reduced the sample of brake response times from 167 to 159. A full factorial analysis of variance that included condition, age group, trigger distance, and gender as variables indicated there were no statistically reliable effects. Analysis of variance that included only signal condition as a variable also failed to reveal any effects to be significant at the 0.05 level. Overall, the mean brake response time was 1.21 s with a standard error of 0.02 s. Maximum DecelerationParticipants who were delayed in reaching the stop line by at least 1 s had a mean for maximum deceleration of 0.78 g (standard error = 0.01). Figure 5 and figure 6 show plots of the deceleration and braking behavior of two participants from Condition 3 who responded by stopping following the warning triggered at 55 m (180 ft) from the stop line. The top panel shows data from a 19-year-old participant who appeared to hesitate before releasing the accelerator and hesitated again before exerting near maximum braking force. The lower panel shows data from a 66-year-old participant who showed less hesitation in exerting maximum braking and then coasted to the stop line. Time (s)
1 ft = 0.305 m Figure 5. Line graph. Example 1 of data from Condition 3 participants who responded by stopping. Time (s)
1 ft = 0.305 m Figure 6. Line graph. Example 2 of data from Condition 3 participants who responded by stopping. Studies that measure deceleration from film or video usually report the deceleration rate as the change in velocity from when the brakes lights illuminate until the vehicle stops. This is a different measure than the maximum deceleration, which is reported in the previous figures. For comparison with studies that report deceleration rate, a comparable measure was computed for the Condition 3 participants who were delayed by 1 s or more. This measure covered the interval between when the brake response began until the participant either: (1) crossed the stop line, Discussion—Driving SimulationThe present finding that 92 percent (Condition 3, trigger distance 66 m (215 ft)) of potential victims could be delayed (using the Ferlis assumption that 80 percent of potential violators might be stopped by a warning) suggests the estimated number of collisions resulting from red light violations that could be prevented could rise to 99 percent. Of course a 90-percent success rate may be optimistic. However, if only 59 percent of potential victims responded, as was the case for Condition 3 with a 55-m (180-ft) trigger distance, and only 50 percent of violators could be stopped, then the combined crash reduction due to victim and violator responses would still be a substantial 80 percent. Test track (Experiment 2)Experiment 2 was conducted to validate the following findings from the driving simulation:
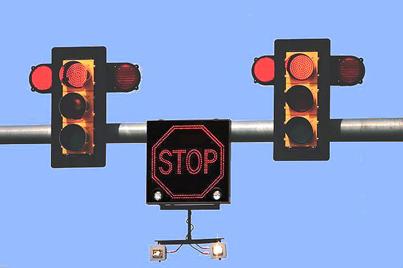
Methods—Test trackThe test track experiment was conducted on the Virginia Smart Road at the Virginia Tech Transportation Institute. A late-model passenger car was used, and the road was closed to traffic. The violator warning closely resembled the mast arm warning stimulus used in the driving simulation. It incorporated an immediate change from green to red, alternating flashing red beacons on either side of the solid red lens, a changeable message sign with stop symbol, and strobe lights that alternated at 2 Hz. The test track warning did not include intelligent rumble strips because that technology does not yet exist, and it did not include in-roadway LEDs because of cost. Conditions TestedOnly one warning condition was tested, and this condition was similar to Condition 2 in the driving simulation. The mast arm warning used on the test track is shown in figure 7. It varied from the simulator mast arm in that the solid red stop symbol was replaced with an octagonal red outline that enclosed the word "STOP," and brighter strobes were suspended below the sign. The strobe lights within the changeable message sign that can be seen in figure 7 were disconnected and did not flash.
Trigger DistancesTwo warning trigger distances were used for the driving simulation, one at a 32-m (105-ft) distance and the other at a 55-m (180-ft) distance. The 32-m (105-ft) distance was selected as a distance at which stopping responses would be improbable but still close enough that drivers might attempt to brake in response. Table 7 shows the time to the stop line from 32 m (105 ft) and 55 m (180 ft), given a 72 km/h (45 mi/h) approach speed. It also shows the constant deceleration that would be required given a 1-s delay for driver reaction time and brake system response lag.
1 ft = 0.305 m ParticipantsParticipants were licensed drivers recruited from the Virginia Tech participant database, by word-of-mouth, and through advertisements in a local Blacksburg, VA, newspaper. Participants were randomly assigned to warning distance groups with the constraint that roughly equal numbers of younger and older males and females were assigned to each group. The younger group consisted of 32 persons, with a mean age of 40 years and a range of 20 to 64 years. The older group had a mean age of 71 years, with a range of 65 to 82 years. Table 8 shows the demographic distribution of the participants among conditions.
1 ft = 0.305 m ProtocolParticipants were told that the experiment was an evaluation of signal timing. They were not told that an emergency warning would be presented or that the research concerned red light running. They were instructed to maintain a speed of 72 km/h (45 mi/h) except when turning around or responding to the traffic signal. They traveled through the intersection 12 times in each direction before the warning was issued on the 25th approach. The instructions to participants were as follows:
In the test track experiment, the amber was triggered at distances relatively near to the stop line on 20 of the first 24 approaches to the traffic signal. Each approach was considered to be a trial. The 4-s amber was triggered four times at each of five distances, where distance was measured between the front of the vehicle and the stop line. On only four test track trials did the signal remain green. Table 9 shows the five amber trigger distances and their metric equivalents. The order of trials with the various approach distance triggers was randomized separately for each participant, except the emergency warning, which was always on the 25th trail. Each trial condition except the warning was presented twice on upgrade legs and twice on downgrade legs. The emergency warning trial always occurred on the upgrade.
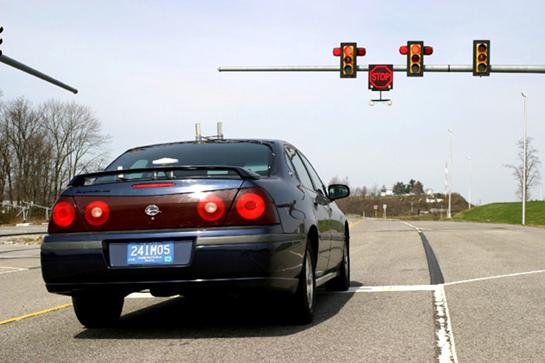
1 ft = 0.305 m On the 25th trial, half the participants were warned at 55 m (180 ft) from the intersection, and half were warned at 32 m (105 ft). One concern for use of infrastructure to warn potential victims of red-light violators is that drivers who are close enough to the intersection to pass through before the violator arrives might be slowed by the warning and then become a victim because of their response to the warning. This concern has led to the suggestion that the warning be designed to be visible only to the drivers who need to be warned.(4) The 32-m (105-ft) warning distance was included to test whether or not it might be so close that no driver would respond. Table 7 shows the time to stop line from 32 m (105 ft) and 55 m (180 ft) given a 73-km/h (45‑mi/h) approach speed. It also shows the constant deceleration that would be required given a 1-s delay for driver reaction time and brake system response lag. Under the test conditions on the Smart Road, the test vehicle' antilock braking system limited deceleration to about 0.89 g. With hard deceleration, a stop is possible in response to a warning from 55 m (180 ft), but stopping for a warning from 32 m (105 ft) would seem improbable. If drivers in this study brake hard for the warning that is triggered at 32 m (105 ft), this would indicate that the design of a violator warning device would need to consider which drivers can see the warning. If drivers do not respond to the warning that is triggered at 32 m (105 ft), this would imply that shielding the warning from those for whom it is not intended might not be critical. Participants were tested individually under good driving conditions (daylight, dry pavement, etc.). Before the first trial, each participant drove down the Smart Road to its end (2.7 km (1.7 mi)). During that drive, participants were asked to accelerate and brake several times to familiarize themselves with the vehicle' handling and braking characteristics. Before the first experimental trial began, participants were required to brake "as hard as you can" from a speed of 72 km/h (45 mi/h). This request was repeated until the participant decelerated to a minimum of 0.45 g. Two experimenters were present in the car with participant drivers. The experimenter in the front passenger seat served as a safety observer and was also tasked with providing instructions and answering questions from the participant. The other experimenter sat behind the participant and monitored the on-board computer. The on-board computer was used to send trial information to the traffic controller and to monitor sensor outputs. Test RoadAs configured for this test, the Virginia Smart Road had two lanes (one in each direction) and one signalized intersection. Participants drove a 1.6-km (1-mi) approach to the intersection followed by a 0.5-km (0.3-mi) leg to a high-speed turnaround and another 0.5-km (0.3-mi) approach. The road had a 3-percent grade. Because participants turned around at the end of each run, half the trials were on a 3-percent upgrade and half were on a 3-percent downgrade. The Virginia Smart Road intersection is pictured in figure 8.
Figure 8. Photo. Virginia Smart Road intersection and the vehicle used for testing. Test VehicleA 2004 Chevrolet Impala equipped with a differential global position system receiver, a longitudinal accelerometer, and sensors for accelerator position and brake pressure was used for the test. The vehicle data stream was synchronized with changes in the traffic signal controller via a wireless 802.11 communications link. Accelerator and brake position were recorded at 100 Hz, and all other sensor and vehicle data were recorded at 10 Hz. Results—Test trackDependent variables were the same as in the simulator experiment: initial speed, delay, accelerator release time, and brake response time. Initial SpeedAmber SignalUnlike the simulation study, initial speed did not vary between age groups. Overall, the mean initial speed was 73.7 km/h (45.8 mi/h). Females approached the intersections more slowly than males, F (1, 56) = 5.0, p < 0.05. The mean approach speed of females was 73.4 km/h (45.6 mi/h), and for males it was 74.5 km/h (46.3 mi/h). This small, but statistically reliable gender difference in mean approach speed, was the result of females slowing more as they got closer to the intersections, whereas the males generally maintained the same (higher) speed until the signal change was triggered. The interaction of gender with the linear trend in speed was significant, F (1, 56) = 7.5, p < 0.01. The gender by linear trend interaction can be seen in figure 9. Error bars in figure 9 represent two standard errors of the mean. On average, males accelerated slightly between 55 m (180 ft) and 32 m (105 ft); their speed at 32 m (105 ft) was significantly faster than at 55 m (180 ft), F ( 1, 29) = 5.4, p < 0.05.
1 mi/h = 1.61 km/h Figure 9. Line graph. Mean speed at the onset of the amber signals as a function of gender and amber trigger distance. Warning Signal Mean speed when the warning was triggered was 72.3 km/h (44.9 mi/h) and did not vary significantly as a function of age, gender, or warning onset distance. Although the same gender by trigger distance trend appeared in the warning response initial speeds (females' mean speed was less at 32 m (105 ft) than at 55 m (180 ft), whereas males' mean speed was the same at both distances), in this case the interaction was not statistically reliable (p = 0.09). Delay with 4-s AmberThe driver responses to the amber signals on their first 24 passes through the intersection have been extensively reported elsewhere. (See references 6, 7, 8, and 17.) This report is not intended to repeat those reports but rather is focused on the proportion of drivers delayed by 1 s or more by the onset of the amber signals. However, because all drivers who were delayed by 1 s or more also came to a full stop, the likelihood of stopping is reported. This likelihood of stopping may be compared to the likelihood of delay in the control condition of the driving simulation. No trends were identified in the likelihood of participants stopping as a function of the number of previous passes through the intersection. Participants stopped for 55 percent of the 4-s ambers that were triggered at 55 m (180 ft). Participants were more likely to stop for the 55-m (180-ft) amber onset in the test track experiment than in the simulation,
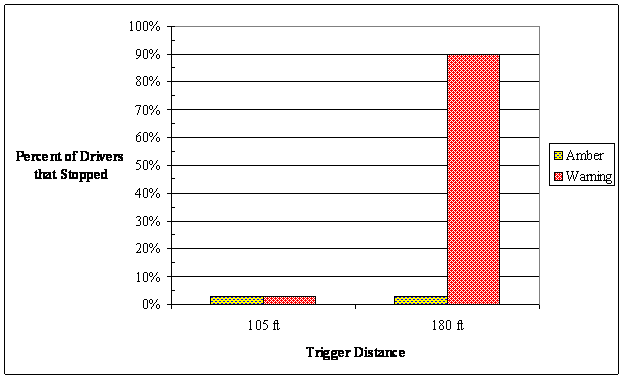
1 ft = 0.305 m Delay Attributable to WarningWhen the warning was triggered at 55 m (180 ft), 27 of the 30 participants (90 percent) stopped and thus were delayed by more than 1 s. Of the three who did not stop, one was an older female (age 68), one a younger male (aged 20), and one an older male (aged 73). When the warning was triggered at 32 m (105 ft), 29 of the 30 participants (97 percent) did not stop and were not delayed by 1 s or more. The participant who stopped for the warning that was triggered at 32 m (105 ft) was a 72-year-old female. Of participants who stopped at either warning trigger distance, none went more than 5.2 m (17 ft) beyond the stop line. Figure 10 shows a comparison of the percentage of drivers who stopped for the amber warnings that were triggered at 32 m (105 ft) and 55 m (180 ft), with the percentage of drivers who stopped when the warning was triggered at these distances. As can be seen in the figure, there was no difference between responses to amber onset and warning onset at 32 m (105 ft), but the warning at 55 m (180 ft) was effective.
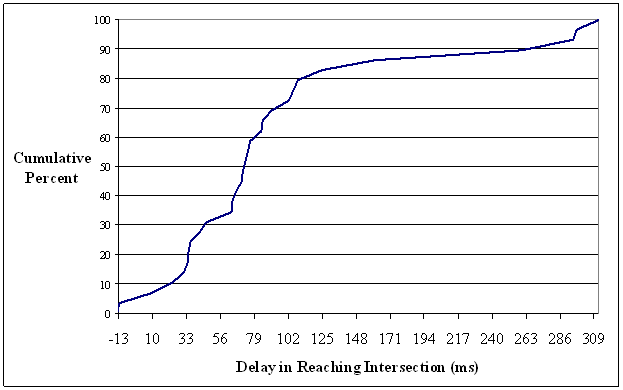
1 ft = 0.305 m Figure 10. Bar graph. The percent of drivers in the test track experiment who stopped in response to amber and warning onsets at 32 m (105 ft) and 55 m (180 ft). Based on the initial speed, none of the 29 drivers who received the warning at 32 m (105 ft) and did not stop were delayed more than 312 ms. Figure 11 shows that 85 percent of the delays of those who did not stop were less than 150 ms.
Figure 11. Line graph. Cumulative percent of driver delays in reaching the stop line when the warning was triggered at 32 m (105 ft) (n = 29). Accelerator Release Response TimeAccelerator release response time was the interval between the onset of the amber signal and when the participant began decreasing accelerator position, with the constraint that the accelerator position continued to zero without reversal. If the accelerator was not depressed when the signal changed, which was a frequent occurrence on the downgrade, no response time was available. Only three accelerator releases were recorded following the onset of amber signals with the 32 m (105 ft) trigger distance with the mean equal to 318 ms; therefore, that distance is omitted from figure 12 where mean accelerator release times following amber signal onset are summarized. Error bars represent the one standard error of the mean. The means were computed without regard to participants, and the number of responses contributing to each mean varied between 17 and 30. Larger standard errors are the result of smaller samples. It can be seen in figure 12 that, at the shorter trigger distances, the accelerator release averaged about 350 ms. At longer distances on the upgrade, participants' response times were longer. Distance from Stop Line (ft)
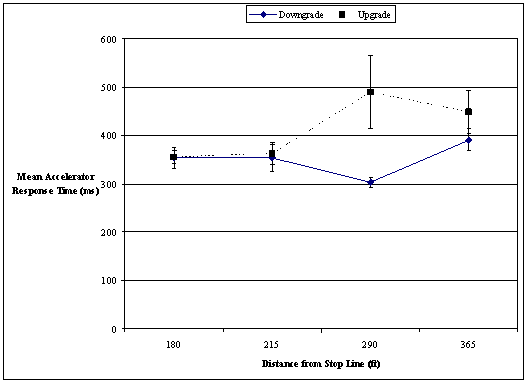
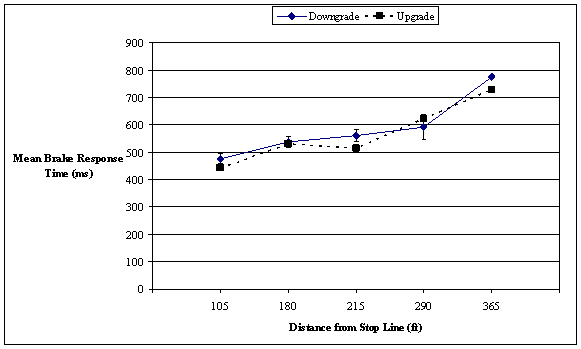
1 ft = 0.305 m Figure 12. Line graph. Mean accelerator release times to amber onset are shown as a function of grade and trigger distance. Brake Application Response TimeAs for the driving simulation, brake application response time was the interval between the onset of the amber phase and the beginning of a brake application. Because not all participants braked at all distances and because participants may have been applying the brake when the amber began, the number of participants contributing to the brake response times shown in figure 13 varied from 3 at 32 m (105 ft) to 57 at 88 m (290 ft). The standard error of the mean is shown for downgrade response times. Standard errors on the upgrade were of similar magnitude, except for a larger error at the shortest onset distance. Response times tended to increase with distance.
1 ft = 0.305 m Figure 13. Line graph. Mean brake response time as a function of amber trigger distance and grade. Maximum DecelerationThe average peak deceleration for the 27 participants that stopped for the warning at 55 m (180 ) was 0.67 g. This is 0.1 g less than the maximum deceleration average for the simulation study. Discussion—Test TrackThe test track results confirmed the findings from the driving simulation that drivers would decelerate rapidly for a conspicuous and novel infrastructure based warning. The finding that 90 percent of test track drivers brought the vehicle to a complete stop within 4.6-m (15-ft) downstream of the stop line when the warning was triggered at 55-m (180-ft) upstream suggests that the hard braking observed in the driving simulation was not an artifact of the artificial simulation environment. The willingness of participants on the test track to exert near maximum braking demonstrates that the lack of physical deceleration forces in the simulation does not explain the hard braking observed in the simulation. When the warning was triggered at 32 m (105 ft) from the stop line on the test track, 29 of 30 drivers did not stop or slow significantly. The one driver who did stop when warned at this distance was delayed by more than 1 s and thus would not have been put at risk of collision with a red-light violator who did not slow down. This finding suggests that it may not be necessary to mask warnings from the view of drivers that are too close to an intersection to respond. However, the possibility remains that there may be an intermediate zone where drivers are less consistent in their stop versus go behavior. Therefore, the need to mask the warning from drivers for whom the warning is not intended deserves further research. Brake and accelerator release times on the test track were shorter than those observed in the simulator. The significance of this difference is discussed in the next section of this report. General Discussion—Driving Simulation and Test trackThe purpose of the simulation and test track studies was to evaluate the feasibility of warning potential victims of red-light violators. The results of the simulation study suggest that more than half of drivers would respond appropriately to an unexpected and unfamiliar warning if that warning were sufficiently conspicuous and distinct from a normal phase change. Although the simulator results are encouraging, many questions remain. Because the decelerations observed in the simulation were severe, one of those questions is whether or not drivers of actual vehicles on a real road would be willing to decelerate as severely to such a warning. To address the question of how drivers would behave on an actual roadway, one of the simulation conditions was replicated on a closed roadway. The results of that replication validate the simulation. Participants on the test track braked almost as severely as those in the simulation. The slightly greater 0.1-g deceleration that was observed in the simulation was probably attributable to the test track study participants' superior ability to modulate their approach to the stop line because of the better distance cues provided by the realworld environment. In the simulator, participants frequently stopped or approached zero speed far short of the stop line—as much as 15-m (50-ft) upstream of the stop line. Such behavior was not observed in the field where most participants modulated the deceleration to come to rest within ± 0.9 m (±3 ft) of the stop line. Although 90 percent of the drivers stopped for the warning on the test track and only 64 percent stopped in the simulator (with warnings triggered at either 55 m (180) ft or 66 (215 ft)), the available evidence does not indicate which of these percentages is closer to what might be expected in an operational environment. However, there are some clues in the data. The accelerator and brake response time means from the test track experiment are close to those Olson and Sivak reported for "anticipated" stimuli.(12) This suggests that the events that led up to the emergency warning led participants to anticipate a stopping response. Before the warning, participants had driven through the intersection 24 times and had been presented with amber phase changes 20 times. Thus, although it is unlikely that participants anticipated the warning, they may well have anticipated an amber phase change, and many had stopped for amber onsets at the 55-m (180-ft) and 66-m (215-ft) trigger distances. This anticipation does not invalidate the test track findings, but it does raise the possibility that with fewer amber signals near the dilemma zone boundary, the test track findings might have been more similar to the "surprise" reaction times reported by Olson and Sivak.(10) The simulation accelerator and brake response times closely approximate those reported by Olson and Sivak in their "surprise" condition. Conclusions and Recommendations for Further ResearchThe results of these experiments show that drivers are likely to respond appropriately by stopping or slowing for an infrastructure-based warning that they have not previously experienced. However, before recommending that such an infrastructure-based warning system be deployed, several other questions need to be answered. First among these is the effect of the presence of other vehicles. In both of these studies, other vehicles were absent, and now that there is evidence that drivers will respond to warnings in the absence of other vehicles, it is necessary to determine what drivers would do in a stream of vehicles approaching an intersection. In particular, the following questions should be considered:
Although any rear-end collision that might result from a warning would likely be less severe than a side-impact collision with a red-light violator, further development of the warn-the-victim concept includes a need to examine and quantify the potential for rear-end collisions that may result from signal violation warnings. Research to address remaining questions concerning red-light violation warnings is currently being conducted by the FHWA. References
|
||||||||||||||||||||||||||||||||||||||||||||||||||||||||||||||||||||||||||||||||||||||||||||||||||||||||||||||||||||||||||||||||||||||||||||||||||||||||||||||||||||||||||||||||||||||||||||||||||||||||||||||||||||||||||||||||||||||||||||||||||||||||||||||||||||||||||||||||||||||||||||||||||||||||||||||||||||||||||||||||||||||||||||||||||||||||||||||||||||||||||||||||||||||||||||||||||||||||||||||||||||||||