U.S. Department of Transportation
Federal Highway Administration
1200 New Jersey Avenue, SE
Washington, DC 20590
202-366-4000
Federal Highway Administration Research and Technology
Coordinating, Developing, and Delivering Highway Transportation Innovations
 |
| This report is an archived publication and may contain dated technical, contact, and link information |
|
Publication Number: FHWA-HRT-10-024
Date:April 2010 |
Development of a Speeding-Related Crash TypologyPDF Version (1.53 MB)
PDF files can be viewed with the Acrobat® Reader®
RESULTS OF CART ANALYSES
The following sections present the results of the previously described CART analyses. Since the focus of this effort is national, detailed results will be presented for FARS and GES analyses. Recall that CART analyses on crash–based variables and vehicle–/driver–based variables were separate analyses producing separate trees. In each case, a figure presenting selected branches (the high SR branches) are presented followed by a discussion of the findings.
FATAL FARS SR CRASHESTOTAL GES SR CRASHESNORTH CAROLINA AND OHIO SR CRASHESNorth Carolina Crash-Based CART Results SUMMARY CONCLUSIONS ON CRASH-RELATED CART ANALYSESFATAL FARS SR VEHICLES/DRIVERSTOTAL GES SR VEHICLES/DRIVERS
FATAL FARS SR CRASHESFigure 2 presents the results of the CART analysis of crash–related variables in the FARS database.
Figure 2. Chart. CART SR output for 2005 FARS crashes. The most important SR predictive variable shown at the top tree branch labeled is first harmful event. The categories with the highest percentage of SR crashes include rollovers/overturns, jackknife crashes, and collisions with various fixed objects on the roadside. Within that branch, the most important variable is roadway alignment, with the highest SR category being curves. Within that category, the next variable is speed limit, with the highest SR categories being the lower speed limit of 20–45 mi/h. CART did not detect a fourth–level variable branching off of speed limit. In this selected subsample, approximately 60 percent of the crashes are SR. In general, this tree indicates that run–off–road collisions on curves that are found on roads with lower speed limits are more likely to be SR. Note that this final subcategory includes approximately 1,300 of the 26,000 fatal crash analyzed in this training set–approximately 5 percent of the total fatal crashes and 16 percent of the total SR fatal crashes.
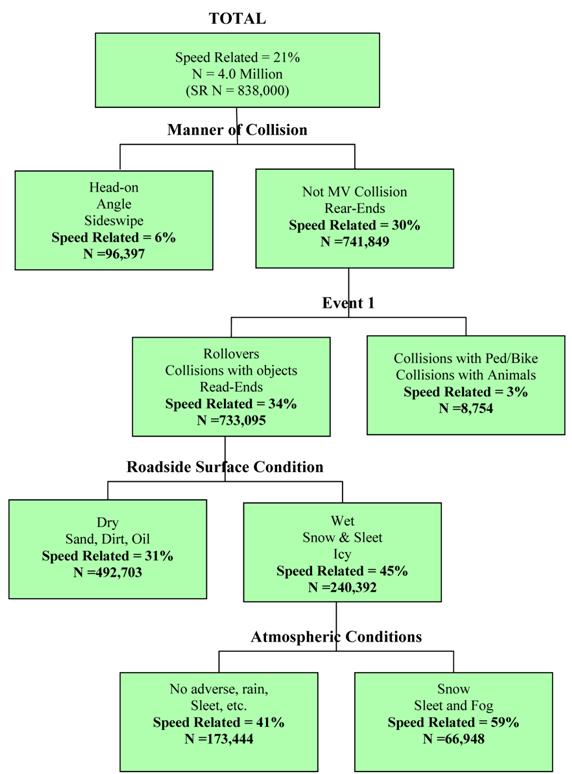
TOTAL GES SR CRASHESFigure 3 presents the results of the CART analysis for crash–related variables in the GES database. The CART analysis involved four levels. The most important SR predictive variable shown at the top tree branch is manner of collision, and the categories with the highest SR percentage are nonmotor–vehicle collisions and rear–end (30 percent). Within that branch, the most important variable is event 1, and the categories with the highest SR percentage include rollovers, collisions with objects, and rear–ends. Within that branch, the most important branch variable is roadway surface condition, and the categories with the highest SR percentage are wet, snow and sleet, and icy. Finally, within that branch, the most important variable is atmospheric conditions, and the categories with the highest SR percentage are snow and sleet and fog. The latter reinforces the adverse weather finding from the above branch, but it adds little additional information. In this final selected subsample, approximately 60 percent of the crashes are SR. In general, these branches indicate that rear–end and off–roadway crashes in bad weather are more likely to be SR. Note that this final SR subcategory includes about 67,000 of the 4 million GES crashes analyzed in the training set–approximately 2 percent of the total crashes and 8 percent of the total SR crashes. If the latter branch is omitted, the third level (including road surface condition) contains approximately 6 percent of the total GES sample and 29 percent of the total SR sample. Approximately 45 percent of this subset is SR.
Figure 3. Chart. CART SR output for 2005 GES crashes.
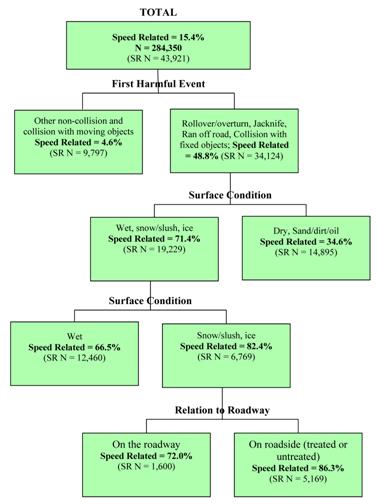
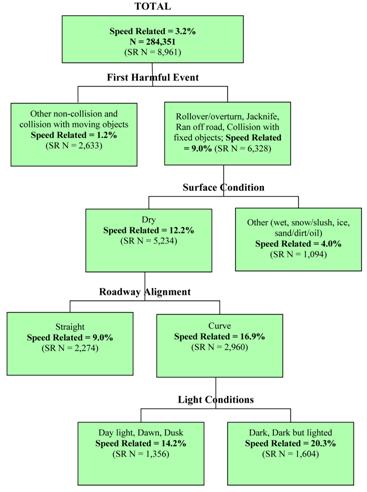
NORTH CAROLINA AND OHIO SR CRASHESCART analyses for the North Carolina and Ohio crashes were conducted to further examine differences between the combined and over speed limit definitions and to examine the consistency between the State results and between the State and national results. CART figures and their results are included below. North Carolina Crash–Based CART Results In the four–level North Carolina analysis using the combined definition shown in figure 4, the most important SR predictive variable is first harmful event. The categories with the highest SR percentage are rollover/overturn, jackknife, ran off road, and collision with fixed objects, which are single–vehicle crashes (49 percent). Within that single–vehicle branch, the most important variable is surface condition, and the categories with the highest SR percentage include wet, slow/slush, and ice. Within that branch, the most important branch variable is again surface condition, with the highest SR subset including only snow and ice. Finally, within this subset, the most important variable is relation to roadway, and the categories with the highest SR percentage include on roadside (treated and untreated). This latter branch reinforces the general finding that the most important crashes are single–vehicle roadside crashes on snowy or icy roads. Approximately 86 percent of the crashes in this final branch are SR, and it includes approximately 5,200 of the 284,000 crashes in the North Carolina training set–approximately 2 percent of the total North Carolina sample and 12 percent of the total North Carolina SR crashes. In the original North Carolina CART analysis using the over speed limit definition, crash severity is a second–level predictor. However, since it does not appear that dividing crashes into severity categories would give much guidance into crash types of interest, the analysis was redone without including the crash severity variable. The revised CART analysis contains four levels, as shown in figure 5. The most important SR predictive variable is first harmful event. The categories with the highest SR percentage are rollover/overturn, jackknife, ran off road, and collision with fixed objects, which are all single–vehicle crashes (9 percent). Within that single–vehicle branch, the most important variable is surface condition, and the category with the highest SR percentage includes dry. Note that this differs from the combined CART in figure 4 where dry is not the most important category. This clearly shows the difference between using the liberal and conservative definitions of SR. Within the dry roadway branch, the most important branch variable is roadway alignment, with curves being the most important category. Finally, within this branch, the most important variable is light conditions, with the highest categories being dark and dark but lighted. Thus, in general, this analysis using the more conservative over speed limit SR definition indicates that the crash branch most likely to be SR is single–vehicle crashes on dry curves during night. Approximately 20 percent of the crashes in this final branch are SR, and the subset includes approximately 1,600 of the 284,000 crashes in the North Carolina training set–approximately 0.6 percent of the total sample and 18 percent of the SR sample.
Figure 4. Chart. CART results for North Carolina crash-based variables using the combined SR definition (2002-2004).
Figure 5. Chart. CART results for North Carolina crash–based variables using the over speed limit SR definition (2002–2004).
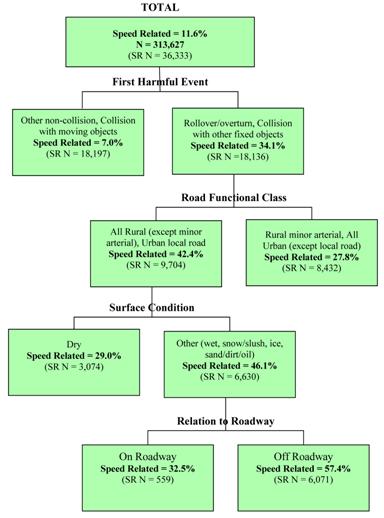
Ohio Crash–Based CART Results In the Ohio CART analysis shown in figure 6, using the combined definition, the most important SR predictive variable is first harmful event. The categories with the highest SR percentage are rollover/overturn and collision with other fixed objects, which are single–vehicle crashes (34 percent). Within that single–vehicle branch, the most important variable is road functional class. The majority are all rural classes (interstate, other principal arterials, major and minor collectors and local roads) except minor arterial and includes the urban local roads. Within this group, the most important branch variable is surface condition, with the important categories including wet, snow/slush, ice, and sand/dirt/oil. Finally, within this branch, the most important variable is relation to roadway, and the category with the highest SR percentage is off roadway. Thus, in general, this analysis using the liberal SR definition indicates that the crash subset most likely to be SR is off–road, single–vehicle crashes within predominantly rural road classes on nondry roads. Approximately 57 percent of the crashes in this final subset are SR by the liberal definition, and the subset includes approximately 6,000 of the 314,000 crashes in the Ohio training set–approximately 2 percent of the total analyzed sample and 17 percent of the SR sample. In the Ohio CART analysis shown in figure 6, using the combined definition, the most important SR predictive variable is first harmful event. The categories with the highest SR percentage are rollover/overturn and collision with other fixed objects, which are single-vehicle crashes (34 percent). Within that single-vehicle branch, the most important variable is road functional class. The majority are all rural classes (interstate, other principal arterials, major and minor collectors and local roads) except minor arterial and includes the urban local roads. Within this group, the most important branch variable is surface condition, with the important categories including wet, snow/slush, ice, and sand/dirt/oil. Finally, within this branch, the most important variable is relation to roadway, and the category with the highest SR percentage is off roadway. Thus, in general, this analysis using the liberal SR definition indicates that the crash subset most likely to be SR is off-road, single-vehicle crashes within predominantly rural road classes on nondry roads. Approximately 57 percent of the crashes in this final subset are SR by the liberal definition, and the subset includes approximately 6,000 of the 314,000 crashes in the Ohio training set—approximately 2 percent of the total analyzed sample and 17 percent of the SR sample.
Figure 6. Chart. CART results for Ohio crash–based variables using the combined SR definition (2003–2005).
Figure 7. Chart. CART results for Ohio crash–based variables using the over speed limit SR definition (2003–2005).
SUMMARY CONCLUSIONS ON CRASH-RELATED CART ANALYSESThe findings from the CART analysis are not completely consistent; however, there is consistency across all four databases and both SR definitions with respect to the fact that the top–level predictor of SR crashes is first harmful event and that the categories with the highest SR percentage are, in general, single–vehicle, run–off–road crashes. However, it is noted that the top–level GES branch also includes rear–end crashes. The analyses using the liberal combined SR definition indicates that within these run–off–road crashes, the most important predictor is the roadway surface/weather with snowy/icy roads, having the highest SR percentage. Indeed, the GES and North Carolina combined definition findings include no strong predictors other than these two. Third– and fourth–level predictors within FARS and Ohio data differ with FARS data, indicating crashes on curves with lower speed limits and Ohio data, indicating that rural roadway class is an important predictor. The over speed limit findings in North Carolina and Ohio again point to the single–vehicle, run–off–road crashes, but the predictors within this set differ from the above results using the combined definition in that these indicate that dry (or dry and wet) roads predict higher SR percentages than the snowy/icy roads. These over speed limit analyses also indicate that single–vehicle crashes on curves (found in North Carolina), during the nighttime (found in North Carolina and Ohio), and on roads with more than two lanes (Ohio) are important SR predictor categories.
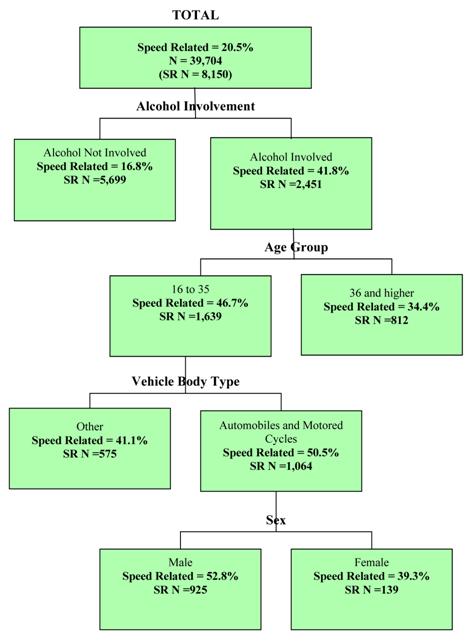
FATAL FARS SR VEHICLES/DRIVERSFigure 8 below shows the results for the vehicle–based analyses using the FARS data.
Figure 8. Chart. CART SR output for 2005 FARS vehicles/drivers. The most important SR predictive variable is alcohol involvement. The category with the highest SR percentage shows that alcohol is involved (42 percent). Within that branch, the most important variable is age group, and the categories with the highest SR percentage include drivers who are 16–35 years old. Within that branch, the most important branch variable is vehicle body type, and the categories with the highest SR percentage include automobiles and motorcycles. Finally, within this branch, the most important variable is sex, and the category with the highest SR percentage is male. Thus, in general, this analysis of fatal crashes (using the liberal combined SR definition by default) indicates that the fatal crash subset most likely to include SR vehicles are those with drivers who are drinking and are young males driving either automobiles or motorcycles. Approximately 52 percent of the crashes in this final subset are SR, and the subset includes approximately 1,800 of the 40,000 fatal crashes in the FARS training set–approximately 2 percent of the total sample and 11 percent of the SR sample.
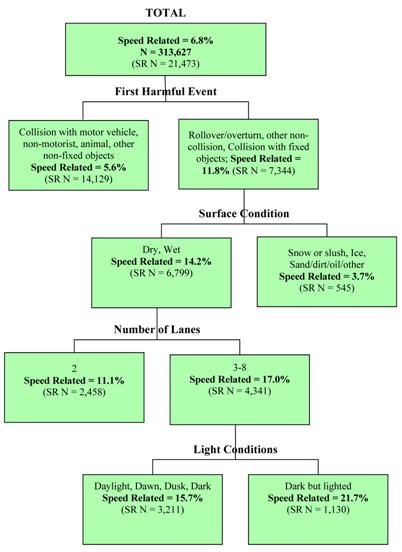
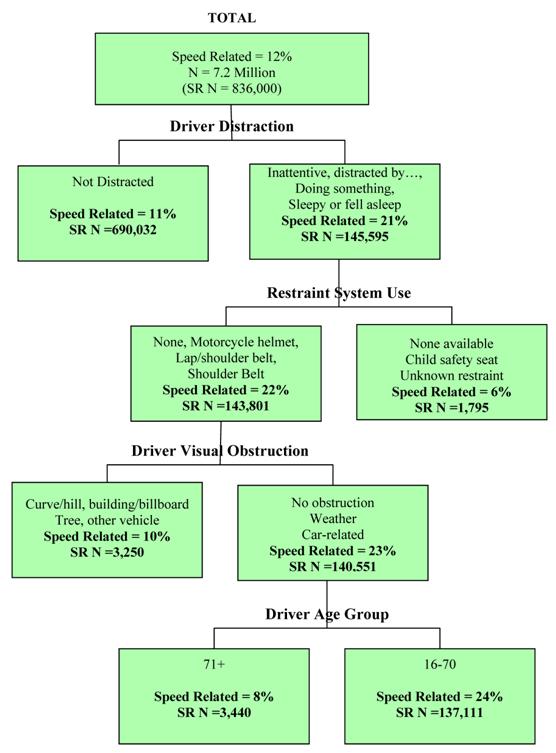
TOTAL GES SR VEHICLES/DRIVERSFigure 9 shows the results for the vehicle–based analyses using the GES data. The most important SR predictive variable is driver distraction. The categories with the highest SR percentage are the various types of distraction (doing something, inattentive, sleepy, etc.). Within that branch, the most important variable is restraint system use, and the categories with the highest SR percentage include none, motorcycle helmet, lap/shoulder belt, and shoulder belt. Unfortunately, this grouping of categories is not informative since those who do not use restraint are grouped with those who do. CART does not distinguish between the motorcycle helmet users and nonbelt users versus the users as the single–variable tables have done (probably because the lap and shoulder group is so large, comprising of 80 percent of the data). Within that branch, the most important branch variable is driver visual obstruction, and the categories with the highest SR percentage include no obstruction, weather, and car–related (this does not include exterior obstructions such as hills, curves, trees, or buildings). Finally, within this branch, the most important variable is driver age group, with 16–70–year–old drivers included in category with the highest SR percentage. Thus, this analysis is difficult to interpret given the grouping of categories. In general, the vehicle/driver subset most likely to be SR is distracted drivers using or not using restraints with some visual obstruction and between the ages of 16–70. Approximately 24 percent of the drivers in this final subset are SR, and the subset includes approximately 137,000 of the 7.2 million vehicles in the GES training set–approximately 2 percent of the total sample of vehicles and 16 percent of the SR sample.
Figure 9. Chart. CART SR output for 2005 GES vehicles/drivers.
FHWA-HRT-10-024
|