U.S. Department of Transportation
Federal Highway Administration
1200 New Jersey Avenue, SE
Washington, DC 20590
202-366-4000
Federal Highway Administration Research and Technology
Coordinating, Developing, and Delivering Highway Transportation Innovations
| SUMMARY REPORT |
| This summary report is an archived publication and may contain dated technical, contact, and link information |
|
Publication Number: FHWA-HRT-10-053
Date: June 2010 |
|||||||||||||||||||||||||||||||||||||||||||||||||||||||||||||||||||||||||||||||||||||||||||||||||||||||||||||||||||||||||
Evaluation of Lane Reduction "Road Diet" Measures on CrashesFHWA Contact: Carol Tan, HSIS Program Manager, PDF Version (1.09 MB)
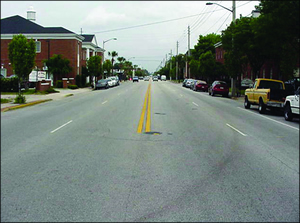
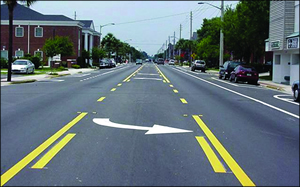
PDF files can be viewed with the Acrobat® Reader® This Highway Safety Information System (HSIS) summary replaces an earlier one, Evaluation of Lane Reduction "Road Diet" Measures and Their Effects on Crashes and Injuries (FHWA-HRT-04-082), describing an evaluation of "road diet" treatments in Washington and California cities. This summary reexamines those data using more advanced study techniques and adds an analysis of road diet sites in smaller urban communities in Iowa. A road diet involves narrowing or eliminating travel lanes on a roadway to make more room for pedestrians and bicyclists.(1) While there can be more than four travel lanes before treatment, road diets are often conversions of four-lane, undivided roads into three lanes—two through lanes plus a center turn lane (see figure 1 and figure 2). The fourth lane may be converted to a bicycle lane, sidewalk, and/or on-street parking. In other words, the existing cross section is reallocated. This was the case with the two sets of treatments in the current study. Both involved conversions of four lanes to three at almost all sites.
Road diets can offer benefits to both drivers and pedestrians. On a four-lane street, speeds can vary between lanes, and drivers must slow or change lanes due to slower vehicles (e.g., vehicles stopped in the left lane waiting to make a left turn). In contrast, on streets with two through lanes plus a center turn lane, drivers' speeds are limited by the speed of the lead vehicle in the through lanes, and through vehicles are separated from left-turning vehicles. Thus, road diets may reduce vehicle speeds and vehicle interactions, which could potentially reduce the number and severity of vehicle-to-vehicle crashes. Road diets can also help pedestrians by creating fewer lanes of traffic to cross and by reducing vehicle speeds. A 2001 study found a reduction in pedestrian crash risk when crossing two- and three-lane roads compared to roads with four or more lanes.(2) Under most annual average daily traffic (AADT) conditions tested, road diets appeared to have minimal effects on vehicle capacity because left-turning vehicles were moved into a common two-way left-turn lane (TWLTL).(3,4) However, for road diets with AADTs above approximately 20,000 vehicles, there is an increased likelihood that traffic congestion will increase to the point of diverting traffic to alternative routes. While potential crash-related benefits are cited by road diet advocates, there has been limited research concerning such benefits. Two prior studies were conducted using data from different urbanized areas. The first, conducted by HSIS researchers, used data from treatment sites in eight cities in California and Washington.(5) The second study analyzed data from treatment sites in relatively small towns in Iowa.(6) While the nature of the treatment was the same in both studies (four lanes reduced to three), the settings, analysis methodologies, and results of the studies differed. Using a comparison of treated and matched comparison sites before and after treatment and the development of negative binomial regression models, the earlier HSIS study found a 6 percent reduction in crash frequency per mile and no significant change in crash rates at the California and Washington sites. Using a long-term (23-year) crash history for treated and reference sites and the development of a hierarchical Poisson model in a Bayesian approach, the later Iowa study found a 25.2 percent reduction in crash frequency per mile and an 18.8 percent reduction in crash rate. Because of these differences, researchers from the National Cooperative Highway Research Program (NCHRP) 17-25 project team obtained and reanalyzed both data sets using a common methodology.(7) This summary documents the results of that reanalysis. METHODOLOGYResearch Design The basic objective of this reanalysis effort was to estimate the change in total crashes resulting from the conversions in each of the two databases and to combine these estimates into a crash modification factor (CMF). To do this, the empirical Bayes (EB) methodology described by Hauer was used.(8) A prediction of what would have happened at the treatment sites in the after period without treatment is based on a weighted combination of the following two factors: (1) the frequency of crashes on the treated sites in the before period and (2) the crash-frequency predictions from regression models developed with data from similar untreated reference sites. The prediction of what would have happened without treatment is then compared to what actually happened with treatment to estimate the safety effect of the treatment. The methodology corrects for the regression bias, changes in traffic volume at the treatment sites, and other possible confounding factors as well as provides a method for combining results from different jurisdictions by accounting for differences in crash experience and reporting practice. Details of the methodology are in appendix C of NCHRP Report 617.(7) Databases Used The two databases used were obtained from the original study authors. Both databases provided data on site characteristics for treatment and comparison or reference sites and on crashes and AADT for both the before and after periods. The HSIS study database contained data on treatment and comparison sites obtained from local traffic engineers in six cities in California—Mountain View, Oakland, Sacramento, San Francisco, San Leandro, and Sunnyvale—and two cities in Washington—Bellevue and Seattle.(5) The data included 30 treatment sites and 51 reference sites. The reference sites were matched by the local traffic engineer to be similar to the treatment sites in terms of functional class, type of development, speed limit, intersection spacing, and access control. The Iowa database included data from the original study for 15 treatment and 15 reference sites from U.S. and State routes in small urban towns with an average population of 17,000.(6) These data were supplemented with additional information provided by the Iowa Department of Transportation for 281 similar reference sites. As noted earlier, the road diet treatment was very similar at the sites in both databases. All 15 of the Iowa treatment sites involved conversion from four lanes to three lanes, with the third lane being a TWLTL. Bike lanes were installed in only one case and parallel parking was retained for a section within one other site. In the HSIS database, most treatment sites involved the same conversion from four lanes to three lanes as at the Iowa sites. At one site, the after condition included a raised median and left-turn pockets at intersections rather than a TWLTL. Table 1 provides descriptive characteristics for the treatment and control sites from each database. Crash statistics are also provided. In both data sets, the treatment and reference segments were divided into "homogeneous sites" for analysis purposes, and the average length was approximately 1 mi in all cases. In the Iowa data, the mean AADT for the reference sites was approximately the same as for the treatment sites, and the resulting crashes per mile-year for the reference sites and the before-period treatment sites were very similar. In the HSIS data, the mean AADT and the crashes per mile-year for the reference sites were somewhat higher than for the treatment sites. However, the AADT range in the reference site data included the AADT range in the treatment data, making it suitable for the predictive models produced. Table 1. Descriptive statistics of evaluation sites
Analysis As previously noted, one component of the prediction of after-period accident frequencies at the treatment sites without treatment is a regression model developed using data from the untreated reference sites. This model is referred to as a safety performance function (SPF). In this study, generalized linear modeling was used to estimate the SPF coefficients using the software package SAS® and assuming a negative binomial error distribution, all consistent with the state of research in developing these models. Examination of several model forms indicated that the most appropriate and useful models for both databases included AADT and segment length. The final model form and coefficients differed for the two databases. The final model for the Iowa data is shown in equation 1, where ay is a series of yearly calibration factors developed to account for the safety effect of changes other than AADT (e.g., accident reporting practices, demography, weather). The final model for the HSIS data is shown in equation 2. The HSIS data did not allow the development of yearly calibration factors.
RESULTSThe EB evaluation of total crash frequency indicated a statistically significant effect of the road diet treatment in both data sets and when the results are combined. Table 2 shows the results from each of the two studies and the combined results—the CMFs and their standard deviations. Table 2. Results of the EB reanalysis of the Iowa and HSIS data concerning 4-lane to 3-lane road diets.(5,6,7)
The Iowa data indicate a 47 percent reduction in total crashes while the HSIS (California and Washington) data indicate a 19 percent decrease—a substantial difference. These reanalysis results also differ from the original Iowa study results (a 25 percent reduction) and from the original HSIS results (a 6 percent reduction). Combining both data sets results in a 29 percent reduction in total crashes. DISCUSSION AND RECOMMENDATIONSThe authors identified two likely reasons the reanalysis differed from the original Iowa results. First, the reanalysis involved a much larger reference group than was available in the original study. Second, while the results of the original study weighted all treatment sites equally regardless of length, the reanalysis results provided more weight to longer sites. While not stated in the reanalysis report, the difference in the two analyses of the HSIS data could have resulted from the use of improved methodology (the EB method) in the reanalysis effort. This methodology made it possible to use all 30 treatment sites and 51 reference sites. In the original study, data from only 11 treatment sites and 24 reference sites were used, with the remaining sites being omitted due to small sample sizes of crashes because of short segment lengths, short data periods, or low average daily traffic. Of more importance than the differences between the original and current study efforts are the differences between the Iowa and HSIS treatment effects estimated in the reanalysis effort. These differences may be a function of traffic volumes and characteristics of the urban environments where the road diets were implemented. The sites in Iowa ranged in AADT from 3,718 to 13,908 and were predominately on U.S. or State routes passing through small urban towns with an average population of 17,000. The sites in Washington and California ranged in AADT from 6,194 to 26,376 and were predominately on corridors in suburban environments that surrounded larger cities with an average population of 269,000. In addition, based on a separate study of one site in Iowa, there appeared to be a traffic calming effect that resulted in a 4–5 mi/h reduction in 85th percentile free-flow speed and a 30 percent reduction in the percentage of vehicles traveling more than 5 mi/h over the speed limit (i.e., vehicles traveling 35 mi/h or higher).(9) The reanalysis authors speculated that while there could have been significant differences in speeds between the rural U.S. or State highway approaching a small town and the road diet section, this calming effect would be less likely in the larger cities in the HSIS study, where the approaching speed limits (and traffic speeds) might have been lower before treatment. Given these differences, it is recommended that the choice of which CMF to use should be based on the characteristics of the site being considered. If the proposed treatment site is more like the Iowa sites (i.e., U.S. or State routes with moderate AADTs in small urban areas), then the 47 percent reduction found in Iowa should be used. If the treatment site is part of a corridor in a suburban area of a larger city, then the 19 percent reduction should be used. If the proposed site matches neither of these site types, then the combined 29 percent reduction is most appropriate. REFERENCES
FOR MORE INFORMATIONThe research combining both databases was conducted by Bhagwant Persaud and Craig Lyon of Ryerson University, Toronto, Canada, as part of NCHRP Report 617.(7) The full study and appendix C can be downloaded from the Web address shown in the reference list. References to the initial studies that generated the two databases are also included in that list.(5,6) For more information about HSIS, contact Carol Tan, HSIS Program Manager, HRDS, (202) 493-3315, carol.tan@dot.gov. |
|||||||||||||||||||||||||||||||||||||||||||||||||||||||||||||||||||||||||||||||||||||||||||||||||||||||||||||||||||||||||