U.S. Department of Transportation
Federal Highway Administration
1200 New Jersey Avenue, SE
Washington, DC 20590
202-366-4000
Federal Highway Administration Research and Technology
Coordinating, Developing, and Delivering Highway Transportation Innovations
| REPORT |
| This report is an archived publication and may contain dated technical, contact, and link information |
|
| Publication Number: FHWA-HRT-13-047 Date: August 2013 |
Publication Number: FHWA-HRT-13-047 Date: August 2013 |
PDF files can be viewed with the Acrobat® Reader®
This appendix discusses the procedure used to develop, test, reduce, and analyze the sequence test topics evaluated in the simulator study.
A list of potential topics was created as a guideline for the types of sign sequences needing evaluations. The initial list included the following items:
This list was later altered, and topics were assigned to a study using photographs, a TTI simulator study, or both. When deciding which topics should be addressed by the contractor survey and which by the TTI survey, researchers first considered the measures of effectiveness. For topics where it was important to determine how quickly a driver would make a lane choice, a simulator study was desired. If it was only important to know what lane drivers would choose, the contractor survey was a more appropriate and less expensive option. Also, if it was important to see signs in a sequence and for the driver to see their spatial placement on the roadway, the simulator study was more appropriate. While the simulator offered driver immersion and driving data, the laboratory study allowed for quick, inexpensive testing of many different SSs. It is important to note that finalizing the topic list was an iterative process with the division of topics between the TTI simulator study and the contractor survey, as well as the elimination and addition of particular topics.
TTI houses a Realtime Technologies, Inc. desktop simulator that can be operated with one or three screens depending on study requirements (see figure 41). During the study, test signs were introduced in the simulation along freeway roadways to evaluate drivers' real-time response to the signs. The verbal instructions indicated a starting lane and a destination they were to drive toward. There were three types of destinations: exit, through, or a destination not mentioned on the signs. The starting lane and destination were varied between participants for each SS tested. The simulation environments were designed so that the drivers had ample time to reach an instructed 60–70 mi/h speed before viewing the first SS in each sequence. A speed range was given rather than an exact speed to discourage drivers from focusing their attention too much on the speedometer. The verbal instructions are shown in figure 42. For added realism, the roadside environment housed urban buildings spaced back from the roadway to avoid distraction from the signs. There was no additional traffic so that participants could make uninhibited lane changes and avoid inconsistent and possibly immeasurable distractions.
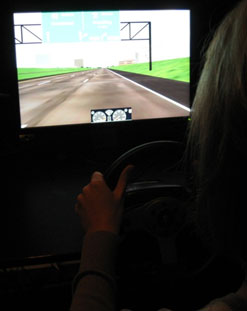
Figure 41. Photo.Example view of simulator.
Before we get started, I'd like to encourage you to ask questions whenever necessary, but other than that, please keep talking to a minimum.
[Practice (Begin reading as world is started)] The driving simulator you are seated in is an interactive simulator, which means the driving scenes you experience react to your steering and pedal inputs to provide a realistic driving experience. During your drive in the simulator, please drive in a normal fashion. You can adjust your pedals at a position that is comfortable for you. You will only be using the accelerator and brake and will not need to use the clutch on the far left. You will also not need to use your tum signal or any of the buttons on the steering wheel, although it will not hurt anything if you use them.
For the practice session, your task is to get comfortable with driving in the simulator. Go ahead and slowly maneuver onto the roadway and accelerate to a speed of 60 to 70 mi/h. Don't worry about driving at an exact speed limit; just do your best to try to stay in that range. How are you doing? Practice switching back and forth from the accelerator to the brake to get comfortable with the pedals. We can adjust the pedals' position if you need to. Also, I'd like you to practice changing lanes. You do not have to worry about other vehicles being in your blind spot.
You will drive 15 short drives similar to what you are driving now. At the beginning of each drive, I will give you a lane to start in and then will also give you a destination I'd like you to drive toward. When I give you the destination, please say the name back to me so that I know that you heard me correctly. Let's practice that now. Please start in the second-from-the-left lane. Your destination is Newport. (Correct the participant if he or she does not move over to the second-from-left lane and say "Newport" back to you.)
(As the participant approaches the first sign) Ahead you will see signs that will help you navigate to your destination. I only want you to make lane changes as necessary, but please make any necessary lane changes as soon as you are certain you will need to make one. After you pass the signs, please continue driving until I ask you to pull over and stop. When I do that, I will ask you some questions about the signs you saw and the lane choices you made.
(Allow them to pass the signs and then make an appropriate lane change.) Please bring the vehicle to a stop. (Keep the simulation going, and ask questions in the participant packet.)
Now we are going to get a little more practice. Please maneuver to the right lane and maintain a speed of 60-70 mi/h. (When they approach the end of the world) Please slowly coast to a stop. [Save Practice file as instructed on participant packet]
[Introduction] The experimental sessions will be just like the practice session you just did Please remember to drive between 60 and 70 mi/h. I will instruct you to start in a particular lane and will give you a destination to drive toward. Please repeat that destination to me. Remember to only make lane changes as necessary, but please make any necessary lane changes as soon as you are certain you will need to make one. I will instruct you when to pull over for the end of the session and then will ask you some questions that you can answer out loud. Do you have any questions? Please let me know if you need to take a break between sessions.
Figure 42. Illustration. Facilitator instructions.
Due to a combination of simulation geometry limitations and study intent, TTI used a variety of methods and interchange geometries to test the SSs. Several topics described in this section tested driver response to advance signs only (i.e., the 1- and 0.5-mi advance signs). After driving past two sets of advance signs, the simulation was stopped before the interchange came into view. With this approach, upcoming roadway geometry was not an influence on driver behavior, and the advance signs could be tested in isolation. This method of testing was sufficient for many topics because effective signing should result in drivers making decisions well before the gore point. Other topics tested driver response to a sequence of signs including advance signs plus gore signs. For these topics, drivers did reach an actual interchange that matched the geometry indicated on the signs.
In a previous version of the work plan, TTI proposed testing some gore signs in isolation without any advance signs. With preliminary testing in the simulator, it was found that sign viewing time in the simulation was shorter than that of the real world at the same speeds and did not give participants sufficient time to safely make a lane choice. As a result, all topics were tested with at least two signs in the sequence.
For each method, the key recorded measures included lane position, lane change, and distance from SB for the lane change. Verbal follow-up questions (e.g., what other lanes could you have been in to reach your destination?) or questions about information on the set of signs pertaining to an alternate destination than assigned were also asked following each drive segment.
The sign stimuli used in this study were developed using SignCAD® traffic sign design software. Along with the built-in standards tables of the software, TTI researchers used the MUTCD and the Standard Highway Sign Manual design guidelines to ensure the most accurate and consistent sign representations.(1,48) In several instances, SignCAD® could not create exactly what researchers desired. As a result, Adobe Photoshop® was used to finish the design. Finally, in order to appear more realistic and less cartoon-like in the simulator environment, the sign contrast and saturation were adjusted. Within the simulator environment, signs were viewed at the correct proportion to the roadway dimensions.
Table 1 lists the number of SSs tested and the number of determined testing variations (SL and instructed destination). Due to the high number of test scenarios, a between-subjects experimental plan was designed that divided the participants and the test scenarios into 6 groups with each participant seeing 15 scenarios, as shown in table 21. The scenarios with an asterisk reflect the second time that a group would drive a simulation from the same topic/SS combination. For example, group 1 would see SS A within topic 1 twice—once when starting in lane 1 and being told to exit (1A_E_1) and the other time starting in lane 3 and being told to go through (1A_T_3). Once reordered, these particular scenarios were separated by many other scenarios so that researchers believed a new SS with new destinations would not be required for the second time the same topic was shown.
| Topic | Group 1 | Group 2 | Group 3 | Group 4 | Group 5 | Group 6 |
|---|---|---|---|---|---|---|
| 1 | 1A_E_1 | 1A_E_1* | 1A_E_2 | 1A_T_3 | 1A_T_2 | 1A_E_2 |
| 1A_T_3* | 1A_T_2 | 1B_E_1 | 1B_E_2* | 1B_E_1 | 1B_T_2 | |
| 1B_E_2 | 1B_T_3 | 1B_T_2* | 1B_T_3 | 1C_E_2 | 1C_E_1* | |
| 1C_T_2 | 1C_E_2 | 1C_E_1 | 1C_T_2 | 1C_T_3* | 1C_T_3 | |
| 2 | 2A_2nd_2 | 2A_1st_2 | 2A_T_3 | 2A_T_4 | 2A_2nd_4 | 2A_2nd_5 |
| 2B_2nd_5 | 2B_2nd_4 | 2B_T_4 | 2B_T_3 | 2B_1st_2 | 2B_2nd_2 | |
| 2C_2nd_4 | 2C_2nd_5 | 2C_1st_2 | 2C_2nd_2 | 2C_T_4 | 2C_T_3 | |
| 3 | 3A_Left_2 | 3A_Left_3 | 3A_Right_2 | 3A_Right_3 | 3B_Left_2 | 3B_Left_3 |
| 3B_Right_2 | 3B_Right_3 | 3C_Left_2 | 3C_Left_3 | 3C_Right_2 | 3C_Right_3 | |
| 4 | 4A_CNV_1 | 4A_CNV_2 | 4A_2nd_2 | 4A_1st_2 | 4B_CNV_1 | 4B_CNV_2 |
| 4B_2nd_2 | 4B_1st_2 | 4C_CNV_1 | 4C_CNV_2 | 4C_2nd_2 | 4C_1st_2 | |
| 5 | 5A_T_4 | 5A_Oak_1 | 5A_Leon_3 | 5A_Leon_3 | 5A_Oak_1 | 5A_T_4 |
| 5B_Leon_3 | 5B_Oak_1 | 5B_T_4 | 5B_T_4 | 5B_Oak_1 | 5B_Leon_3 | |
| 6 | 6A_T_1 | 6A_T_1 | 6A_E_1 | 6A_E_1 | 6A_E_3 | 6A_E_3 |
| 6B_E_3 | 6B_E_3 | 6B_T_1 | 6B_T_1 | 6B_E_1 | 6B_E_1 |
*Second time that a group would see a test variation from the same topic/SS combination.
The scenarios in table 21 were reordered to avoid learning effects. The actual experimental order is shown in table 22.
| Experimental Order | Group 1 | Group 2 | Group 3 | Group 4 | Group 5 | Group 6 |
|---|---|---|---|---|---|---|
| 1 | 1A_E_1 | 2C_2nd_5 | 5B_T_4 | 4C_CNV_2 | 2B_1st_2 | 1C_T_3 |
| 2 | 6A_T_1 | 1A_T_2 | 1B_E_1 | 1B_T_3 | 1C_E_2 | 5A_T_4 |
| 3 | 2A_2nd_2 | 5A_Oak_1 | 3C_Left_2 | 6B_T_1 | 5B_Oak_1 | 4B_CNV_2 |
| 4 | 3A_Left_2 | 6B_E_3 | 6A_E_1 | 2C_2nd_2 | 3C_Right_2 | 2A_2nd_5 |
| 5 | 1C_T_2 | 3B_Right_3 | 2B_T_4 | 1A_T_3 | 6A_E_3 | 1A_E_2 |
| 6 | 4A_CNV_1 | 1C_E_2 | 4A_2nd_2 | 3A_Right_3 | 1A_T_2 | 6B_E_1 |
| 7 | 2B_2nd_5 | 4B_1st_2 | 1C_E_1 | 5B_T_4 | 4B_CNV_1 | 3B_Left_3 |
| 8 | 5A_T_4 | 2A_1st_2 | 2C_1st_2 | 2B_T_3 | 2A_2nd_4 | 4C_1st_2 |
| 9 | 6B_E_3 | 1B_T_3 | 3A_Right_2 | 4A_1st_2 | 1B_E_1 | 2B_2nd_2 |
| 10 | 3B_Right_2 | 6A_T_1 | 1A_E_2 | 1C_T_2 | 6B_E_1 | 5B_Leon_3 |
| 11 | 1B_E_2 | 3A_Left_3 | 4C_CNV_1 | 3C_Left_3 | 3B_Left_2 | 6A_E_3 |
| 12 | 4B_2nd_2 | 4A_CNV_2 | 6B_T_1 | 6A_E_1 | 5A_Oak_1 | 1B_T_2 |
| 13 | 2C_2nd_4 | 1A_E_1 | 5A_Leon_3 | 2A_T_4 | 2C_T_4 | 3C_Right_3 |
| 14 | 1A_T_3 | 2B_2nd_4 | 1B_T_2 | 1B_E_2 | 1C_T_3 | 2C_T_3 |
| 15 | 5B_Leon_3 | 5B_Oak_1 | 2A_T_3 | 5A_Leon_3 | 4C_2nd_2 | 1C_E_1 |
Participants were recruited through the existing TTI participant database and by distributed flyers. Possible participants were required to be 18 years of age or older and have a current Texas driver's license. A total of 42 participants were recruited—18 in College Station and 24 in Houston. Researchers used Texas demographics as a guide for participant recruitment to obtain a more accurate sample of the driving population in the test cities. Gender and age of licensed drivers were obtained from 2009 FHWA statistics, as seen in table 23.(42) The education breakdown of Texans ages 18 and older was obtained from the U.S. Census Bureau, as seen in table 24.(43) These breakdowns were used as guides, with education taking priority followed by age and then gender.
| Age Category | Males (Percent) | Females (Percent) | Total (Percent) |
|---|---|---|---|
| 18–25 | 12 | 12 | 12 |
| 25–39 | 30 | 30 | 30 |
| 40–54 | 30 | 30 | 30 |
| 55–64 | 15 | 15 | 15 |
| 65–74 | 8 | 8 | 8 |
| 75+ | 5 | 5 | 5 |
| Total | 100 | 100 | 100 |
| Educational Attainment | Males (Percent) | Females (Percent) | Total (Percent) |
|---|---|---|---|
| No high school diploma | 22 | 20 | 21 |
| High school diploma or equivalent (GED) | 27 | 27 | 27 |
| Some college, no degree | 28 | 31 | 29 |
| Bachelor's degree or higher | 23 | 22 | 23 |
| Total | 100 | 100 | 100 |
The simulator study was conducted using a Realtime Technologies Inc. desktop simulator that is operated with one or three screens. The scenarios that were evaluated generated a *.plt file for each participant. The *.plt files are delimited files that can be imported into different analysis software for conducting analyses. The parameters recorded in the study are described in table 25.
| Variable | Description |
|---|---|
| Time (s) | Time from the start of simulation in seconds. |
| Acceleration (°) | Depression of the acceleration pedal in degrees. |
| Brake (N) | Force on the brake pedal in Newtons. |
| Steer (rad) | Steering wheel turn angle in radians (negative is counter clockwise). |
| Road distance | Cumulative distance within a tile (starts over at 0 for new tile) in meters. Generally, but not always, a tile is 200 m long. |
| Velocity (m/s) | Participant speed in meters per second. |
| Lane number | Participant lane number. |
| Lane position (m) | Participant position within a lane measured from the center of the lane in meters. |
| Distance 1 (m) | Distance from vehicle to first SB in meters. |
| Distance 2 (m) | Distance from vehicle to second SB in meters. |
| Distance 3 (m) | Distance from vehicle to third SB in meters. |
| Distance 4 (m) | Distance from vehicle to fourth SB in meters. |
| Distance 5 (m) | Distance from vehicle to fifth SB in meters. |
1 ft = 0.305 m
Each participant was asked follow-up questions to quantify his or her experience/choice of lane after the simulator study. These questions were different for each topic. Details on the questions and scores for the answers are provided in the following sections. A sketch of the path taken by the participant along the simulation scenario, along with test question variation, SL, and destination were also recorded by researchers. This information for each participant and scenario was typed into a spreadsheet to develop a dataset for further analysis.
Demographic information such as age and gender were recorded for each participant. Table 26 lists the variables and their possible values. This information was typed into a spreadsheet for use in further analysis.
| Variable | Possible Value |
|---|---|
| City | C or H |
| Participant | 1 through 24 |
| Gender | 1 = male and 2 = female |
| Age | Any number |
| Race/ethnicity | 1 = White, 2 = African American, 3 = Asian, 4 = Hispanic, and 5 = Other |
| How many miles a year do you drive? | 1 = < 10,000, 2 = 10,000–15,000, and 3 = > 15,000 |
| Where do you do the majority of your driving? | 1 = rural, 2 = city, and 3 = freeways |
| Current employment | 1 = full, 2 = part, 3 = retired, 4 = student, 5 = homemaker, and 6 = other |
| Highest level of education | 1 = some high school, 2 = high school, 3 = some college, 4 = college graduate, 5 = some graduate school, and 6 = graduate degree |
| How often do you play video games? | 1 = never, 2 = 1–2/months, 3 = 1–2/weeks, 4 = < 1 h/day, 5 = > 1 h/day |
The assembled data subsets of participant files, follow-up questions, and demographic information were used to build databases for analysis. The participant file subset was exported, and participant number and topic information was added to develop a database for further analysis.
Participant position within a lane was one of the variables collected in the simulation study. A lane was assumed to be 11.81 ft wide, and the lane position was measured from the center of the lane, with negative values when the car moved left of the centerline and positive values when it moved right. Lane change maneuvers and their direction in the participant data subsets were identified by reviewing the change in lane-change position values. A change in lane position (greater than 1.7 in absolute value) from negative to positive indicated a lane change to the left, whereas a change from positive to negative indicated a lane change to the right. A lane change was recorded when the center of the vehicle crossed the lane line.
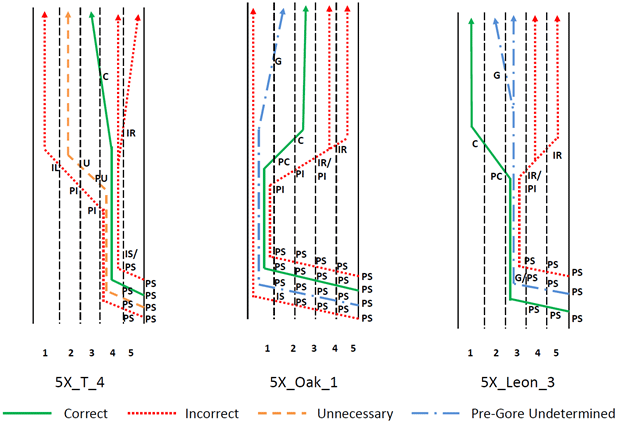
To determine the impacts of each SS for various combinations of SL and destination, each lane change maneuver was labeled. Performance of each SS was evaluated by a combination of proper lane choice, absence of unnecessary lane changes, and greater distance from the interchange where the lane changes were made. Apart from the correct, incorrect, and unnecessary lane change labels, different labels were used to account for the differences among the topics. Table 8 explains all labels used in building the dataset. These lane changes were checked with the sketch on the participant data sheet for accuracy and notes/comments. Figure 17 shows an example of the labels used to code lane changes. In the figure, the lane numbers are shown on the bottom of the graphic. The driver started on the right shoulder and was told to start in lane 1, which required several positioning lane changes (see codes starting with P). If the driver moved into lane 2 (as shown with the green solid line), a code of C was used at that point. In this topic, an incorrect lane change (labeled as IR) occurred when the driver moved from lane 1 to lane 2 after the exit ramp. An unnecessary lane change was noted if the driver moved from lane 1 to lane 3 (see orange dashed line).
Table 27 lists the demographic information for the 42 participants.
| Characteristics | Number (Percent) | |
|---|---|---|
| Age groups | 18–24 years old | 5 (12) |
| 25–39 years old | 14 (33) | |
| 40–54 years old | 12 (29) | |
| 55–64 years old | 8 (19) | |
| 65–74 years old | 3 (7) | |
| Race | White | 27 (64) |
| African American | 1 (2) | |
| Asian | 0 (0) | |
| Hispanic | 11 (26) | |
| Other | 2 (5) | |
| More than one race | 1 (2) | |
| Employment | Full time | 26 (62) |
| Part time | 5 (12) | |
| Retired | 5 (12) | |
| Student | 4 (10) | |
| Homemaker | 1 (2) | |
| Other | 1 (2) | |
| Gender | Male | 20 (48) |
| Female | 22 (52) | |
| Education | Some high school | 3 (7) |
| High school graduate | 10 (24) | |
| Some college/vocational | 15 (36) | |
| College graduate | 10 (24) | |
| Some graduate school | 0 (0) | |
| Graduate degree | 4 (10) | |
| Miles driven per year | < 10,000 mi | 6 (14) |
| 10,000-15,000 mi | 16 (38) | |
| > 15,000 mi | 20 (48) | |
| Normal driving conditions | Rural roads | 5 (12) |
| City streets | 20 (48) | |
| Freeways | 8 (19) | |
| Mixed | 9 (21) | |
| Frequency of playing video games | Never | 25 (60) |
| 1–2 times/month | 12 (29) | |
| 1–2 times/week | 3 (7) | |
| < 1 h/day | 0 (0) | |
| > 1 h/day | 2 (5) | |
Topic 1 involved testing the understanding and use of different methods for signs for an option lane. The topic evaluated driver understanding of arrow per lane, down arrow per lane, or signing only the exit and not the through movement. Full sequence of three SBs was used to test the understanding and use of the option lane as well as the distance from the signs that lane changes were made. As shown in figure 18 through figure 20, SS A had arrow-per-lane signs, SS B had down arrow-per-lane through signs, and SS C had no pull through sign.
The geometry for the topic was three lanes at the start that then split, with two lanes exiting to the right and two lanes going straight (see figure 11). Table 28 presents the testing variations used in the study, and figure 43 shows how lane changes were coded.
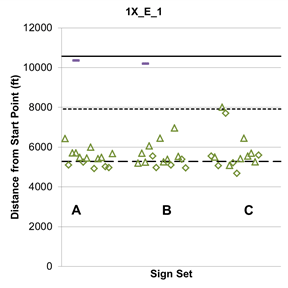
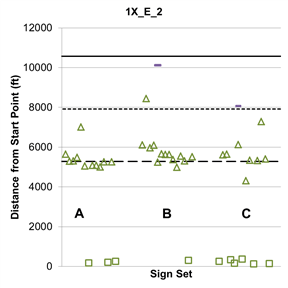
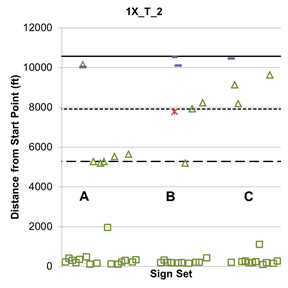
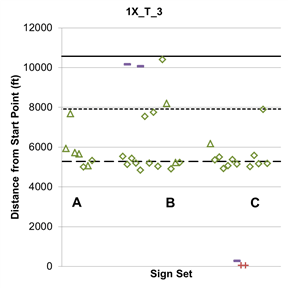
Table 9 shows a summary of the number of participants with correct, incorrect, and unnecessary lane changes by test variation for topic 1. Plots showing the location of the lane changes are provided in figure 43. Table 28 summarizes the findings from the questions, which were asked following the driving portion.
| SL | Instructed Destination | |
|---|---|---|
| Goodwell, Marshall, or Jackson (Through) | Reading, Deaning, or Louisburg (Exit) | |
| 1 | No lane change needed. | Exit destination from lane 1 (1X_E_1). Codes: |
| 2 | Through destination from lane 2 (1X_T_2). Codes: |
Exit destination from lane 2 (1X_E_2). Codes: |
| 3 | Through destination from lane 3 (1X_T_3). Codes: |
No lane change needed. |
Note: Shaded cells indicate conditions were not tested.
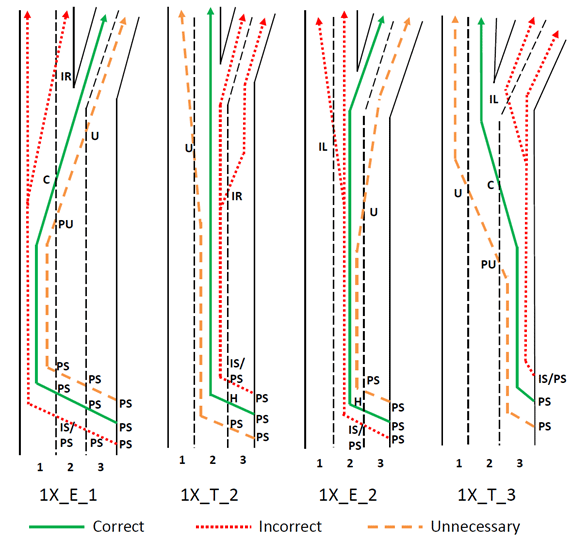
Figure 43. Illustration. Topic 1 lane change coding.
Observations for this topic are as follows:
![]()
Figure 44. Graph. Topic 1 lane change location 1X_E_1.
![]()
Figure 45. Graph. Topic 1 lane change location 1X_E_2.
![]()
Figure 46. Graph. Topic 1 lane change location 1X_T_2.
![]()
Figure 47. Graph. Topic 1 lane change location 1X_T_3.
| D | SL | SS | Was Leadville a City on the Sign? | Do you Feel Like you Had Enough Time to Make a Lane Choice? | How Confident Were You That You Picked the Correct Lane (1–10a)? | Where did the Through Lanes Go? | Where did the Exit Lanes Go? | Scenario | |
|---|---|---|---|---|---|---|---|---|---|
| Percent Correct | Percent Yes | Percent with 10 | Weighted Averageb | Percent Correctc | Percent Correct | ||||
| E | 1 | A | 79 | 100 | 93 | 9.4 | 57 | N/A | 1A_E_1 |
| B | 57 | 100 | 93 | 9.9 | 36 | N/A | 1B_E_1 | ||
| C | 86 | 93 | 100 | 10.0 | N/A | N/A | 1C_E_1 | ||
| 2 | A | 79 | 93 | 79 | 9.4 | 50 | N/A | 1A_E_2 | |
| B | 79 | 100 | 100 | 10.0 | 50 | N/A | 1B_E_2 | ||
| C | 64 | 100 | 57 | 9.3 | N/A | N/A | 1C_E_2 | ||
| T | 2 | A | 79 | 100 | 86 | 9.2 | N/A | 86 | 1A_T_1 |
| B | 100 | 93 | 100 | 10.0 | N/A | 57 | 1B_T_1 | ||
| C | 86 | 93 | 64 | 8.9 | N/A | 64 | 1C_T_1 | ||
| 3 | A | 71 | 100 | 93 | 9.9 | N/A | 64 | 1A_T_2 | |
| B | 86 | 93 | 100 | 10.0 | N/A | 57 | 1B_T_2 | ||
| C | 57 | 86 | 71 | 8.4 | N/A | 57 | 1C_T_2 | ||
|
D = Destination (E = Exit and T = Through).
a Participants were asked to rate 1 through 10, with 10 being the most confident. b Weighted average is the number of participants multiplied by the score provided by the participant divided by the total number of participants who answered the question. c For SS C, the driver would not know where the through lanes were going because the information was not on the sign; therefore, this question was not asked. N/A = Question not asked. |
Almost all participants made the correct decision to exit or stay on the freeway; however, many unnecessary lane changes were made with each of the three SSs for those people whose SL was either the far left or the far right. Drivers who started in the center lane and were given a through route destination were less likely to make unnecessary lane changes compared to all other conditions. The interesting finding here is that drivers who started in the center lane and were told to exit moved to the far right lane, which was an unnecessary lane change. However, drivers who started in the center lane and were given the through destination did not move to the far left lane. This may have been due to some reluctance on their part to move into the left lane, which is typically used for high-speed passing.
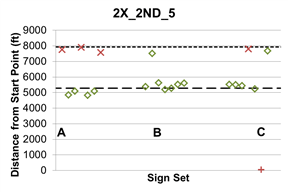
Topic 2 studied methods for signs when two interstate exits were within close proximity and where there was a need to use sign for three destinations (two interchanges/exits and the through lanes). Figure 21 through figure 23 show the SSs studied; only 1.5- and 1-mi advance signs were used to test when drivers changed lanes. The far right lane was an exit only lane, with the second to the right lane acting as an optional exit for the first interstate exit and then becoming an exit only lane for the second exit. Due to the complexity of the signs, SS A did not indicate the second exit as an exit only in any manner in the advance signs. As shown in figure 21 through figure 23, SS A had multiple signs with exit only panels, SS B had arrow-per-lane signs, and SS C had diagrammatic signs.
Table 30 presents the testing variations used in the study, and figure 12 shows a graphic of the geometrics for the portion of the rod the participants drove on. The simulation was ended prior to the participants reaching any of the exits. Figure 48 shows how lane changes were coded.
| Lane No. | Instructed Destination | ||
|---|---|---|---|
| Longford/Augusta/ Newport (Through) |
Clearwater/Steelville/ Sweetwater (Second Exit) | Hutchinson/Pleasanton/ Henderson (First Exit) |
|
| 1 | No lane change needed. | Must change lanes to lane 4. | Must change lanes to lane 4 (possible unnecessary change to lane 5). |
| 2 | No lane change needed. | Second exit destination from lane 2 (2X_2nd_2). Must change lanes to lane 4. Codes: 2A_2nd_2 2B_2nd_2 2C_2nd_2 |
First exit destination from lane 2 (2X_1st_2). Must change lanes to lane 4 (possible unnecessary—but not incorrect—change to lane 5). Codes: 2A_1st_2 2B_1st_2 2C_1st_2 |
| 3 | Through destination from lane 3 (2X_T_3). No lane change needed (possible unnecessary lane change to left). Codes: 2A_T_3 2B_T_3 2C_T_3 |
Must change lanes to lane 4 (possible late lane change to lane 4) | Must change lanes to lane 4 (possible unnecessary change to lane 5). |
| 4 | Through destination from lane 4 (2X_T_4). Must move over one lane to left. Codes: 2A_T_4 2B_T_4 2C_T_4 |
Second exit destination from lane 4 (2X_2nd_4). Must stay in lane (possible lane change to left). Codes: 2A_2nd_4 2B_2nd_4 2C_2nd_4 |
No lane change needed (possible unnecessary change to lane 5). |
| 5 | Must change lanes to lane 3. | Second exit destination from lane 5 (2X_2nd_5). Must change lanes to lane 4 (possible unnecessary change to lane 3). Codes: 2A_2nd_5 2B_2nd_5 2C_2nd_5 |
No lane change needed. |
| Note: Shaded cells indicate condition was not tested. |
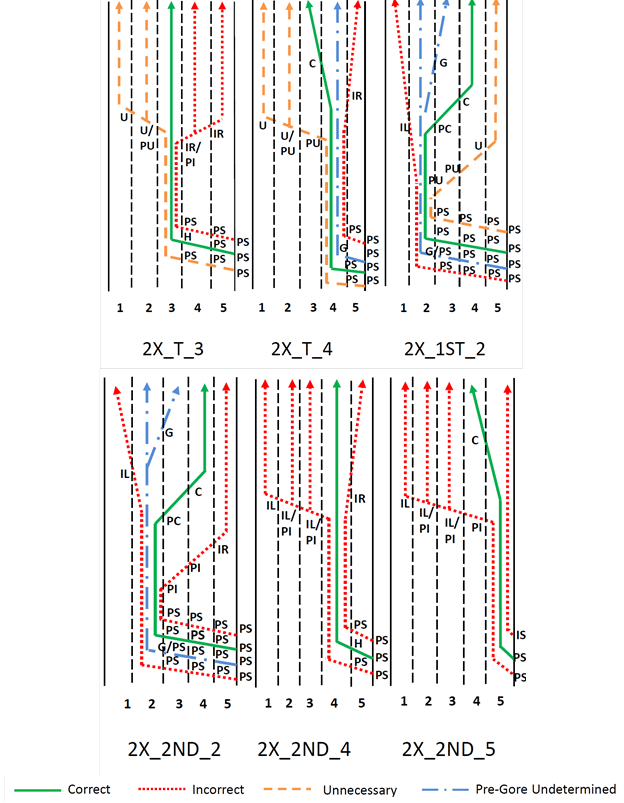
Figure 48. Illustration. Topic 2 lane change coding.
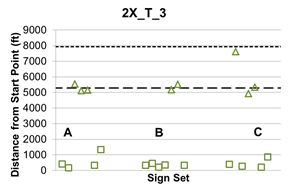
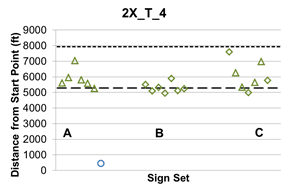
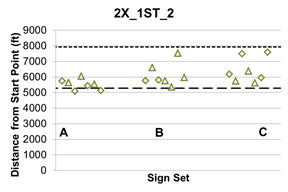
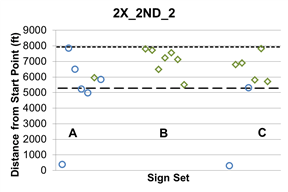
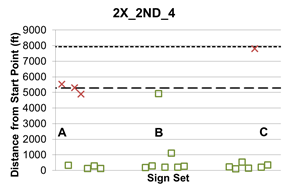
Table 10 shows a summary of the number of participants who made correct, incorrect, unnecessary, or pregore undetermined lane changes by test variation for topic 2. Plots showing the location of the lane changes are provided in figure 49 through figure 54.
Questions asked following the driving portion of this topic were as follows:
![]()
Figure 49. Graph. Topic 2 lane change location 2X_T_3.
![]()
Figure 50. Graph. Topic 2 lane change location 2X_T_4.
![]()
Figure 51. Graph. Topic 2 lane change location 2X_1st_2.
![]()
Figure 52. Graph. Topic 2 lane change location 2X_2nd_2.
![]()
Figure 53. Graph. Topic 2 lane change location 2X_2nd_4.
![]()
Figure 54. Graph. Topic 2 lane change location 2X_2nd_5.
| SS | Starting in Lane 3 | Starting in Lane 4 |
|---|---|---|
|
A |
|
|
|
B |
|
|
|
C |
|
|
Note: Observations are for when the participants were told the destination was Longford, Augusta, or Newport (i.e., they were to stay on the freeway).
| SS | Observations for When Participants were Told the Destination was Hutchinson, Pleasanton, or Henderson (i.e., First destination) | Observations for When Participants were Told to go to Clearwater, Steelville, or Sweetwater (i.e., Second Destination) |
|---|---|---|
A |
|
|
B |
|
|
C |
|
|
Note: This table covers observations for when the participants started in lane 2.
| SS | Lane 4 | Lane 5 |
|---|---|---|
| A |
|
|
| B |
|
|
| C |
|
|
Note: Observations for when the participants were told to go to Clearwater, Steelville, or Sweetwater (i.e., the second destination).
| SL | SS | Comment |
|---|---|---|
|
3 |
A |
|
|
3 |
B |
|
|
3 |
C |
|
Note: Observations for when the participants were told the destination was Longford, Augusta, or Newport (i.e., they were to stay on the freeway).
Observations for this topic are as follows:
For SS B, which had an arrow-per-lane design, all participants (42) made correct lane change decisions. SS C, which had a diagrammatic sign, also had many correct lane change decisions, with five or more of the seven participants in a group making the correct decision. Of the 42 participants who viewed SS C, only 3 made incorrect lane change decisions. SS A (multiple signs with exit only panels) did not have as favorable results. For example, 6 of the 42 participants made incorrect lane change decisions. SS A also had more of the participants needing additional information to make a lane change decision.
Topic 3 evaluated signing for an upcoming exit that had a Y-split into two directions. Researchers looked at how quickly drivers made a lane choice and whether one SS separated drivers into their proper lane more effectively for the upcoming Y-split. Signing options included a split sign to explore if it helped to maneuver drivers into the appropriate lane for the Y-split in advance of the initial exit. The SSs are shown in figure 24 through figure 26. SS A had shared exit signs, SS B had split exit signs both in advance and at the gore, and SS C had shared exit advance signs with a split exit sign at the gore. For SSs A and C, at the Y-split, the city exit on top of the sign branched to the left, and the one on the bottom branched to the right. Figure 55 shows a copy of the MUTCD figure that provides an example of signing for a two-lane exit ramp with two dropped lanes and a bifurcation beyond the mainline gore.(1)
The geometry presented to the driver was three lanes at the beginning with two lanes exiting to the right (geometry in simulator showed that the exit lanes traveled straight and the through lane curved to the left, as shown in figure 13). Participants had to decide whether to follow the through lane that curved to the left or take the exit. The simulation was stopped prior to the physical splitting of the exit into a left fork and a right fork. The testing variations are shown in table 35. Figure 56 shows how lane changes were coded, and figure 30 shows where the lane change occurred.
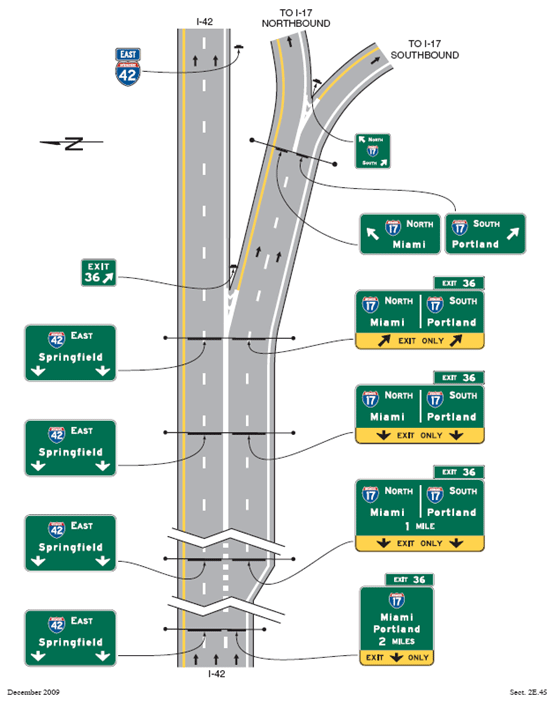
Figure 55. Illustration. MUTCD Figure 2E-34: Example of signing for a two-lane exit ramp with two dropped lanes and a bifurcation beyond the mainline gore.(1)
| SL | Instructed Destination | ||
|---|---|---|---|
| Murray/Richey/ Marsing (Through) | Winner/Edison/Mission (Left Fork) | Groton/Victor/Walker (Right Fork) | |
| 1 | Not tested. | Not tested. | Not tested. |
| 2 | Not tested. | Left fork destination from lane 2 (3X_Left_2). Must remain in lane. Codes: 3A_Left_2 3B_Left_2 3C_Left_2 |
Right fork destination from lane 2 (3X_Right_2). Must change lanes. Codes: 3A_Right_2 3B_Right_2 3C_Right_2 |
| 3 | Not tested. | Left fork destination from lane 3 (3X_Left_3). Must change lanes. Codes: 3A_Left_3 3B_Left_3 3C_Left_3 |
Right fork destination from lane 3 (3X_Right_3). Must remain in lane. Codes: 3A_Right_3 3B_Right_3 3C_Right_3 |
Note: Shaded cells indicate that the condition was not tested.
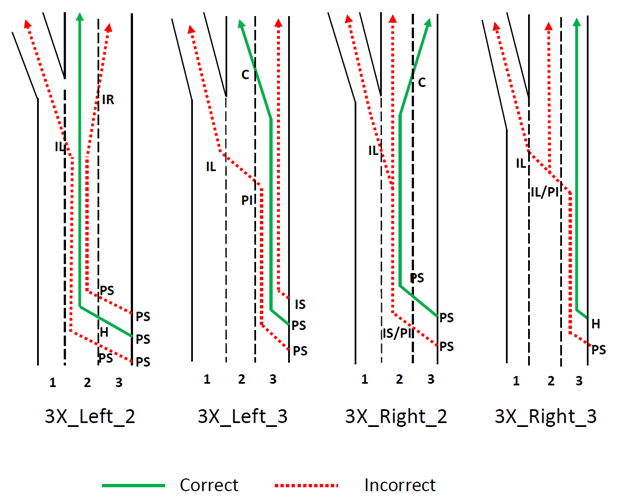
Figure 56. Illustration. Topic 3 lane change coding.
Table 11 shows a summary of the number of participants with correct, incorrect, unnecessary, and swerve lane changes by test variation for topic 3. Plots showing the location of the lane changes are provided in figure 30. Questions asked following the driving segment included the following:
| SS | SL | Exit Ramp Lane for Assigned Destination | Incorrect | Correct | Percent Correct |
|---|---|---|---|---|---|
| A | 2 | Left | 5 | 2 | 29 |
| A | 2 | Right | 6 | 1 | 14 |
| A | 3 | Left | 5 | 2 | 29 |
| A | 3 | Right | 5 | 2 | 29 |
| B | 2 | Left | 0 | 7 | 100 |
| B | 2 | Right | 0 | 7 | 100 |
| B | 3 | Left | 1 | 6 | 86 |
| B | 3 | Right | 2 | 5 | 71 |
| C | 2 | Left | 1 | 6 | 86 |
| C | 2 | Right | 1 | 6 | 86 |
| C | 3 | Left | 2 | 5 | 71 |
| C | 3 | Right | 1 | 6 | 86 |
| SS | SL | Assigned Fork | Winner, Edison, Mission | Groton, Victor, Walker | Same | I Do Not Know |
|---|---|---|---|---|---|---|
| A | 2 | Left | 6 | 0 | 0 | 1 |
| A | 2 | Right | 4 | 2 | 0 | 1 |
| A | 3 | Left | 2 | 3 | 2 | 0 |
| A | 3 | Right | 6 | 0 | 0 | 1 |
| B | 2 | Left | 0 | 6 | 1 | 0 |
| B | 2 | Right | 0 | 5 | 0 | 2 |
| B | 3 | Left | 0 | 2 | 1 | 4 |
| B | 3 | Right | 0 | 4 | 2 | 1 |
| C | 2 | Left | 0 | 4 | 0 | 3 |
| C | 2 | Right | 3 | 2 | 2 | 0 |
| C | 3 | Left | 3 | 3 | 1 | 0 |
| C | 3 | Right | 1 | 3 | 0 | 3 |
| SS | SL | I Do Not Know | Left | Left/Right | Right |
|---|---|---|---|---|---|
| A | 2 | 0 | 2 | 1 | 4 |
| A | 3 | 2 | 0 | 0 | 5 |
| B | 2 | 0 | 7 | 0 | 0 |
| B | 3 | 0 | 5 | 0 | 2 |
| C | 2 | 1 | 5 | 0 | 1 |
| C | 3 | 0 | 6 | 0 | 1 |
Note: Only participants who were given Winner, Edison, or Mission (i.e., left fork) as their destination were asked this question.
| SS | SL | I Do Not Know | Left | Left/Right | Right |
|---|---|---|---|---|---|
| A | 2 | 2 | 0 | 1 | 4 |
| A | 3 | 1 | 1 | 0 | 5 |
| B | 2 | 0 | 0 | 0 | 7 |
| B | 3 | 0 | 0 | 0 | 7 |
| C | 2 | 0 | 0 | 0 | 7 |
| C* | 3 | 0 | 0 | 0 | 6 |
*One participant who was assigned the right fork started in lane 3, viewed SS C, and did not take the exit.
Note: Only participants who were given Groton, Victor, or Walker (i.e., right fork) as their destination were asked this question.
Observations for this topic are as follows:
The lateral location of the destination on the sign was used by the participants in making a lane change decision. As can be seen in figure 28 and figure 29, several lane changes were made at the first appearance of the split exit sign (at SB I location for SS B and at SB III location for SS C). While several incorrect lane changes were made for each SS, SS B, which used split exit signs at all three SB locations, had the fewest and was judged superior in comparison to the other two arrangements.
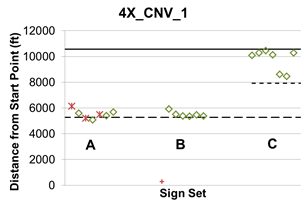
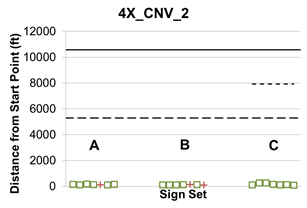
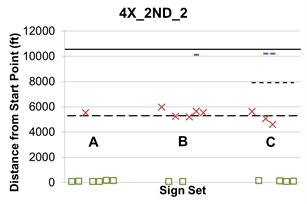
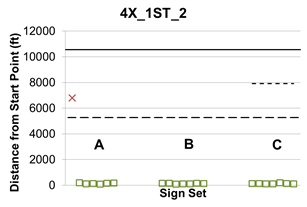
Topic 4 evaluated whether it was better to fill an advance single sign with supplemental way-finding information or to spread the information among multiple signs including, ground-mounted signs. AASHTO Guidelines for the Selection of Supplemental Guide Signs for Traffic Generators Adjacent to Freeways provides a basis for developing State policies for selecting supplemental guide signs for traffic generators adjacent to freeways.(44) For this topic, gore signs with advance signs at 1 mi were used to explore whether sign spreading on a single bridge or on multiple bridges improved where the lane change was occurring. As shown in figure 31 through figure 33, SS A had a single sign with multiple destinations, SS B had split signs on a single SB, and SS C had sign spreading on multiple SBs. All of the SSs had the exit number panels positioned on the upper right. Table 40 shows the testing variations used in the study, and figure 57 shows how lane changes were coded.
| SL | Instructed Destination | ||
|---|---|---|---|
| Convention Center | Kenston/Wright/Aspen (Second Exit) | Fitch/Martin/Clark (First Exit) | |
1 |
Convention center destination from lane 1 (4X_CNV_1). Must change lanes and take exit. Codes: 4A_CNV_1 4B_CNV_1 4C_CNV_1 |
No lane change needed. | No lane change needed. |
| 2 | Convention center destination from lane 2 (4X_CNV_2). Must remain in lane and take exit. Codes: 4A_CNV_2 4B_CNV_2 4C_CNV_2 |
Second exit destination from lane 2 (4X_2nd_2). Must pass exit and remain in lane. Codes: 4A_2nd_2 4B_2nd_2 4C_2nd_2 |
First exit destination from lane 2 (4X_1st_2). Must remain in lane and take exit. Codes: 4A_1st_2 4B_1st_2 4C_1st_2 |
Note: Shaded cells indicate that the condition was not tested.
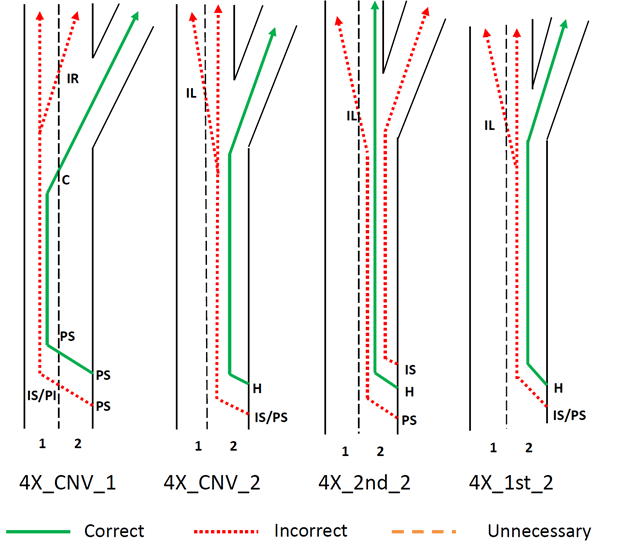
Note: See table 28 for meaning of codes.
Figure 57. Illustration. Topic 4 lane change coding.
Table 12 shows a summary of the number of participants with correct, incorrect, unnecessary, and indecisive lane changes by test variation for topic 4. Plots showing the location of the lane changes are provided in figure 58 through figure 61. Questions that were asked following the driving segment include the following:
![]()
Figure 58. Graph. Topic 4 lane change location 4X_CNV_1.
![]()
Figure 59. Graph. Topic 4 lane change location 4X_CNV_2.
![]()
Figure 60. Graph. Topic 4 lane change location 4X_2nd_2.
![]()
Figure 61. Graph. Topic 4 lane change location 4X_1st_2.
| SL | SS | Either | I Do Not Know | Left | Right | Total |
|---|---|---|---|---|---|---|
| 1 | A | 0 | 1 | 6 | 0 | 7 |
| 1 | B | 0 | 0 | 5 | 2 | 7 |
| 1 | C | 0 | 7 | 0 | 0 | 7 |
| 2 | A | 1 | 1 | 4 | 1 | 7 |
| 2 | B | 1 | 0 | 4 | 2 | 7 |
| 2 | C | 0 | 5 | 1 | 1 | 7 |
Note: Only participants who were given the Convention Center as a destination were asked this question.
| Destination | SS | I Do Not Know | No | Yes | Total |
|---|---|---|---|---|---|
| 1st | A | 0 | 1 | 6 | 7 |
| 1st | B | 2 | 4 | 1 | 7 |
| 1st | C | 0 | 0 | 7 | 7 |
| 2nd | A | 2 | 3 | 2 | 7 |
| 2nd | B | 2 | 2 | 3 | 7 |
| 2nd | C | 2 | 0 | 5 | 7 |
Note: Participants who were instructed to go to the Convention Center were not asked this question. All participants started in lane 2.
| SL | SS A | SS B | SS C |
|---|---|---|---|
|
1 |
|
|
|
|
2 |
|
|
|
| Destination | SS A | SS B | SS C |
|---|---|---|---|
|
Fitch/Martin/ Clark (first exit) |
|
|
|
|
Convention Center |
|
|
|
|
Kenston/ Wright/Aspen (second exit) |
|
|
|
Note: Blank cells indicate that the question was not asked because all drivers took the correct exit.
Observations for this topic are as follows:
For most of the variations studied, SS C (sign spreading across two SBs) had the most participants make the correct lane change decision, although SS A (information for next exit stacked on one sign) also had many of the participants correctly making lane positioning decisions. When the destination information was spread across multiple signs on a single bridge, several participants made incorrect lane changes to the left when the instructions were to go to the second destination. These drivers may have been positioning their vehicles into the lane under the sign with their intended destination. This finding indicates that spreading information about the next exit across multiple signs on a single bridge may have unintended consequences if the SB also includes a sign for another exit that is located to the left of the preferred lane.
Topic 5 evaluated the effectiveness of sign spreading when there were many bits of information on one SB. The question being explored was, "Does sign spreading affect where lane changes occur?" As shown in figure 34 and figure 35, SS A did not have sign spreading, while SS B had sign spreading across many SBs.
Table 45 presents the testing variations used in the study, and figure 62 shows how lane changes were coded. Because only 1.5- and 1-mi advance signs were used in the simulation, there could be some cases where the needed lane change would have occurred after the simulation was stopped. Therefore, the coding included a pregore undetermined option.
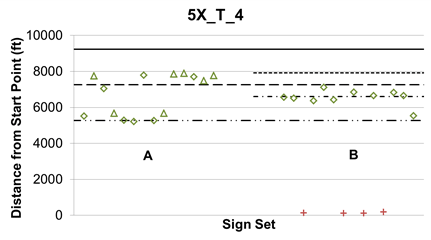
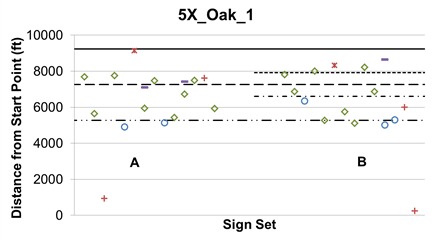
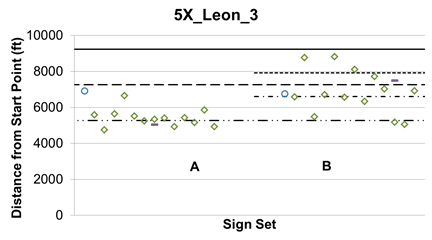
Table 13 shows a summary of the number of participants who made correct, incorrect, unnecessary, and swerve lane changes by test variation for topic 5. Plots showing the location of the lane changes are provided in figure 63 through figure 65.
Table 46 provides the percentage of participants who answered 1 or 10 along with the weighted average for each test variation for the three questions asked following the driving portion of the topic.
| SL | Instructed Destination | ||
|---|---|---|---|
| Davenport (Through) | Oak St | Leon | |
| 1 | Must change to lane 2. | Oak St. destination from lane 1 (5X_Oak_1). Must change to lane 3. Codes: 5A_Oak_1 5B_Oak_1 |
No lane change needed. |
| 2 | No lane change needed. | Must change to lane 3. | Must change to lane 1. |
| 3 | No lane change needed. | No lane change needed. | Leon destination from lane 3 (5X_Leon_3). Must change to lane 1. Codes: 5A_Leon_3 5B_Leon_4 |
| 4 | Through destination from lane 4 (5X_T_4). Must change to lane 3. Codes: 5A_T_4 5B_T_4 |
Must change to lane 3. | Must change to lane 1. |
| 5 | Must change to lane 3. | Must change to lane 3. | Must change to lane 1. |
Note: Shaded cells indicate that the condition was not tested.
Note: See table 28 for meaning of codes.
Figure 62. Illustration. Topic 5 lane change coding.
![]()
Figure 63. Graph. Topic 5 lane change location 5X_T_4.
![]()
Figure 64. Graph. Topic 5 lane change location 5X_Oak_1.
![]()
Figure 65. Graph. Topic 5 lane change location 5X_Leon_3.
| Scenario | How Confident are you that you Picked the Correct Lane? (Scale of 1 to 10 with 10 Being Most Confident) | Was that Too Much Information at One Time? (Scale of 1 to 10 with 1 being an Okay Amount and 10 Being too Much Information) | How Closely Spaced Do you Think the Signs Were? (Scale of 1 to 10, with 1 Being Okay and 10 Being Way too Close) | |||||
|---|---|---|---|---|---|---|---|---|
| Percent with 10 | Weighted | Percent with 1 | Percent with 10 | Weighted | Percent with 1 | Percent with 10 | Weighted | |
| 5A_Leon_3 | 93 | 9.4 | 21 | 7 | 4.6 | N/A | N/A | N/A |
| 5A_Oak_1 | 50 | 8.5 | 36 | 7 | 4.1 | N/A | N/A | N/A |
| 5A_T_4 | 86 | 9.8 | 21 | 7 | 5.1 | N/A | N/A | N/A |
| 5B_Leon_3 | 86 | 9.3 | N/A | N/A | N/A | 29 | 7 | 4.1 |
| 5B_Oak_1 | 36 | 7.7 | N/A | N/A | N/A | 43 | 0 | 3.4 |
| 5B_T_4 | 100 | 10.0 | N/A | N/A | N/A | 29 | 0 | 3.9 |
N/A = Question not asked.
Observations for this topic are as follows:
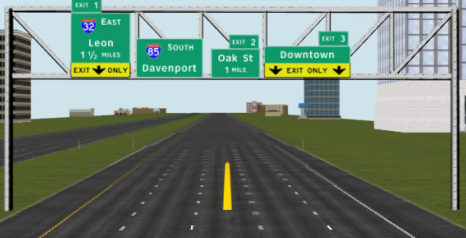
Note: Notice the position of the Davenport sign.
Figure 66. Screenshot. SS 5-A: no sign spreading.
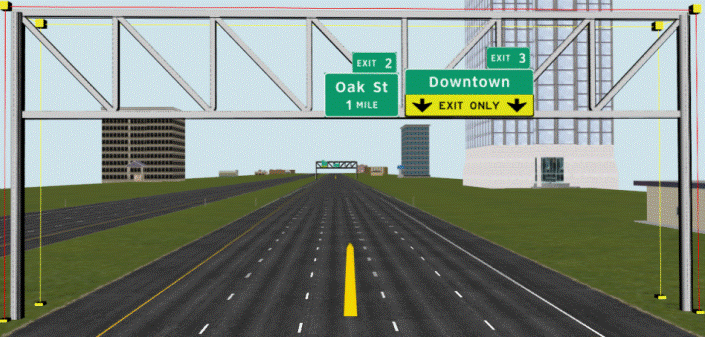
Figure 67. Screenshot. SS 5-B: Initial signs viewed when sign spreading is used.
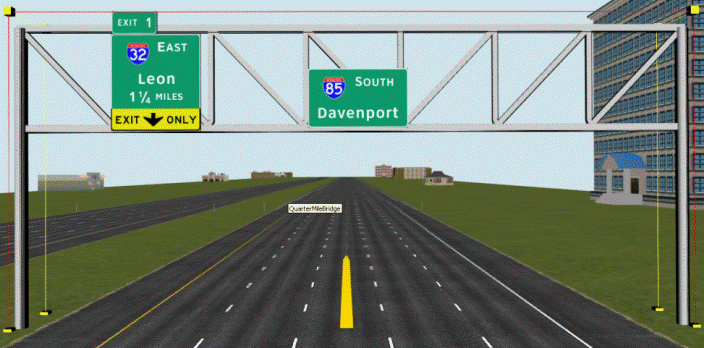
Note: Notice the position of the Davenport sign when sign
spreading is used.
Figure 68. Screenshot. SS 5-B: sign spreading across SBs.
The lateral position of a pull-through sign on the SB is important. SS A had more unnecessary lane changes compared to SS B; half of the participants with SS A had unnecessary lane changes, while SS B had no unnecessary lane changes. Because SS A had more signs on a single SB, the sign for Davenport was farther to the left, which may have resulted in participants trying to position themselves below the Davenport sign, causing in an unnecessary—but not incorrect—lane change. SS B had several participants who incorrectly did not move out of their initial lane when told to go to the through destination (Davenport).
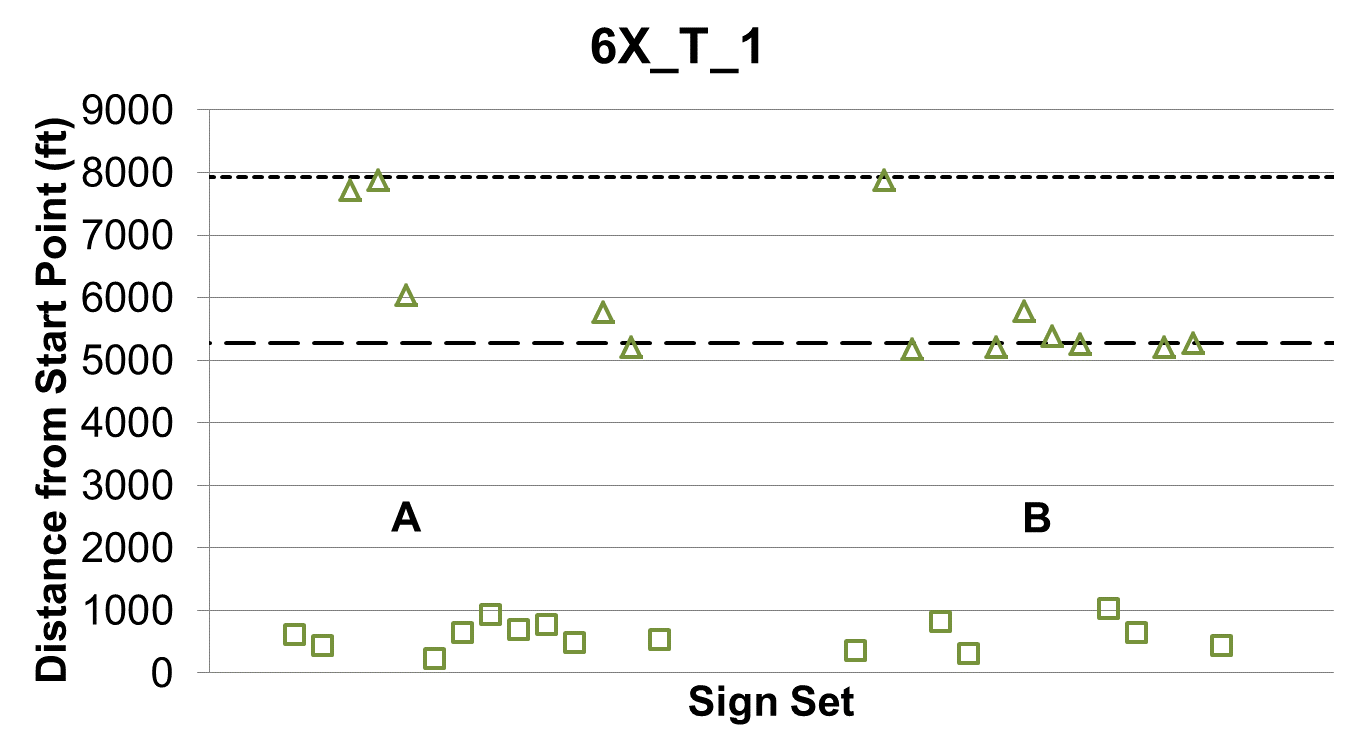
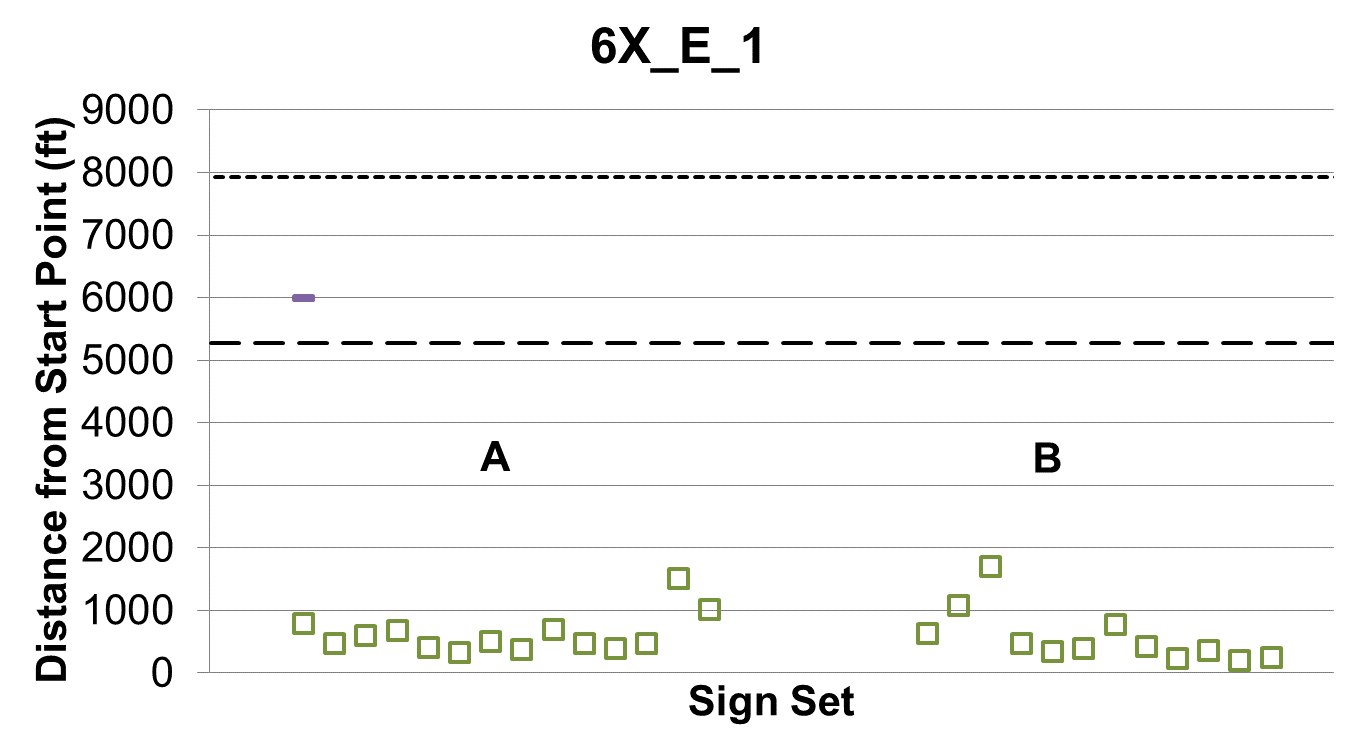
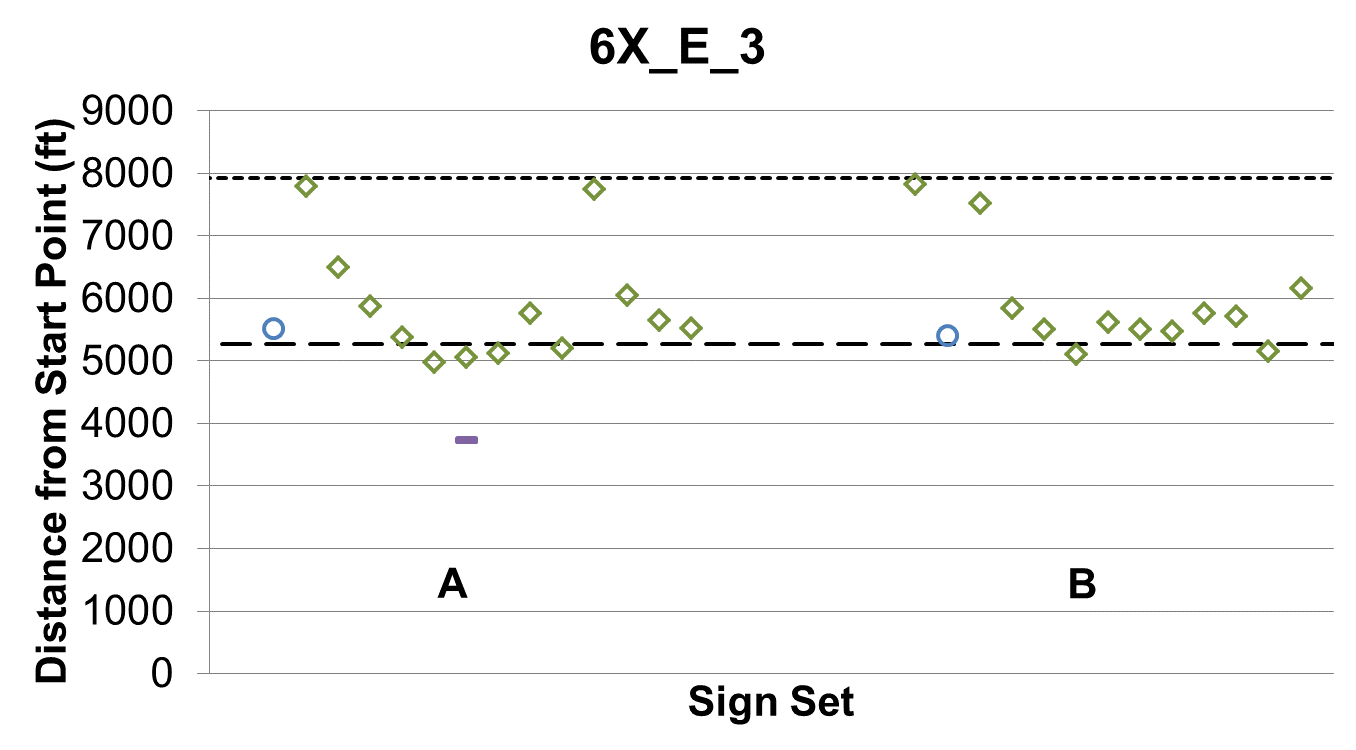
Topic 6 evaluated driver understanding of the 2009 MUTCD left exit standards.(1) Only 1- and 0.5-mi advance signs were used to test how quickly drivers identified the left exit and changed lanes and whether there was confusion on whether it was an exit only or optional exit. As figure 36 and figure 37 show, SS A had a yellow plaque at the top left, and SS B had a yellow panel at the bottom of the sign. Table 47 presents the testing variations used in the study, and figure 69 shows how lane changes were coded.
| SL | Instructed Destination | |
|---|---|---|
| Longmont or Youngstown (Through) | Enterprise or Winnsboro (Exit) | |
| 1 | Through destination from lane 1 (6X_T_1). No lane change needed (possible unnecessary change to lane 2). Codes: 6A_T_1 6B_T_1 |
Exit destination from lane 1 (6X_E_1). Must remain in lane to exit. Codes: 6A_E_1 6B_E_1 |
| 2 | No lane change needed. | Must change to lane 1. |
| 3 | No lane change needed. | Exit destination from lane 3 (6X_E_3). Must change to lane 1. Codes: 6A_E_3 6B_E_3 |
| 4 | No lane change needed. | Must change to lane 1. |
| 5 | No lane change needed. | Must change to lane 1. |
Note: Shaded cells indicate that the condition was not tested.
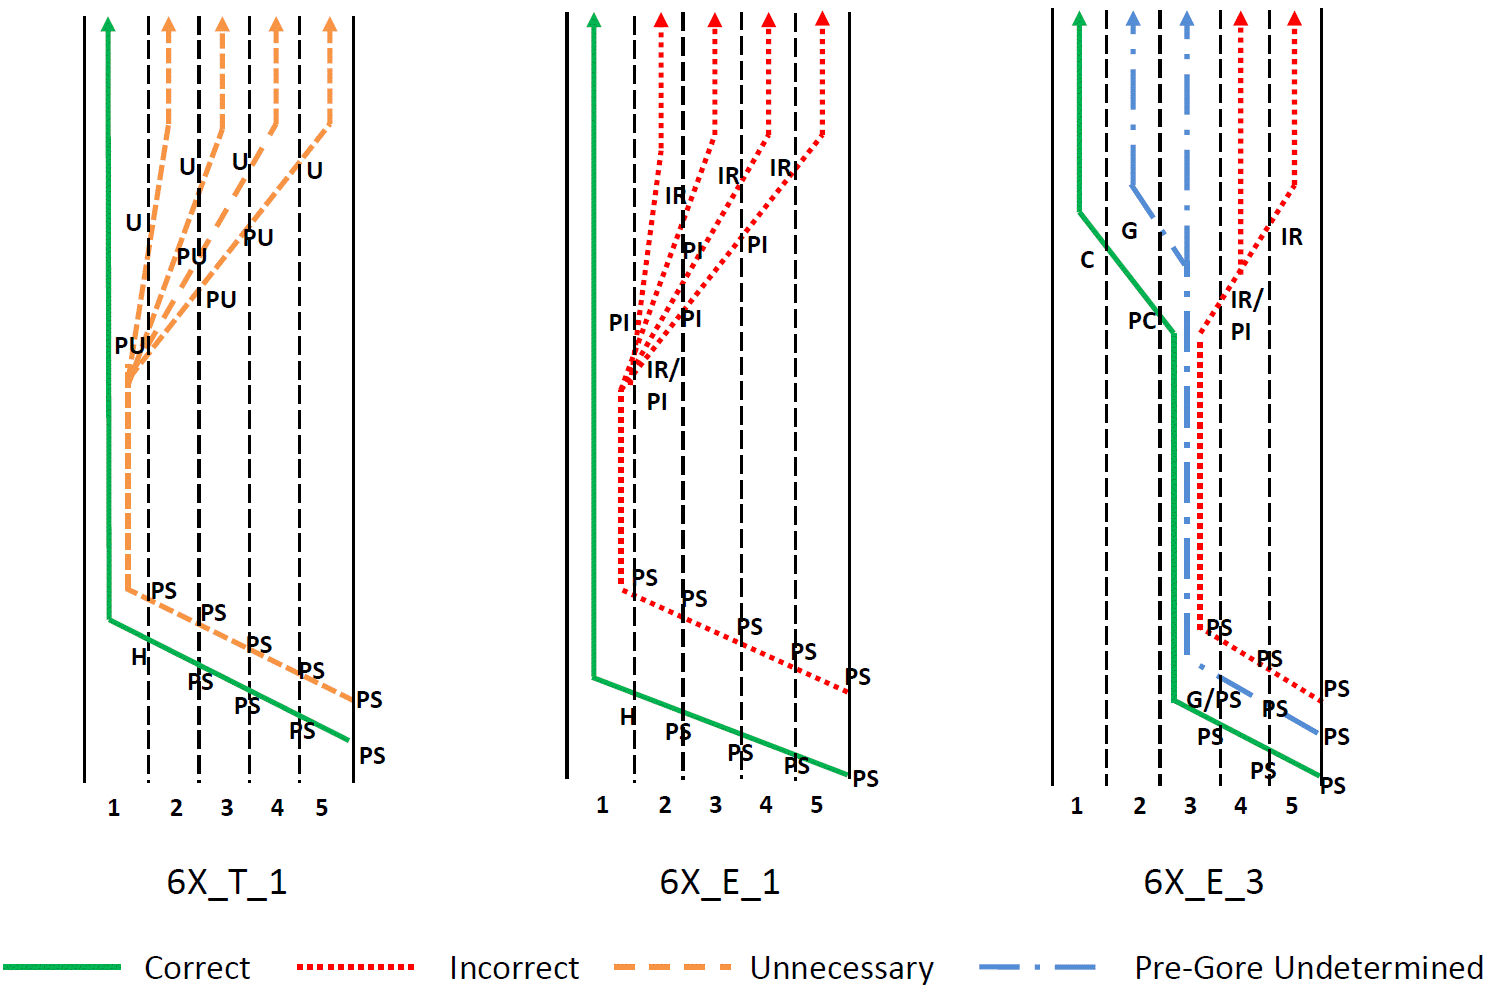
Figure 69. Illustration. Topic 6 lane change coding.
Table 14 shows a summary of the number of participants with correct, incorrect, unnecessary, and pregore undetermined lane changes by test variation for topic 6. Plots showing the location of the lane changes are provided in figure 70 through figure 72. Table 48 summarizes the findings from the questions asked following the driving portion.
![]()
Figure 70. Graph. Topic 6 lane change location 6X_T_1.
![]()
Figure 71. Graph. Topic 6 lane change location 6X_E_1.
![]()
Figure 72. Graph. Topic 6 lane change location 6X_E_3.
| Destination | SL | SS | Percent Correct for “Is the ramp to Enterprise/Winsborro on the left or the right?” |
|---|---|---|---|
| Through | 1 | A | 85 |
| B | 100 | ||
| Exit | 1 | A | 100 |
| B | 100 | ||
| 3 | A | 100 | |
| B | 100 |
Observations for this topic are as follows:
Generally, for the two SSs tested under this topic, participants understood which side of the road the exit was located. It is unclear if this was because the participants were cued by the placement of the sign over the left lane, read the word “left” on the signs, or a combination of the two. The placement of the sign over the left lane resulted in participants correctly avoiding traveling across multiple lanes to make a right exit. However, when the participants did not need to make a left exit, they frequently moved out of the left-most lane (even though the lane was not an exit only lane) due to personal preference. A few more of the non-exiting participants seeing SS B with the yellow panel at the bottom of the sign moved out of the left-most lane (8 of 14) compared to the participants seeing SS A with the yellow plaque at the top left (5 of 14). For this study, the difference between these two SSs was minimal.
This appendix discussed the procedure used to develop, test, reduce, and analyze several SSs evaluated in a simulator study. From a list of potential topics identified by the research team as needing evaluation, the following topics were selected for the simulator study:
Topic 1 tested the understanding and use of different methods to sign for an option lane. The topic evaluated driver understanding of arrow per lane, down arrow per lane, or signing only the exit and not the through movement. Almost all participants made the correct decision to exit or stay on the freeway; however, many unnecessary lane changes were made with each of the three SSs for those participants whose SL was either the far left or the far right. Drivers who started in the center lane and were given a through route destination were less likely to make unnecessary lane changes compared to all other conditions. The interesting finding is that drivers who started in the center lanes and were told to exit moved to the far right lane, which included an unnecessary lane change. However, drivers who started in the center lane and were given the through destination did not move to the far left lane. This may have been due to some reluctance on their part to move into the left lane, which is typically used for high-speed passing.
Topic 2 studied sign methods when two interstate exits were within close proximity and when a need existed to sign for three destinations (two interchanges/exits and the through lanes). For the SS that had an arrow-per-lane design, all participants (42) made correct lane change decisions. The SS that had a diagrammatic sign also had many correct lane change decisions, with five or more of the seven participants in a group making the correct decision. Of the 42 participants who viewed the diagrammatic sign, only three made incorrect lane-change decisions. The SS with exit only panels did not have as favorable results (e.g., 6 of the 42 participants made incorrect lane change decisions).
Topic 3 evaluated signing for an upcoming exit that had a Y-split into two directions. Signing options included a split sign to determine whether it helped maneuver drivers into the appropriate lane for the Y-split in advance of the initial exit. The split sign showed the two destinations side by side with a vertical white line separation. For SS B, the split sign was used for the two advance signs and at the gore. SS C only used the split sign at the gore with the two advance signs showing the destinations vertically stacked. SS A used the vertical stacked format for both the two advance signs and the gore sign. The data indicated that the lateral location of the destination on the sign was used by the participants in making a lane change decision. Several lane changes were made at the first appearance of the split exit sign (at the first advance sign location for SS B and near the gore sign for SS C). While several incorrect lane changes were made for each SS, the SS that used split signs at all three SB locations had the fewest.
Topic 4 evaluated whether it was better to fill an advance single sign with supplemental way-finding information or to spread the information among multiple signs, including ground-mounted signs. Gore signs with advance signs at 1 mi were used to explore whether sign spreading on a single bridge or on multiple bridges improved where the lane change was occurring. For most of the variations studied, the SS with sign spreading across two SBs had the most participants make the correct lane change decision, although the SS with information for the next exit stacked on one sign also had many of the participants correctly making lane positioning decisions. When the destination information was spread across multiple signs on a single bridge, several participants made incorrect lane changes to the left when the instructions were to go to the second destination. These drivers may have been positioning their vehicles into the lane under the sign with their intended destination. This finding indicates that spreading information about the next exit across multiple signs on a single bridge may have unintended consequences if the SB also includes a sign for another exit that is located to the left of the preferred lane.
Topic 5 evaluated the effectiveness of sign spreading when there were many bits of information on one SB. SS A did not have sign spreading, and SS B had sign spreading across many SBs. The findings indicated that the lateral position of a pull-through sign on the SB is important. SS A had more unnecessary lane changes compared to SS B; half of the participants with SS A had unnecessary lane changes, while SS B had no unnecessary lane changes. Because SS A had more signs on a single SB, the sign for Davenport was farther to the left, which may have resulted in participants trying to position themselves below the Davenport sign, resulting in an unnecessary—but not incorrect—lane change. SS B had several participants who incorrectly did not move out of their initial lane when told to go to the through destination (Davenport).
Topic 6 evaluated driver understanding of the 2009 MUTCD left exit standards.(1) Only 1- and 0.5-mi advance signs were used to test how quickly drivers identified the left exit and changed lanes and if there was confusion on whether it was an exit only or optional exit. SS A had a yellow plaque at the top left, and SS B had a yellow panel at the bottom of the sign. Generally, for the two SSs tested under this topic, participants understood which side of the road the exit was located. It is unclear if this was because the participants were cued by the placement of the sign over the left lane, read the word “left” on the signs, or a combination of the two. The placement of the sign over the left lane resulted in the participants correctly avoiding moving across multiple lanes to make a right exit. However, when the participants did not need to make a left exit, they frequently moved out of the left-most lane (even though the lane was not an exit only lane) due to personal preference. A few more of the non-exiting participants seeing SS B with the yellow panel at the bottom of the sign moved out of the left-most lane (8 of 14) compared to the participants seeing SS A with the yellow plaque at the top left (5 of 14). Overall, for this study, the difference between these two SSs was minimal.