U.S. Department of Transportation
Federal Highway Administration
1200 New Jersey Avenue, SE
Washington, DC 20590
202-366-4000
Federal Highway Administration Research and Technology
Coordinating, Developing, and Delivering Highway Transportation Innovations
 |
| This report is an archived publication and may contain dated technical, contact, and link information |
|
Publication Number: FHWA-RD-95-197
Date: December 1996 |
Development of Human Factors Guidelines for Advanced Traveler Information Systems and Commercial Vehicle Operations: Comparable Systems Analysis
CHAPTER 3. THE TravTek SYSTEM
The following section describes and evaluates the TravTek system with respect to its interface design process. The design of the TravTek user interface was the responsibility of General Motors Research Laboratories. Many of the views expressed in this chapter are derived from published works and recollections of the authors on the process of designing TravTek. In addition, some of the descriptive material on TravTek and ATIS functionality is summarized from Task C and Task F working papers. GENERAL SYSTEM DESCRIPTION AND OBJECTIVESUSER INTERFACETHE TravTek HUMAN FACTORS DESIGN PROCESSTravTek EVALUATION METHODOLOGYDATA FROM THE TravTek EVALUATIONLESSONS LEARNED
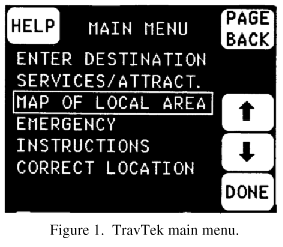
GENERAL SYSTEM DESCRIPTION AND OBJECTIVESThe TravTek demonstration project is the most comprehensive ATIS system fielded to date. As of the writing of this non-technical report (September 1993), the TravTek deployment and data collection phases have been completed, and the data analysis and reporting phases are ongoing. Limited empirical results are available for the TravTek study and will be cited in this section. These results provide unique insight into the usability and safety of the TravTek interface and the overall system effectiveness. The TravTek system was composed of three primary components: the TravTek Information Services Center (TISC), the Traffic Management Center (TMC), and the TravTek vehicles. The TISC was managed by the American Automobile Association (AAA) of Florida during the deployment phase and provided help-line functions by means of a cellular telephone link. Supplemental travel, accommodation information, and emergency road service were available to TravTek users via this communications channel as requested. In addition, the TISC supplied local business and services data, a special events database, and selected listings from the Central Florida telephone book yellow pages for in-vehicle use. The TMC collected and fused traffic information from several sources. These included historical travel times as a function of time of day; and dynamic times from roadway loop detectors, police reports, city reports of maintenance and road closures, and probes of travel times from TravTek vehicles. In the TravTek vehicle, there was a computer and a color CRT with an infrared touch screen. The CRT was positioned high on the instrument panel and to the driver's right. The navigation system used a combination of dead-reckoning, map-matching, and Global Positioning System information to track the vehicle's position. The TravTek Driver Interface has been created and developed to provide navigation, yellow pages, and roadway incident and traffic information to the driver (Fleischman, Carpenter, Dingus, Szczublewski, Krage, and Means, 1991). The design of this navigation system interface has as its primary objectives: (1) more effective driver navigation to save time and money, (2) easy access to valuable and convenient location information to alleviate stress and increase driving enjoyment, (3) maintenance of safe driving performance during system use and safety improvement facilitated by information for avoiding hazards and for emergency response, and (4) improvement of roadway efficiency to alleviate congestion. Drivers who used the TravTek-equipped vehicles in Orlando, Florida, had access to an information-rich environment in the vehicle. Functions available in the vehicle included navigation information, route guidance, real-time traffic information, and information on local services and attractions. As shown on the main menu screen (figure 1), drivers could choose to enter a destination, browse through information about local services and attractions, browse through maps of the local area, request emergency services, go through tutorial instructions, or correct the location of their vehicle on the map display.
The features provided by the TravTek system spanned at least some aspects of all four of the subsystems planned or anticipated for ATIS. Table 2 illustrates the functionality of the TravTek system in comparison to the functions proposed for ATIS/CVO. Note that 18 functions are addressed (to at least some extent) by the TravTek system.
Table 2. Comparison of TravTek functions with those from ATIS/CVO systems.
The goals, as well as the anticipated users of ATIS, are well represented by the TravTek system. Business travelers, recreational travelers, and local inhabitants were recruited as part of the TravTek demonstration. Therefore, the "lessons learned" from this project may well provide the richest source of information on ATIS to date.
USER INTERFACEIt is important to note that the original TravTek interface had to be modified to match the constraints of the vehicle in which it was installed. The 1992 Oldsmobile Toronado was chosen since it already had an in-vehicle display and a cellular phone installed as options. Therefore, many of the physical aspects and specifications described below are indicative of the vehicle design and are not necessarily intended to be taken as part of the TravTek system. General DescriptionVisual Information DisplayAuditory Information DisplayUser Input (Controls)Communications SystemsCognitive DemandsSystem Temporal Requirements
THE TravTek HUMAN FACTORS DESIGN PROCESSHuman Factors Design GuidelinesModification of Human Factors Guidelines: Fitting the System to the ConstraintsGuidelines Used in the Design of the TravTek Auditory Interface
TravTek EVALUATION METHODOLOGYGiven that selected evaluation data are available from the TravTek demonstration project, the majority of the lessons learned have come from the wealth of available evaluation data. To fully understand the value of this data for establishing design guidelines, one must first understand the magnitude of the TravTek evaluation program. As previously stated, the TravTek evaluation program currently is in the data analysis and reporting stages. The TravTek evaluation is an extensive program to test various aspects of the TravTek system, from performance of the technology to safety and human factors issues. As such, much of the data generated will be of great use to the development of ATIS guidelines. Some of the preliminary data are summarized in the following sections in a "lessons learned" format. However, much of the data presented are descriptive only and have not been subjected to inferential statistics. Therefore, the results should be interpreted with caution. To provide a full understanding of the scope of the TravTek evaluation in the context of the data presented in the following section, a description of the evaluation studies of interest to the human factors community (from Fleischman, 1991) is presented below. The TravTek evaluation was designed to address several levels of analysis. At the most macro level of analysis is the traffic network as conceived by many traffic managers and traffic researchers. The flow traffic within the network can be directed around stoppages or distributed over more of the network. However, in the case of an advanced driver information system such as TravTek, network efficiency is not improved by managing the flow of traffic in a direct way. Rather, the traffic is composed of drivers with different states of knowledge about possible routes, cyclical traffic patterns, and incidents. The hypothesis is that drivers who have the more precise, current information will use it to plan trips and to navigate more efficiently. If the system functions properly, the vehicle information system will calculate and inform drivers of routes that are more direct and/or that bypass traffic incidents. So, in a mature system with enough vehicles equipped with route and traffic information, the result should be a redistribution of traffic. The proposed benefits to the equipped drivers include improved trip times, avoidance of traffic congestion, and easier navigation to chosen destinations. The proposed benefit to non–equipped drivers is the increased flow through a traffic network relieved by the redistribution of equipped vehicles (Fleischman, 1991). At a micro level of analysis, the driver is an information processor and decision maker in a control loop with the vehicle that is nested in the TravTek system. The success of the system at the macro level depends on many assumptions about the system at the micro level (e.g., the driver and vehicle level of analysis). The following assumptions have been called out as hypotheses to be tested as part of the TravTek research (Fleischman, 1991):
Field Study With Rental UsersThe participants in this study were recruited by the American Automobile Association from club members who traveled to the Greater Orlando area. They rented TravTek vehicles through special arrangements with Avis. Seventy–five vehicles were used in the field study throughout the year of data collection. Each traveler participated for their normal planned length of stay in Orlando. All drivers participated in a questionnaire study and some were interviewed. Participants were divided into three groups: (1) Drivers in the "Navigator Plus" group had access to all of the navigation functions, real–time data communicated by the TMC, and service functions. Service functions are the maps and the services and attractions directory that are available only when the vehicles are in PARK and, also, the cellular telephone. (2) Drivers assigned to the "Navigator" group had access to all autonomous navigation and service functions, but no real–time data. (3) Drivers in the "Service" group had service functions only. This is the control group against which the others are compared. The control group vehicles were equipped with a TravTek in–vehicle navigation and data logging system, but it was to be transparent to the users. Data such as vehicle position, heading, speed, and stops were automatically time–stamped and logged. This division allowed the manipulation of the level–of–information variable and, therefore, an evaluation of TravTek benefits and costs by comparing data produced by driving "high–tech" vehicles with and without navigation or traffic information. The Navigator Plus and Navigator groups are needed to evaluate the incremental benefits associated with providing real–time data. Driver interaction with the TravTek system, such as key presses, were logged in the vehicle and are being sorted and analyzed to reveal which functions drivers used. The data can be sorted by subject and traffic factors by merging the vehicle log data with the TMC and User Profile log data. For example, how many drivers used route guidance? When they used route guidance, did they use the maneuver–by–maneuver screens, route maps, or voice? What did they use during peak versus off–peak traffic conditions? Did drivers of different ages make different choices?
Field Study With Local UsersThe field study with local users shares many of the aims of the rental car study, but it sampled a population of people who are familiar with the geography of the Orlando area. Two groups of drivers used Navigator Plus and Navigator vehicles for approximately 2 months. They were asked to assess the benefits of having the system functions compared with their usual means of negotiating the Orlando traffic network. This study was comparatively small, with 10 to 25 drivers at a time. An analysis of system use compared with the rental car study should reveal a more complete picture of how trip planning, navigation, and traffic information systems might be used by people purchasing the system for their own use and how that use may change with experience. All local users completed questionnaires (Fleischman, 1991).
Yoked Driving StudyThe Yoked Driving Study is a method of specifically testing the trip time savings and network efficiency objectives by studying the effects of TravTek on trip times and congestion avoidance. Hired drivers were assigned to Control, Navigator, and Navigator Plus groups. They were instructed to drive a series of origin–destination pairs. To control for weather and traffic conditions, a member from each group drove simultaneously from origin to destination. To facilitate the mapping of this study onto the Field Studies, origin–destination pairs were chosen to correspond to routes most likely to be traveled in the Field Studies. Additional pairs were also chosen to accommodate traffic/environmental variables (Fleischman, 1991).
Orlando Test Network StudyThe purpose of this experimental approach was twofold: (1) to learn if people do navigate more efficiently with the in–vehicle navigation information provided by TravTek, and (2) to test navigation performance and preferences as a function of navigation information display type. The Test Network was a network of possible routes between origin–destination (O/D) pairs. These routes encompassed a variety of highway types and conditions. They passed through system sensors and overlapped, to the greatest extent possible, with O/D pairs defined in the Field Studies and Yoked Driving Study. Navigation display types that were tested include: (1) hard–copy map, (2) maneuver–by–maneuver route guidance map, (3) moving map with route overlay, (4) moving information map, and (5) voice guidance. In addition, interactions with driver age, sex, and light conditions were studied (Fleischman, 1991).
Camera Car StudyA Camera Car Study provided detailed evaluations of: (1) how using the in–vehicle navigation displays affect driving performance (safety and navigation behavior) and (2) how easy the system is to use and to learn (human factors). A TravTek vehicle was equipped with video cameras focused on the driver, the driving scene, the display and controls, and the outside lane line. This instrumentation, along with the vehicle data log, experimenter observations, and driver debriefing, provided a rich array of driver attention, vehicle control, and usability and learning measures. Hired participants varied with respect to age, sex, and education level attained. The participants performed a series of tasks using the pre–drive functions available only in PARK, such as entering a destination; using the functions available while driving; and using the navigation functions. The drive tasks were performed while navigating the Orlando Test Network. Each driver used: (1) a hard–copy map, (2) a paper directions list, (3) a moving map with route guidance overlay, (4) a maneuver–by–maneuver guidance map, (5) voice guidance in combination with (3) above, and (6) voice guidance in combination with (4) above. The results of this study will help establish the relationship between eye glance measures and driving performance measures such as speed variance and lane excursions (Fleischman et al., 1991).
Questionnaire StudySubjective and attitudinal data were gathered by means of a single questionnaire distributed to all participants in the Field Studies with Rental and Local Users. Questions addressed most TravTek objectives and research questions. People rated attributes of the TravTek system such as system reliability, display readability and color quality, accuracy and usefulness of traffic information, overall user friendliness, usefulness for navigation, perceived safety benefits or costs, perceived time savings, and congestion avoidance. In addition, they answered market research questions about their willingness to buy a system with TravTek functions such as navigation, traffic reports, and services/attractions directory; under what circumstances, and for what price.
Debriefing and InterviewsDetailed driver preference, perception, and marketing data were collected through person–to–person interviews. A subset of participants in the Field Studies with Rental and Local Users were interviewed, and hired participants in the Yoked, Orlando Network, Camera Car, and TMC/Traffic Probe Studies were debriefed after their experimental drives.
Modeling and AnalysesData collected during the year of operation of TravTek are being analyzed to project the resulting effects to a mature system. Traffic simulation modeling that builds on the work of Van Aerde (Van Aerde and Krage, 1991) and market penetration modeling are being used to predict the consequences of a TravTek–like system for traffic network performance at several levels of market penetration. Potential environmental, economic, and community impact are being derived from the collected data. Analyses are being performed to investigate the implications of a TravTek–type system on safety (Burgett, 1991).
Global EvaluationThe Global Evaluation integrates the results of all individual TravTek Studies to provide evidence that TravTek met or did not meet its objectives. This is a macro evaluation that interprets the research results in the context of TravTek's stated claims and constraints. The global evaluation relates the results to those of similar ITS projects, such as Pathfinder (Farradyne Systems and Associates, 1989). The other purpose of the global evaluation is to assess TravTek as a cooperative project with public and private sector partners.
DATA FROM THE TravTek EVALUATIONA questionnaire item included in the TravTek post-experiment questionnaire was an overall rating from poor to excellent. Poor was designated as a "1" on the questionnaire and excellent was rated as a "6". Poor and Excellent were the only two anchor points provided. The mean response to this item was 5.2, indicating that overall, subjects found TravTek to be a very positive experience. UsabilitySafetyDisplaying Information in a VehicleEntering InformationCommunication Between Drivers and the TravTek Help DeskFindings From the TravTek Design Methodology
LESSONS LEARNED[TT 01] USER ACCEPTANCE OF TravTek SYSTEM WAS POSITIVE
[TT 02] PAPER MAPS REQUIRED MORE TIME COMPARED TO THE TravTek SYSTEM
[TT 03] ROUTE MAP WITHOUT VOICE LED TO GREATER TURNING ERRORS
[TT 04] TravTek USE DID NOT LEAD TO INCREASED ACCIDENT RATES
[TT 05] TravTek USE DID NOT LEAD TO AN INCREASE IN "NEAR MISSES"
[TT 06] TravTek USE DID NOT LOWER DRIVERS' PERCEPTIONS OF SAFETY
[TT 07] DISPLAY MODE DID NOT AFFECT NAVIGATION PERFORMANCE
[TT 08] BOTH ROUTE MAP AND GUIDANCE SCREEN WERE VALUED
[TT 09] VOICE GUIDANCE IS PERCEIVED AS VALUABLE
[TT 10] SYNTHESIZED SPEECH IS SOMETIMES MISUNDERSTOOD
[TT 11] VOICE AND DISPLAY FEEDBACK PREFERRED
[TT 12] DRIVERS ARE WILLING TO USE ALTERNATIVE ROUTES
[TT 13] MAP DISPLAYS ARE USEFUL EVEN WITHOUT DESTINATION–SPECIFIC ROUTING INFORMATION
[TT 14] MOTORIST SERVICES INFORMATION WAS HIGHLY RATED
[TT 15] HAZARD AND CONGESTION WARNINGS GET TEPID RESPONSE
[TT 16] ESCHEW TWO–PRESS TOUCHSCREENS
[TT 17] STEERING WHEEL BUTTONS WERE HIGHLY RATED
[TT 18] HELP DESK WAS HIGHLY RATED
[TT 19] HUMAN FACTORS AND SYSTEMS ENGINEERING TEAMS PLAYED A CRUCIAL ROLE IN TravTek's DESIGN
[TT 20] HUMAN FACTORS DESIGN TECHNIQUES WERE USEFUL
[TT 21] RAPID PROTOTYPING AND USABILITY TESTING WERE MOST USEFUL IN THE DESIGN PROCESS
[TT 22] TESTING THE SEMANTICS OF LABELS WAS VALUABLE
[TT 23] RESEARCH IS NEEDED ON DRIVER ATTENTION AND PERFOR– MANCE
[TT 24] USER TRAINING WAS NEEDED TO SUPPLEMENT SYSTEM DESIGN
[TT 25] DESIGN GUIDELINES WERE UTILIZED IN THE DESIGN PROCESS
[TT 26] CHARACTER SIZE GUIDELINES WERE USED
FHWA-RD-95-197
|