U.S. Department of Transportation
Federal Highway Administration
1200 New Jersey Avenue, SE
Washington, DC 20590
202-366-4000
Federal Highway Administration Research and Technology
Coordinating, Developing, and Delivering Highway Transportation Innovations
 |
| This report is an archived publication and may contain dated technical, contact, and link information |
|
Publication Number: FHWA-RD-96-143
Date: April 1997 |
Development of Human Factors Guidelines for Advanced Traveler Information Systems and Commercial Vehicle Operations: Definition and Prioritization of Research Studies
CHAPTER 3. EXPERIMENT 2Our analysis of the rating data is divided into four parts. First, we consider the criteria in table 3 one at a time. Second, we use a linear model to combine ratings on several criteria. Third, we perform a sensitivity analysis to determine the effects of imperfect weightings in the linear model. Fourth, we validate the combination model used.
METHODRESULTSDISCUSSION
METHODSubjects Forty–eight subjects, ranging from 18 to 75+ years of age, participated in this experiment (table 49). There were an equal number of males and females in each category. Each participant was paid $10 per hour, plus a cash bonus. All subjects were licensed drivers and familiar with driving in the Seattle area. Younger subjects were recruited from the University of Washington, while older subjects were recruited from local school, church, volunteer, and retirement groups. Only subjects who were deemed to be "familiar" or "very familiar" with common traffic routes in Seattle participated in the experiment. Also, subjects were required to have an active driver's license, and drive at least once per week. To determine subjects' driving experience, data was collected on the years living and driving in Seattle and on the mean miles driven annually. Table 49 shows that mean years living in Seattle ranged from 10.1 years for the 18 to 24 age group to 50 years for the over 75 age group. Mean years driving in Seattle ranged from 4.2 years for the 18 to 24 age group to 46.6 years for the 75+ age group. Finally, mean miles driven annually ranged from 8,125 miles for the 75+ age group to 13,125 for the 25 to 54 age group. Table 49. Age group and number of subjects for experiment 2.
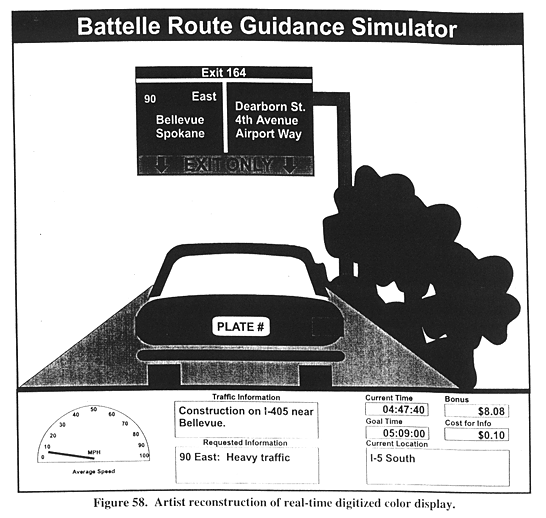
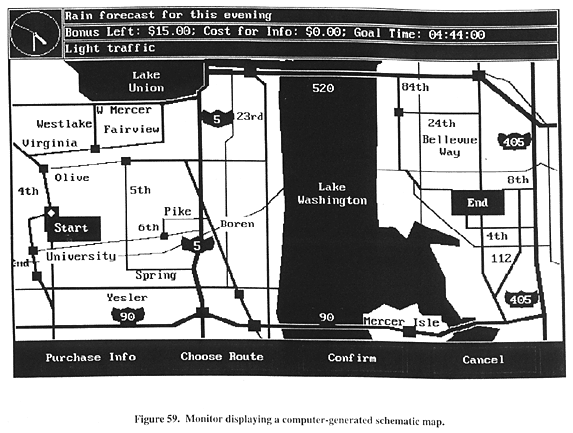
Apparatus This experiment used the Battelle Route Guidance Simulator (RGS). This simulator consists of two 486 computers and provides drivers with real–time video information and a schematic map of available routes. This video information is presented as a windshield view of the traffic scene. This allows the driver to experience real–time visual traffic images from the driver's seat perspective. To create the video information, a Sony camcorder was mounted on a tripod fixed beneath the rear view mirror of a 1979 Chevrolet Malibu. The camera recorded traffic scenes as the car drove along various links from the Westlake Center in downtown Seattle to the Bellevue Square Mall in Bellevue. The recorded traffic scenes were digitized and displayed using a Dell 466/T computer equipped with a 508 mm NEC monitor, a Video Logic digital video adapter, an Adaptec SCSI host adapter, three Fujitsu 1.2 gigabyte hard drives, an Ahead VGA adapter, and custom software. The schematic street map and subject input touch buttons were displayed using a second Dell 466/T computer equipped with a 14–inch Zenith VGA monitor, MicroTouch Systems touch screen and bus controller card, digital DECtalk voice synthesizer, and custom software. In addition to the RGS, the experiment used a variety of other materials. Appendix D includes copies of the eight questionnaires which were administered. The Subject's Familiarity With Driving in Seattle: Pre–Selection Phone Questionnaire (p. 267) was given to subjects in order to assess Seattle driving familiarity. Two questionnaires, Driver Demographic Characteristics Questionnaire (Phone) (p. 268), and Driver Demographic Characteristics (p. 270), were used to collect relevant subject demographic data. A set of questions, Trust & Self–Confidence in ATIS Technology (p. 274), collected subjective data pertaining to route guidance technology and self–confidence in one's own ability to navigate through Seattle. A series of questions titled Inter–Link Questions (p. 276), administered after each link, assessed subjects' rated trust in the route guidance system, self–confidence in their ability to accurately anticipate traffic conditions, and expectations of the traffic. A questionnaire, Modifying Your Trip to Avoid Traffic (p. 277), asked questions pertaining to the level of accuracy required from a navigation device. The questionnaire, Trust in the Route Guidance System (p. 279), asked subjects about the navigation system's technological trustworthiness. At the end a final questionnaire, Demonstration Fidelity (p. 282), was presented to solicit opinions regarding the simulation and demonstration. Battelle Route Guidance Simulator Overview The Battelle Route Guidance Simulator is a powerful research tool developed in order to investigate driver performance and behavior. The flexibility of the simulator's configuration allows experimenters to adjust and adapt parameters as needed. The simulator is designed to track a variety of performance measures (e.g., time to traverse a route). Subjects use the simulator by selecting a route from a computer–generated map on a touch screen and then view the real–time digitized traffic scene as if they were actually driving the route in their car. Displays and Controls The RGS consists of two computers linked to two monitors. One monitor displays real–time digitized video scenarios (figure 58) and the other monitor displays a computer–generated schematic map (figure 59). Together these monitors allow subjects to specify a route and "drive" from their originating location in the Westlake Center to their destination in the Bellevue Square Mall.
Figure 58 depicts a monitor display of the view one might have driving through Seattle. It shows a real–time video of Seattle roadways that correspond to the route specified by the subject. In addition to the view of the roadway, this monitor also provides a variety of other information. The simulator presents this information at the bottom of the screen (see figure 58) and it includes:
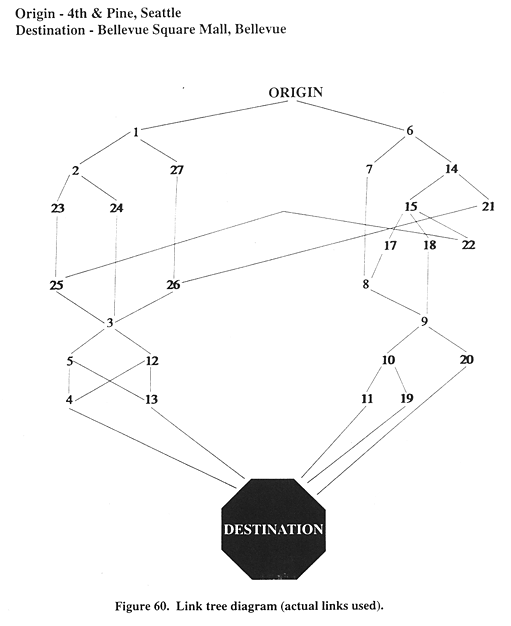
The second monitor displayed the computer–generated schematic map of all permissible routes. Using this map, outes were planned and monitored. Vehicle location en route was represented by the position of a moving blue dot. Since this screen was touch sensitive it also acted as an input device, enabling subjects to request traffic information and control their progress. Four touch–sensitive buttons labeled Purchase Info, Choose Route, Confirm, and Cancel (see figure 59) enabled subjects to collect traffic information about specific links in the street network and "drive" by selecting which links to traverse. Each request for traffic congestion information cost subjects $0.10 and provided them with the traffic density (heavy or light) for the specified link. Each route was broken into "nodes" and "links." Nodes are located at the beginning of every link and indicate a decision point where a link choice was required. A link is defined as one of several segments that make up a route. At nodes, subjects had the opportunity to select from one to three link choices, with two choices being the most common. On some links, however, decisions at nodes were not required as only one possible link could be selected. Thus, subjects could request traffic information, plan their routes, and select their route using the schematic map. At the same time, they could monitor the roadway, surrounding traffic, and speed on the second monitor just as they might do in an actual car. Street Network Structure and Bonus Calculation Figure 60 shows the tree structure of alternate routes. A total set of 26 links was used with each link varying in length from 1 to several streets. Twenty–nine different routes are possible between the origination, Westlake Center, and the destination, Bellevue Square Mall. As Lake Washington is a natural barrier between the origination and destination, the traveler is forced to cross one of two bridges. These routes traverse a variety of roads including congested city streets, four–lane State roads, and Interstates in an urban setting. Table 50 lists the links and corresponding travel times for the entire link set. Trips took approximately 22 min in light traffic and 37 min in heavy traffic.
Table 50. Link segments for experiment 2.
The goal of subjects in this experiment was to maximize the bonus awarded to them. This bonus depended on their ability to minimize the duration of the journey and avoid congestion. Delays associated with a poor route selection or the failure to avoid a congested link decreased the subject's bonus. At the beginning of the driving simulation, the maximum bonus amount was displayed to the subject. If the subject chose the shortest (optimal) route to the destination (and did not select any "heavy" traffic links), the bonus amount displayed reflected the starting bonus minus any amount spent to purchase link information. If the subject deviated from the shortest route, the bonus would decrease. Each link had an associated cost factor (see table 50). When a link was traversed, this cost factor was subtracted from the bonus amount. For links along the shortest route, these cost factors were zero. The overall effect was such that longer driving times from start to finish would yield a lower bonus amount. The cost factors were determined as follows. First, an arbitrary bonus amount was assigned to the longest time route. The difference between this bonus amount and the maximum bonus amount was divided by the time difference between the longest and quickest routes to yield a cost–per–delay time factor. The time for each route was determined. The difference between it and the shortest time route was multiplied by the cost–per–delay time factor to yield a penalty amount. This penalty amount was then divided up proportionally among its associated links (excluding any links belonging to the shortest time route). This proportional penalty was the cost factor. In addition to the penalty associated with selecting a non–optimal route, the bonus decreased when subjects encountered heavy traffic. Anytime a subject traversed a "heavy" traffic link, the remaining bonus amount was divided by two. This penalty was assessed after first subtracting the cost factor for that particular link. The bonus available at the start was $20. The cost factors were calculated so that taking the longest time route would cause the bonus amount to drop to $12 if no heavy traffic was encountered. Although a bonus was calculated for each of the four trials, only the highest bonus achieved was actually awarded to the subject. Traffic Congestion In order to examine driver behavior in various traffic situations, the RGS was designed with the capability to portray "light" traffic and "heavy" traffic, as well as intermediate levels of congestion. These were defined in terms of level–of–service (Transportation Research Board [TRB], 1992). Light traffic, level–of–service A, represents a free flow of traffic where individual drivers are unaffected by others present in the traffic stream. Heavy traffic was defined as level–of–service E or level–of–service F. Level–of–service E refers to operating conditions at or near capacity level in which all speeds are reduced to a low, though relatively uniform value. In level–of–service F, there is a forced breakdown of traffic flow. Queues occur and operations within a queue are characterized by extremely unstable stop–and–go waves. Three links of the street network contained "heavy" traffic. One link was a street leading up to a major thoroughfare. The second heavy traffic link was a stretch of road leading to one of the bridges. The third heavy traffic link was the other bridge. The presence of heavy traffic served two primary purposes. First, congested streets added reality to the traffic scenario. As in all major cities in the United States, Seattle is not without heavy traffic and traffic jams. Second, with the knowledge that heavy traffic may confront them, subjects were compelled to utilize the traffic information system. By accessing the up–to–date traffic information, drivers could potentially avoid links with heavy traffic, thereby minimizing their travel time. Independent Variables A mixed design with two between-subjects variables (AGE, GENDER) and three within-subjects variables (accuracy of traffic information, repetition of trials, link position) was used (table 51). Five age groups were recruited, as were equal numbers of males and females. Table 51. Summary of the independent variables.
Each driver traveled from Seattle to Bellevue four times. Drivers selected links and had the option of purchasing traffic information for any desired link. This information was manipulated to be accurate (i.e., heavy traffic reported and heavy traffic encountered or light traffic reported and light traffic encountered) or inaccurate (i.e., light traffic reported and heavy traffic encountered or heavy traffic reported and light traffic encountered). In the first two journeys (trials), subjects received traffic information from the navigation system that was 100 percent accurate. That is, 26 of the 26 available pieces of link information were accurate. In the third and fourth trials, only 77 percent of the information provided was accurate. In other words, only 20 of the 26 available pieces of information were accurate. However, as subjects controlled the path of the car, the actual accuracy that each subject experienced varied. Link position refers to the number and order of links selected in traversing the route. Subjects completed a minimum of five links and a maximum of eight links. Where subjects required more than five links to traverse the route, the middle links were averaged. Thus the term "middle link" in some cases may refer to just the third link if five links were selected, or the average of links three, four, five, and six if eight links were selected. Dependent Variables Table 52 summarizes the objective and subjective dependent variables measured throughout the experiment. A record of the links selected at each node was made in order to determine the route chosen. At each node, decision times were recorded for purchasing information, link selection, and link travel duration. Whether or not information was purchased for any given link was also logged. The bonus that subjects received for quick route completion refers to the end bonus achieved when penalties and information costs were subtracted. Both the total trip penalty costs and the information costs were recorded independently. The time to complete the route was the total time to get from origination to destination. This total time included decision, route selection, and travel times. Finally, calculated percent convergence with the baseline route refers to the amount of similarity between the links in the route traveled and the links in the baseline route. As a baseline, drivers indicated their preferred route prior to beginning the first of the four trials. The links for each route of the four trials were compared to the links in the baseline route. A calculation of the percent route convergence was made for each trial by counting the number of matching links between the trial and baseline routes. For example, on any given trial, a driver who had no matching links had zero percent route convergence. When there were six baseline links, a driver who had three links had a route convergence of 50 percent. A driver who precisely followed the baseline route had a route convergence of 100 percent. Table 52. List of dependent variables for experiment 2.
Trust in technology, self–confidence in navigation ability and traffic expectations were measured after each link via the questionnaire, Inter–link Questions (appendix D, p. 276). The three questions were rated on a 0–100 scale, and administered after every link. A new variable, trust minus self–confidence, was calculated from each inter–link administration by subtracting rated self–confidence from rated trust. This variable was created to examine subject's acceptance of automated control. Lee and Moray (1994) showed that when trust exceeds self–confidence operators accept automated control. Conversely, when self–confidence exceeds trust operators use manual control. Experimental Procedure In total, eight questionnaires were administered during the experiment. Table 53 shows the sequence in which they were administered Table 53. Sequence of questionnaires administered.
Background Questions and Instructions The initial screening of participant suitability was done by telephone. The Subject's Familiarity With Driving in Seattle: Pre–Selection Phone Questionnaire (appendix D, p. 267) and the Demographic Characteristics Questionnaire (Phone) (appendix D, p. 268) were administered at that time. The purpose of the Seattle driving familiarity questions was to ensure a homogeneous subject population in terms of Seattle driving knowledge and experience. Potential subjects who either did not have an active driver's license, were unfamiliar with driving in Seattle, or drove less than once per week in Seattle were eliminated from the subject pool. Those individuals who did have sufficient Seattle driving familiarity were asked a series of demographic characteristics questions and scheduled for a testing time. The demographic questionnaire was given during the telephone interview to reduce the amount of questions asked during the testing session. At the testing site, subjects filled out a written consent form and completed the questionnaire Driver Demographic Characteristics (appendix D, p. 270). The demographic information solicited at this time was of a sensitive nature (e.g., income) and, therefore, was not asked over the phone. The questionnaire Trust & Self–Confidence in ATIS Technology (appendix D, p. 274) was completed next. Subjects began the experiment by listening to instructions about their goal, task, computers, route choice, rewards, and costs. The drivers were instructed to plan and execute a trip from the Westlake Center to the Bellevue Square Mall on a Friday afternoon at 4:30 pm so as to arrive in the least amount of time possible. Subjects were told that heavier traffic density (congestion) typically resulted in longer driving times. Brief instructions were given about the computers and how to choose routes and purchase information. In addition to being paid $10 per hour, subjects had the opportunity to earn bonus money for quick route completion. This served to motivate subjects to use the route guidance system in order to avoid heavy traffic. Subjects could also incur travel expenses, which were deducted from a starting maximum bonus of $20. The expenses included purchasing information ($0.10); choosing a non–optimal link (approximately $1.50); and selecting a link with "heavy" traffic (existing bonus cut in half). After listening to the instructions, the two computer screens were presented. An explanation was given of the digitized windshield roadway view and of the schematic map with the four touch screen buttons labeled Purchase Info, Choose Route, Confirm, and Cancel. It was explained that Purchase Info allowed the subject to buy traffic information on the various links, and despite reducing the bonus, it might be beneficial to purchase information pertaining to upcoming links. In this way, heavily congested links might be avoided and those where the traffic was light could be selected. Prior to starting the simulation, drivers were given a conventional paper map. The map contained all possible route options that would be available during the driving simulator portion of the experiment and corresponded to the computer–generated map that would be used during the experiment. The experimenter pointed out the start (Westlake Center) and end points (Bellevue Square Mall), and the available route options were highlighted in orange. Using a red marker, subjects traced the route that they would prefer to take (baseline) at 4:30 pm on a Friday afternoon. No extra traffic information was provided during this baseline segment. The purpose of having subjects indicate their baseline preference route was twofold. First, providing a map helped to orient drivers with the area to be traveled. Second, this baseline data would later be compared to the actual routes traversed (i.e., percent convergence). Route and Link Selection Once the baseline route was recorded, subjects began the practice trial(s) to become familiar with the simulator. This practice trial was repeated until two criteria had been met. First, the subject, when asked, must have stated that he or she felt comfortable using the simulator, purchasing information, and choosing routes. Second, the subject must have demonstrated an ability to purchase information correctly, to choose a route successfully three consecutive times, and to complete at least one practice trial from start to finish. Having satisfied practice criteria, the four experimental trials were presented to each subject in the same order. Trials 1 and 2 presented 100 percent accurate purchased traffic information, while trials 3 and 4 presented 77 percent accurate purchased information. A trial began when the driver touched the touch screen. Once the touch screen was activated, the travel timer began and the driver could start purchasing link information and/or selecting links to traverse. If a driver wanted information on a particular link, he/she touched the Purchase Info button, touched the link, and then touched the Confirm button. Drivers could purchase link information as often as desired until all bonus money was gone. If a driver wanted to select a link to traverse, he/she would touch the Choose Route button, touch the link, and then touch the Confirm button. Also, a Cancel button was available allowing drivers to change a Purchase Info or Choose Route selection by pressing Cancel rather than Confirm. Three aspects concerning the dynamics of route and link selection require mention. First, there were 29 possible routes that a subject could choose in order to reach his/her destination. Each of these 29 routes had distinctive characteristics. For example, some routes were shorter distances but, as they meandered through residential areas, the driver's speed was low. Other routes were longer distances, but took the driver along Interstate highways where driving speeds were higher. Second, the number of links that made up each of the 29 possible routes also varied. For instance, some routes were made up of only five links. That is, the driver only had to choose five links to reach his/her destination. Other routes had as many as eight links and, therefore, required the driver to make eight link selections. The one optimal route that would take the driver to his/her destination in the least amount of time had seven links. Third, if links were diverging (two or more paths leading away from a node), the subject had to make a decision on which link to take. If he/she didn't, the simulator halted and waited for the subject to make this decision. This decision could have been made anywhere on the link that approached this decision point, but not before. This prevented the subject from making all the route decisions at one time. Once a link was selected and the driver's vehicle began traversing it, the driver became involved in monitoring three different dynamic displays. First, the traffic scene as it appeared out of the windshield was constantly changing. A digitized windshield roadway view of the traffic scene corresponding to each selected link was displayed in real time on the first monitor. Second, the dashboard type displays (i.e., the speedometer, traffic information box, requested information box, current time, bonus, and current location) were also continually changing on the first monitor. Third, a blue dot which represented the driver's car moved along the selected link as shown on the computer–generated map on the second monitor. All three of these displays provided the driver with an indication of performance. Just before each link had been traversed, the driver was asked to complete the questionnaire Inter–link Questions (appendix D, p. 276) consisting of three questions. Once completed, the process of purchasing and/or selecting links was repeated until the driver's destination was reached. The driver's bonus was noted at the end of the trial. The bonus, along with the other dependent measures, was also logged in a data file by the RGS. Sequence of Experimental Trials All drivers were involved in four trials. No breaks or pauses were taken at the completion of the first trial. At the end of the second trial, the simulation was paused and drivers were administered the questionnaires titled Modifying Your Trip to Avoid Traffic (appendix D, p. 277) and Trust in the Route Guidance System (appendix D, p. 279). At the completion of the third trial, no breaks or pauses were taken. At the end of the fourth trial, in addition to the questionnaires Modifying Your Trip to Avoid Traffic and Trust in the Route Guidance System, the questionnaire Demonstration Fidelity (appendix D, p. 282) was given. Each trial lasted approximately 30 min. All subjects completed the entire experiment in under 3 h. Breaks taken for personal reasons (e.g., restroom) were allowed between trials. Upon completion of the final questionnaire, the experimenter reviewed the four bonuses achieved and the highest was documented on a subject payment form. The experimenter then answered any questions the drivers had, the total payment for participation was calculated, and the drivers were escorted out of the building.
RESULTSThree objective dependent variables (information cost, penalty cost, and percent convergence of links traversed compared to the baseline route) and four subjective ratings dependent variables (trust in the route guidance system, self–confidence, expectations of traffic conditions, and a variable created from subtracting the self–confidence rating from the trust rating – trust minus self–confidence) were examined in the analyses. ANOVA tables are presented in appendix E (pp. 293–297). Drivers could traverse the route by selecting from five to eight links (most trips used six or seven links). In order to examine these routes collectively, the middle links for routes with six, seven and eight links were combined. In this way, all routes could be analyzed together as if there were five link positions for all routes. Additional analyses, not presented here, were also conducted separately for each route without combining middle links; no additional insights were revealed. Information Cost The four successive trials for each driver were analyzed as a 2 x 2 combination of accuracy and repetition (see table 54). Table 54. Analysis of trials: Cell entries are trial ordinal position.
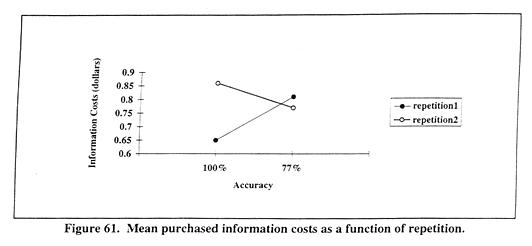
Figure 61 shows mean information cost, cost averaged across an entire trial, for each level of information accuracy as a function of repetition. For the 100 percent information accuracy trials, mean information costs were $0.65 for repetition 1 and $0.86 for repetition 2. For the 77 percent information accuracy trials, mean information costs were $0.81 for repetition 1 and $0.77 for repetition 2. An interaction between information accuracy and repetition indicates that as drivers went from the 100 percent information accuracy trials to the 77 percent information accuracy trials, the purchasing of information increased for repetition 1 and decreased for repetition 2, F(1,46) = 9.65, p < 0.01.
Figure 62 shows mean information cost for each level of information accuracy as a function of AGE. As can be seen, the AGE x information accuracy interaction did not prove to be significant, F(1,46) = 0.05, p > 0.05. Additionally, there was no significant effect of AGE, F(1,46) = 1.41, p > 0.05. This shows that older drivers purchased information as much as younger drivers. Therefore, any AGE effects cannot be attributed to the older drivers' lack of use of ATIS technologies. Penalty Costs Figure 63 shows mean penalty costs for each level of information accuracy as a function of AGE. For the 100 percent information accuracy trials, mean penalty costs were $8.48 for younger drivers and $10.86 for older drivers. For the 77 percent information accuracy trials, mean penalty costs were $12.37 for younger drivers and $11.92 for older drivers. An ANOVA indicated four significant results. First, older drivers incurred higher penalty costs than younger drivers, F(1,46) = 4.53, p < 0.05. Second, penalty costs increased when drivers received inaccurate information, F(1,46) = 32.42, p < 0.001. Third, an interaction between AGE and information accuracy shows that younger drivers incurred lower penalty costs during the 100 percent information accuracy trials, F(1,46) = 10.56, p < 0.01.
Fourth, a significant interaction between information accuracy and repetition (figure 64) shows that penalty costs increased as drivers went from the 100 percent information accuracy trials to the 77 percent information accuracy trials and that this increase was greater for repetition 2 than for repetition 1, F(1,46) = 5.03, p < 0.05.
Convergence Figure 65 shows mean percent convergence of links traversed compared to the baseline route as a function of information accuracy and AGE. Recall that 100 percent convergence consists of a driver precisely following the indicated pre–trial baseline route. Additionally, zero percent convergence consists of a driver deviating completely from the baseline route. For the 100 percent information accuracy trials, mean convergence was 48.8 percent for younger drivers and 52.7 percent for older drivers. For the 77 percent information accuracy trials, mean convergence was 30.7 percent for younger drivers and 33.6 percent for older drivers. Subjects were less likely to follow their baseline route in trials where the information received was inaccurate, F(1,46) = 11.93, p < 0.001.
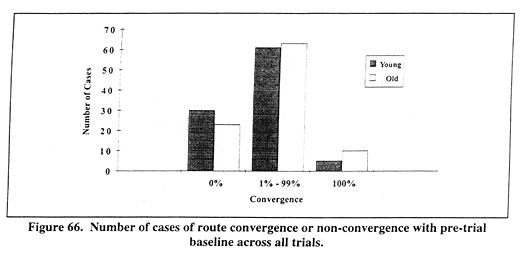
Figure 66 shows a frequency analysis of the number of cases of route convergence, partial convergence, and non-convergence with the pre-trial baseline across all trials for younger and older drivers. Zero and 100 percent convergence levels were chosen as they represent true endpoints. Younger drivers completely deviated from the baseline route (0 percent convergence) on 30 of 96 trials, while older drivers deviated on 23 of 96 trials. Younger drivers precisely followed their baseline routes (100 percent convergence) on 5 of 96 trials, whereas older drivers followed on 10 of 96 trials. Most trials showed partial convergence, with younger drivers following some of their baseline routes on 61 of 96 trials, while older drivers also followed some links on their baseline route on 63 of 96 trials. These differences in convergence were statistically reliable, F(2,92) = 63.2, p < 0.001.
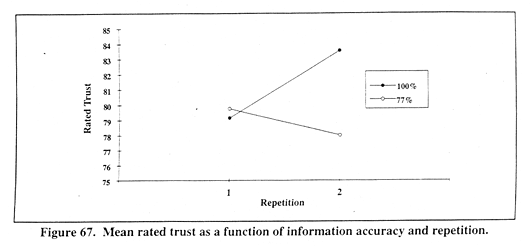
Trust in the Route Guidance System (Inter–Link) Figure 67 shows trust (rated on a scale from 0, low trust, to 100, high trust) in relation to repetition and information accuracy. For the 100 percent information accuracy trials, mean rated trust was 78.5 for repetition 1 and 83.9 for repetition 2. For the 77 percent accuracy trials, mean rated trust was 80.3 for repetition 1 and 78.8 for repetition 2. An ANOVA indicated five significant results. First, subjects rated trust in the route guidance system higher in repetition 2 than in repetition 1, F(1,46) = 6.21, p < 0.05. Second, figure 67 also indicates a significant interaction between information accuracy and repetition, F(1,46) = 22.5, p < 0.001. This interaction shows that when subjects go from repetition 1 to repetition 2, rated trust increased for the 100 percent information accuracy trials and decreased for the 77 percent information accuracy trials. Note that repetition 1 in the 77 percent accuracy trial is the first journey where drivers are given inaccurate information after being given completely accurate information in the previous two trials.
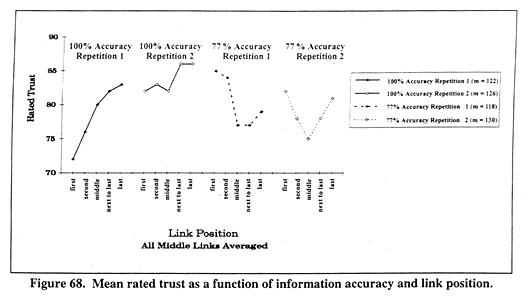
Third, an interaction between information accuracy and link position (figure 68) shows that trust continually increases, with each successive link, when drivers traverse the 100 percent information accuracy trials but decreases sharply when subjects are given inaccurate traffic information (in the middle links), F(1,46) = 16.12, p < 0.001.
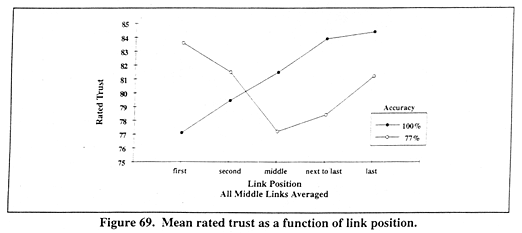
Fourth, figure 69 shows a significant effect of link position. On middle links, when subjects were given inaccurate information, rated trust of the route guidance system decreased, F(4,184) = 4.0, p < 0.01. Multiple t-tests were conducted to compare the middle link, when subjects received inaccurate information, to all other links (table 55). The middle link, where the inaccuracies occurred, was compared to each of the other four links. Across levels of information accuracy, only the second link in the 100 percent information accuracy trials and next-to-last link in the 77 percent information accuracy trials failed to differ from the middle link (p > 0.05). Fifth, figure 68 outlines a three-way interaction among information accuracy, repetition, and link position, F(4,184) = 6.11, p < 0.001. The parameter m indicates the number of links averaged in the middle link. Trust increased for the 100 percent accuracy trials and decreased for the 77 percent accuracy trials when inaccurate information was presented.
Table 55. Multiple t–tests for information accuracy: Middle links versus other links.
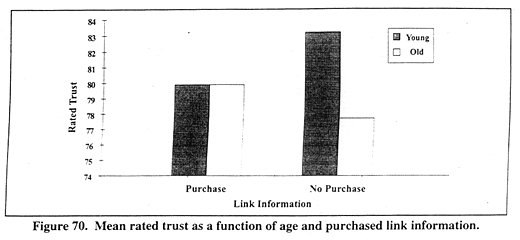
Figure 70 is a bar graph outlining mean trust ratings for younger and older drivers based on purchased link information. When information was purchased, mean trust ratings were identical (79.9) for younger and older drivers. When no information was purchased, mean trust ratings were 83.2 for younger drivers and 77.7 for older drivers. An ANOVA indicated a significant AGE effect, F(1,1260) = 5.13, p < 0.05, and a significant AGE x link information interaction, F(1,1260) = 9.01, p < 0.01.
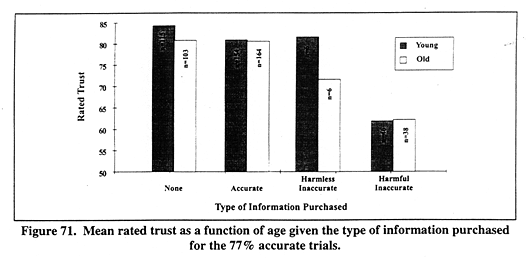
Figure 71 outlines mean trust ratings for younger and older drivers given the four types of information purchased during the 77 percent accurate trials: (1) no information, (2) accurate information, (3) harmless inaccurate information (told "heavy traffic" when really light traffic), and (4) harmful inaccurate information (told "light traffic" when really heavy traffic). When no information was purchased, trust ratings were 84.3 for younger drivers and 80.8 for older drivers.
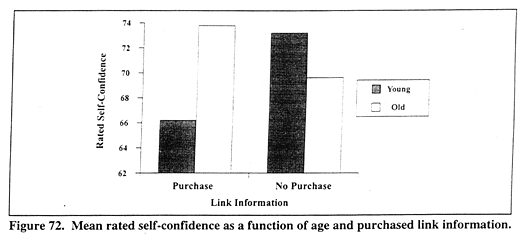
When the information purchased was accurate, mean trust ratings were 80.9 for younger drivers and 80.6 for older drivers. When drivers were told that the traffic was heavy when it was actually light, trust ratings were 81.6 for younger drivers and 71.6 for older drivers. And when drivers were told that traffic was light when it was actually heavy, trust ratings were 61.8 for younger drivers and 62.1 for older drivers. An ANOVA indicates a significant type of information purchased main effect, F(3,624) = 36.6, p < 0.001. Self–Confidence in Ability to Accurately Anticipate Traffic Conditions (Inter–Link) Figure 72 is a bar graph outlining mean self–confidence ratings for younger and older drivers on purchased link information. When information was purchased, mean self–confidence ratings were 66.2 for younger drivers and 73.8 for older drivers. When no information was purchased, mean self–confidence ratings were 73.2 for younger drivers and 69.6 for older drivers. An ANOVA indicated a significant AGE effect, F(1,1260) = 11.3, p < 0.001, and a significant AGE x link information interaction, F(1,1260) = 25.8, p < 0.001.
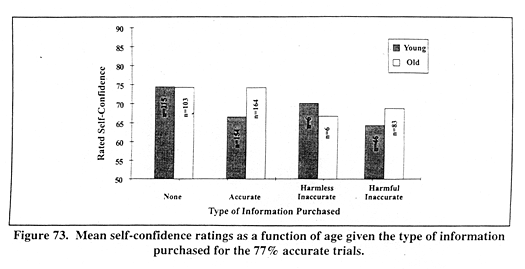
Figure 73 illustrates mean self–confidence ratings for younger and older drivers given the type of information purchased during the 77 percent accurate information trials: none, accurate, harmless inaccurate, harmful inaccurate. Self–confidence ratings significantly differed for older (68.8) versus younger (70.9) drivers, F(1,624) = 8.13, p < 0.01. Additionally, type of information purchased was significant, F(3,624) = 4.28, p < 0.01.
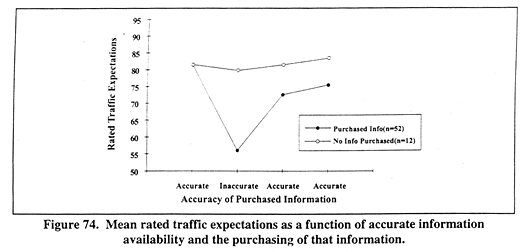
Traffic Expectations (Inter-Link) Figure 74 outlines mean rated traffic expectations for drivers as a function of the availability of accurate information and whether or not drivers purchased this information.
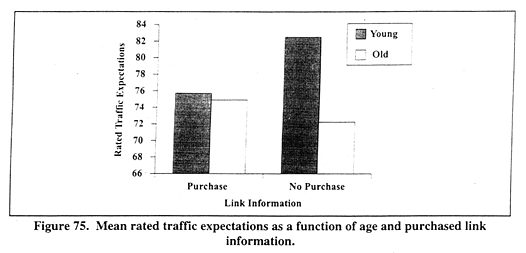
"Accurate" and "inaccurate" values along the abscissa indicate the accuracy of information following the sequence, from left to right, that drivers encountered. The "accurate" value on the far left represents accurate information links preceding inaccurate information links. The "accurate" value immediately preceding the "inaccurate" value represents accurate information links that directly followed inaccurate information links. Finally, the far right "accurate" value represents accurate information links that followed one link past the inaccurate information links. The most striking result occurred when drivers purchased inaccurate information. In this instance, drivers' expectations of the traffic conditions were dramatically reduced (56.1). In all other cases when accurate information was available, mean rated traffic expectations were high (ranging from 72.7 to 81.6). As illustrated in figure 74, a significant accuracy of purchased information effect was found, F(3,353) = 6.63, p < 0.001. Also, a Student–Newman–Keuls a posteriori test confirmed that the data point corresponding to drivers who purchased inaccurate information was significantly different from all other points (p < 0.05). Figure 75 shows the most typical sequence of links experienced by most of the subjects. Other sequences of links that were encountered can be found in appendix E (pp. 285–292). Figure 75 illustrates mean traffic expectations ratings for younger and older drivers based on purchased link information. When information was purchased, mean traffic expectations ratings were 75.7 for younger drivers and 74.9 for older drivers. When no information was purchased, mean traffic expectations ratings were 82.5 for younger drivers and 72.2 for older drivers. An ANOVA indicated a significant AGE effect, F(1,1260) = 14.95, p < 0.001, and a significant AGE x link information interaction, F(1,1260) = 16.5, p < 0.001.
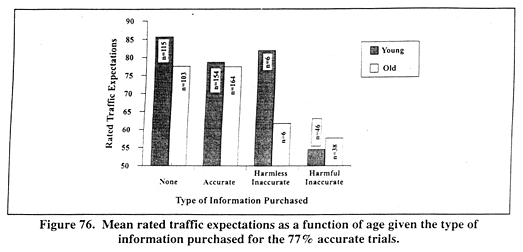
Figure 76 illustrates mean rated traffic expectations for younger and older drivers given the type of information purchased during the 77 percent accurate trials: none, accurate, harmless inaccurate, harmful inaccurate. When no information was purchased, rated traffic expectations were 85.7 for younger drivers and 77.4 for older drivers. When the information purchased was accurate, rated traffic expectations were 78.7 for younger drivers and 77.4 for older drivers. When drivers were told that the traffic was heavy when it was actually light, rated traffic expectations were 81.7 for younger drivers and 61.7 for older drivers. And when drivers were told that traffic was light when it was actually heavy, rated traffic expectations were 54.5 for younger drivers and 57.6 for older drivers. An ANOVA found significant effects of AGE, F(1,624) = 5.87, p < 0.05, type of information purchased, F(3,624) = 44.42, p < 0.001, and AGE x type of information purchased, F(3,624) = 3.51, p < 0.05. A Student–Newman–Keuls procedure found significant differences between the harmful inaccurate information purchased condition and all other levels of type of information purchased, and the accurate type of information purchased condition versus the none type of information purchased condition (p < 0.05).
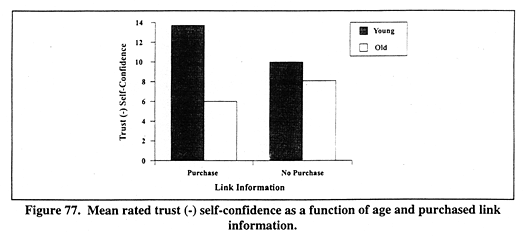
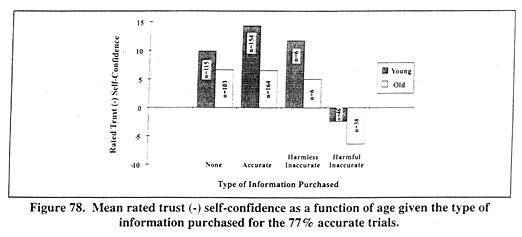
Trust Minus Self–Confidence Figure 77 depicts the post hoc dependent variable, trust minus self–confidence, that was created by subtracting the inter–link ratings of self–confidence from trust. This variable is shown for younger and older drivers as a function of link information.
When information was purchased, mean rated trust (–) self–confidence was 13.7 for younger drivers and 6.0 for older drivers. When no information was purchased, mean rated trust (–) self–confidence was 10.0 for younger drivers and 8.1 for older drivers. An ANOVA indicated a significant AGE effect, F(1,1260) = 27.3, p < 0.001, and a significant AGE x link information interaction, F(1,1260) = 6.48, p < 0.001. A t–test was conducted on the AGE x link information interaction means. Significant differences were found between purchase and no purchase conditions for both older drivers (t[1260] = 2.80, p < 0.01) and younger drivers (t[1260] = 4.93, p < 0.001). Mean rated trust (–) self–confidence is also shown for younger and older drivers given the type of information purchased during the 77 percent accurate trials: none, accurate, harmless inaccurate, harmful inaccurate (figure 78). When no information was purchased, rated trust (–) self–confidence was 9.9 for younger drivers and 6.6 for older drivers. When the information purchased was accurate, rated trust (–) self–confidence was 14.3 for younger drivers and 6.5 for older drivers. When drivers were told that the traffic was heavy when it was actually light, rated trust (–) self–confidence was 11.7 for younger drivers and 5.0 for older drivers. And when drivers were told that traffic was light when it was actually heavy, rated trust (–) self–confidence was –2.4 for younger drivers and –6.4 for older drivers. An ANOVA indicated main effects of AGE, F(1,624) = 12.7, p < 0.001, and type of information purchased, F(3,624) = 12.2, p < 0.001. Student–Newman–Keuls multiple comparison tests found that the harmful inaccurate information purchased condition differed from all other conditions (p < 0.05).
DISCUSSIONObjective Measures of Driver Behavior The first question to be asked about any ATIS device is "Will people use it?" Results clearly show that subjects diverged from their baseline routes which they would use in the absence of real–time traffic information (figure 65). Thus, at least for the present simulated route–guidance ATIS, one must conclude that driving choice–behavior was influenced by presented information in most of the cases. There was only a small number of cases (7.8 percent) where drivers followed their baseline routes. This is consistent with the expectation that using real–time video to show actual traffic would be an effective way to simulate an ATIS device. Of course, validation of any simulator requires field testing and this is planned for the last year of this research project. The second question asked about the route guidance ATIS concerns its reliability. When information was 100 percent reliable, the simulated ATIS allowed drivers to reduce their penalty costs versus the condition where it was 77 percent reliable (figure 64). However, drivers continued to purchase information even when it was unreliable (figure 62). Drivers using an unreliable ATIS were more likely to depart from their baseline routes (figure 65) instead of reverting back to known links. One possible explanation for this interesting result is that once having departed from the baseline origin links, drivers were not able to return to the baseline in mid–journey. Indeed, since the present simulation contained only one–way links, drivers wishing to return to the origin to start over again could not do so. Future research with two–way links might prove worthwhile to determine what proportion of "disappointed" drivers might journey backwards to regain their baseline route when frustrated by unexpected heavy traffic. It is clear that drivers will continue to use a simulated ATIS that is degraded from 100 percent to an average reliability of 77 percent. This optimistic finding suggests that real–world ATIS devices do not have to be perfect to be useful. The following section interprets the driver's subjective feelings about using the simulated ATIS device. Subjective Measures of Driver Behavior It is reasonable to postulate two opposing hypotheses about driver decision–making in the RGS. A Skinnerian model, based upon learning theory and operant conditioning, would predict that a single instance of faulty information might be sufficient to keep drivers from trusting automation. This is called one–trial extinction in learning theory. An example might be putting additional money into a vending machine that failed to produce an output. In contrast, a Bayesian model would predict graded responses to automation unreliability. Trust would vary, both up and down, in accordance with previous history that extended more than one trial back in time. The Bayesian model better matches driver behavior in this experiment. Trust in this new machine started out at a moderate level and then increased during the second repetition (figure 67). After the third trial where inaccurate information was presented, trust decreased back to the initial level and continued to decrease slightly on the fourth trial where more inaccurate information occurred. This general picture is confirmed when data are examined at a more micro level, from link to link (figures 68 and 69). Links providing accurate information increase trust and those providing inaccurate information decrease rated trust. This is true even when accurate information follows inaccurate information. The subsequent accurate information tends to restore trust lost during prior links where information was inaccurate. It seems reasonable to expect that the decision to purchase traffic information be related to trust. Drivers would not be expected to buy information if they did not trust the ATIS device. However, results (figure 71) showed that trust was unchanged when no information was purchased versus purchasing accurate information or harmless inaccurate information (being told that traffic was heavy when it turned out to be light). This outcome could be attributed to the low cost of an information purchase ($0.10) in the experiment; future research needs to increase this cost. However, even with this low cost, trust declined substantially when harmful inaccurate information was purchased (figure 71). An operator's use of automation is moderated by both trust and self–confidence (Lee & Moray, 1991). The higher the difference of self–confidence subtracted from trust, the more likely it is that automation will be used. Negative values can indicate problems with automated systems. When harmful inaccurate information is provided, trust minus self–confidence became negative (figure 78). Harmless inaccurate information did not alter this difference. It was clear that not all inaccurate information had the same effect upon the driver's subjective opinion. Harmless inaccurate information was tolerated with no ill effects. It appears that the ATIS device is not castigated for providing inaccurate information so long as that information does not inconvenience the driver. However, harmful inaccurate information has a strong negative effect upon the driver's trust in the system. This result has important implications for the kind of unreliability that drivers will tolerate in route guidance ATIS devices. Effects of Aging Before interpreting the interesting aging effects obtained in experiment 2, it is prudent to caution that in a cross–sectional study, aging effects are confounded with cohort effects. It is not possible to determine from this study if the effects reported here are due to (a) the aging process, or (b) the different set of experiences shared by the older cohort relative to the younger cohort, or (c) both of these. Younger drivers are more adept at learning/using the route guidance system (figure 63). When information is 100 percent reliable, they incur smaller penalties. When information is inaccurate, younger drivers perform at the same level as older drivers. This latter finding may represent a ceiling effect whereby younger drivers do not have access to sufficient good information to perform better than older drivers. One might speculate that older drivers do worse because they choose not to use the system as much as do younger drivers. For example, perhaps older drivers are more frugal and do not wish to purchase information as much as do younger drivers. However, results (figure 62) show statistically equivalent patterns of information purchase for younger and older drivers. Therefore, this speculation is not supported. Similarly, both cohorts exhibited identical patterns of convergence (figure 65) so that rigid adherence to route baselines is not an explanation for the higher penalties incurred by older drivers. A very interesting difference in trust patterns emerged for the two cohorts. Younger and older drivers exhibited equal trust for links about which information was purchased (figure 70). But trust decreased for older drivers for links where no purchase was made, while younger drivers showed increased trust for those links. It appears that younger drivers did not need to purchase information if rated trust was high. However, when older drivers did not buy information, their rated trust was lower. A similar pattern of results was obtained for rated traffic expectations (figure 75). For older drivers, self–confidence was higher for links where information was purchased, whereas the opposite result was obtained for younger drivers (figure 72). Younger drivers had greater trust minus self–confidence differences, which is consistent with a preference for automated technology in younger cohorts (figure 77). Younger drivers had higher difference scores when they purchased link information, while older drivers had higher scores when they did not purchase link information. The subjective data considered together suggest that the purchase of information is either motivated differently or produces different feelings for the two cohorts. Perhaps younger drivers use the ATIS depending first upon their subjective feelings, while older drivers use the ATIS system to alter their subjective feelings. This speculation implies that younger drivers use internal states to control their use of automated systems, while older drivers use the system to modify their own internal states. If true, this hypothesis has important design implications. Conclusions The present results demonstrate that the RGS is a useful tool for investigating driver acceptance of an ATIS device. Drivers do not demand perfect information from an ATIS device. Even unreliable information is purchased. Of course, before broad generalizations from this result can be drawn, additional research is needed to vary the reliability of the information as well as the cost. Previous research (Bonsall & Parry, 1991) has shown that the quality of advice determines driver acceptance of that advice. The present research did not vary the quality of advice parametrically beyond two levels (100 percent versus 77 percent accuracy). Even so, the present finding that harmful inaccurate advice influences drivers differently than harmless inaccurate advice is important and likely to be maintained as ATIS reliability is varied. However, the tolerance of harmless inaccurate advice may change when the cost of information is increased. Drivers may resent paying large sums of money for inaccurate information and this could color their acceptance of ATIS devices. This hypothesis will be tested in future experiments in task K. It is important to realize that the present results are based upon a real traffic network and used experienced drivers who were familiar with the Seattle area. Bonsall and Parry (1991) used an artificial network and found that acceptance of advice generally decreased as familiarity with the network increased. This suggests that in a more realistic setting, such as the present experiment, drivers should be more resistant to accepting information. However, our results showed that most drivers diverted from their baseline routes indicating a general acceptance of traffic information. This comparison may indicate a lack of generalizability from studies that use artificial traffic networks. Finally, it should be noted that the present experiment did not provide route guidance. While drivers did get traffic information, the simulated ATIS device did not offer suggestions for alternate routes as has been done in previous research (Allen, Stein, et al, 1991; Bonsall & Parry, 1991). This is an obvious area for future research. The present research was aimed at driver acceptance of unreliable information. Future research using the RGS will also investigate design issues incorporating route guidance. For example, one might vary the traffic information presented and route guidance simultaneously by having suggested routes go through areas of projected different levels of traffic congestion. It is questionable whether drivers will accept advice that routes them through heavy traffic areas, even when the system advises that this would be shorter than taking less congested minor arterials. The realism of the RGS with its real–time video of traffic should help to answer this and other related questions.
FHWA-RD-96-143
|
|||||||||||||||||||||||||||||||||||||||||||||||||||||||||||||||||||||||||||||||||||||||||||||||||||||||||||||||||||||||||||||||||||||||||||||||||||||||||||||||||||||||||||||||||||||||||||||||||||||||||||||||||||||||||||||||||||||||||||||||||||||||||||||||||||||||||||||||||||||||||||||||||||||||||||