Rural Public Transportation Technologies: User Needs and Applications FR1-798
DATABASE DESCRIPTION
This section describes the geometric design, traffic volume, and accident
history variables that were available in the existing Washington data base or that were derived from other State records. These data were available for the statistical analyses that are reported
in section 5 of this report.
Variables Available in the Washington State Database
Existing data files of geometric design and traffic volume data for ramps and
speed-change lanes in the State of Washington were obtained for this analysis from the FHWA
Highway Safety Information System (HSIS). A file of traffic volumes on mainline freeways was also
obtained. These files were originally assembled by the Washington State DOT for their own use
and, after careful data review and conversion to Statistical Analysis System (SAS) data sets, were
included in the HSIS. The geometric and traffic volume data included in this study were for the year 1993, and the accident data were for the years 1993 through 1995, inclusive.
Table 5 presents a list of all relevant variables, such as geometric design features, traffic volume data, and other related factors from the existing Washington data base that were considered
in the statistical analyses. Some of these variables were available directly in the
existing data base and others were derived or calculated from the available data. For example, the total length of a ramp and its adjacent speed-change lane was not directly available in the existing data base, but could be computed from available milepost data. The speed-change lane length used in the study was the length from the gore point to the end of the taper where the speed-change lane joins the mainline freeway as shown in figure 3. The American Association of State Highway and Transportation Officials (AASHTO) design policies for speed-change lanes involve
distances designated as the acceleration length and deceleration length, which do not include the mainline taper, but may include a portion of the ramp proper. The acceleration and deceleration lengths for speed-change lanes could not be determined from the available data. The analyses in this study were based on the physical lengths of speed-change lanes from the end of taper (where taper meets edge of travel-lane) to painted gore point.
The structure of the existing Washington geometric design file was such that each data record in the file represented a segment of a ramp or speed-change lane with homogeneous geometrics. In other words, the geometrics of each ramp and speed-change lane were documented by a series of roadway segments, each of which represented a portion of the ramp or speed-change lane with homogeneous geometrics. Whenever the value of a key geometric variable changed, a new segment began in the data base. In addition, a new segment generally began at the gore area where a ramp and a speed-change lane joined one another, wherever one ramp merged with or diverged from another, and at administrative boundaries such as county lines or city limits.
Table 5. Variables Available in the Existing Washington
Data Base for Ramps and Speed-Change Lanes
Geometric Design Features
- Ramp type (on-ramp/off-ramp)
- Number of lanes
- Surface width (ft)
- Right shoulder type
- Right shoulder width (ft)
- Left shoulder type
- Left shoulder width (ft)
- Ramp or speed-change lane segment length (mi) for segments with homogeneous cross sections
- Ramp length (mi)
- Speed-change lane length (mi)
|
Traffic Volume Data
- Annual average daily traffic (veh/day) for ramp or speed-change lane
- Annual average daily traffic (veh/day) for adjacent mainline freeway
|
| Other Related Data
|
A review of the existing geometric design and traffic volume files found that
they could not be used directly for statistical modeling of the relationships between ramp geometrics and traffic accidents. The limitations that prevented such analyses are as follows:
- No data were available to identify which segment boundaries represented points at
which ramps merged with or diverged from other ramps. Without such data, it was not possible to determine whether the available traffic volume data represented the ramp as a whole or only a
portion of the ramp.
- No data were available to distinguish which segment boundaries represented gore area
locations at which ramps and speed-change lanes joined one another.
- No available surface width data represented the total traveled way width for ramps and
speed-change lanes without curbs. However, where a curb was provided outside the shoulder for
drainage reasons, the surface width variable then represented the sum of the traveled way
and shoulder widths. Thus, where curbed sections were present, it was not possible to
determine the traveled way or shoulder widths explicitly.
- No data were available to identify the basic configuration of each ramp (e.g., diamond,
parclo loop, free-flow loop).
It was found that these deficiencies could be remedied through a manual review of the data records in the existing files and through review of interchange diagrams that had been prepared by the Washington State DOT for use in coding accident locations on ramps. The variables from these data sources are described in the next section.
Table 6 identifies the accident descriptors that were available for each ramp or speed-change lane accident from the existing Washington ramp accident file. Each accident record included a milepost that allowed the location of the accident along the ramp or speed-change lane to be determined and allowed that accident to be linked to the geometric data for a particular
ramp or speed-change lane segment.
Previous | Table of Contents | Next | Top
Additional Variable Obtained From Review of Interchange Diagrams
The interchange diagrams used by the Washington State DOT in coding accident locations were reviewed to obtain additional data of interest to the safety analysis. Figure 4 illustrates a typical interchange diagram. The following data were obtained from manual review of the existing data base and from review of the interchange diagrams:
- Each ramp or speed-change lane segment was classified as one of the following segment types:
-
- conventional decleration lane
- deceleration lane with mainline lane drop
- conventional acceleration lane
- acceleration lane with mainline lane addition
- ramp proper
- two-way ramp proper segment (i.e., opposite directions of travel divided only by double yellow centerline)
- merge area on ramp [i.e., merge between two ramps or between a ramp and a collector/distributor (C/D) road]
- diverge area on ramp
- weaving area on ramp (i.e., combined merge and diverge area)
- This process required identification of the locations of gore areas, merge points, and diverge points on the ramps.
- Based on comparisons of the interchange diagrams and a printout of the geometric data,
adjacent segments with the same segment type and identical (or nearly identical) geometrics were
identified so that they could later be combined into longer segments.
- Based on comparisons of the interchange diagrams and a printout of the geometric data,
the traveled way and shoulder widths were determined for each segment identified as having a curbed cross section. Generally, it was possible to match the combined traveled way and shoulder width of the curbed section with the combined traveled way and shoulder widths of adjacent non-curbed sections, one or more of which were often identical. Once the traveled way width was available, the average lane width on each ramp segment could be computed as the traveled way width divided by the number of lanes.
Table 6. Accident History Variables Derived From
Washington State Accident File
- Total accidents for all 3 years combined
|
- Total accidents in calendar year 1993
- Total accidents in calendar year 1994
- Total accidents in calendar year 1995
|
- Total accidents for each calendar year by severity level:
- fatal accidents
- injury accidents
- property-damage-only accidents
|
- Total accidents for each calendar year by location with respect to interchange features:
- within specific ramp segments
- within the limits of specific ramps
- within the limits of specific speed-change lanes
|
- Total accidents by calendar year and by accident type:
- Single-vehicle non-collision accidents:
- ran-off-road
- overturned in road
- other single-vehicle non-collision accident
- Single-vehicle collision accidents:
- collision with parked vehicle
- collision with train
- collision with pedestrian
- collision with bicycle
- collision with animal
- collision with fixed object
- other single-vehicle collision
- Multiple-vehicle collision accidents:
- head-on collision
- sideswipe collision
- rear-end collision
- angle collision
- right-turn collision
- left-turn collision
- other multiple-vehicle collision
|
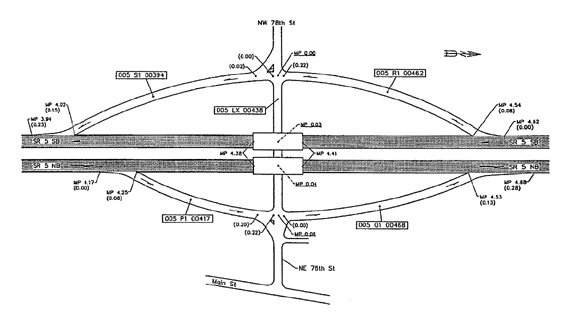
Figure 4. Typical Interchange Diagram Used to Determine Relationships Between Interchange Elements
- The configuration of each ramp was noted from the interchange diagrams in the following categories:
- diamond
- parclo loop
- free-flow loop
- out connection
- direct connection
- semi-direct connection
- buttonhook
- slip ramp to parallel one-way frontage road
- slip ramp to parallel two-way frontage road
- collector/distributor (C/D) road
- other ramp configuration
- Figures 1 and 2 illustrate these various ramp configurations and the interchange configurations in which they occur
- The nature of the beginning and end points of each ramp was noted using the following categories:
- being/end taper on mainline freeway
- painted gore on mainline freeway
- physical gore on mainline freeway
- other point on mainline freeway
- begin/end taper on mainline freeway (with different route number than ramp)
- painted gore on mainline freeway (with different route number than ramp)
- physical gore on mainline freeway (with different route number than ramp)
- other point on mainline freeway (with different route number than ramp)
- begin/end taper on another ramp or C/D road
- painted gore on another ramp or C/D road
- physical gore on another ramp or C/D road
- other point on another ramp or C/D road
- crossroad intersection with stop sign or signal
- crossroad intersection with free-flow connection
- connection to parallel two-way frontage road
- connection to parallel one-way frontage road
The data reduction from interchange diagrams was completed for all 1,405 ramps on the Interstate system, which includes approximately 69 percent of all ramps in Washington. The 641 ramps located on non-Interstate freeways and on arterial highways were not included in the analyses conducted.
Table 7 presents a list of the additional analysis variables that were obtained from manual review of the existing data base and from review of the interchange diagrams. These variables were
added to the existing SAS files of ramp and speed-change lane data.
Table 7. Additional Variables Obtained From Review of
Data and Interchange Diagrams
Geometric Design Features
- Ramp segment type
- Ramp configuration
- Traveled way width (ft) (corrected for curb sections)
- Average lane width (ft)
- Right shoulder width (ft) (corrected for curbed sections)
- Left shoulder width (ft) (corrected for curbed sections)
|
Previous | Table of Contents | Next | Top
Additional Variables Obtained From Washington State DOT Records
At a later stage of the project, several additional analysis variables were obtained from existing records of the Washington State DOT. These additional variables, summarized in table 8, included:
- The radii of the horizontal curves on each ramp, determined from a review of aerial
photographs of the highway system maintained by the Washington State DOT. These aerial photographs were taken at an approximate scale of 1 :400 . These data were obtained for a sample of approximately 200 urban diamond, parclo loop, free-flow loop, and outer connection off-ramps.
- The grades on each ramp were classified as either upgrades or downgrades from review of the interchange diagrams compiled by the Washington State DOT to determine whether the crossroad
facility at the interchange went over or under the mainline freeway. These data were obtained for all ramps on the Interstate system in Washington.
- The annual average daily traffic (AADT) volume of the mainline freeway section adjacent
to each speed-change lane was determined from an existing computer file of mainline freeway
traffic volume by matching the ramp and mainline freeway mileposts. The mainline freeway AADT
used in modeling was the one-way AADT in the direction of travel for the ramp in question,
estimated as half of the two-way AADT for the mainline freeway.
Table 8. Additional Variables Obtained From Review of
Other Highway Agency Records
Geometric Design Features
- Minimum raius of any horizontal curve on the ramp
- Horizontal alignment index (curviness) for the ramp based on equation
(1)
- Horizontal alignment index (curviness) for the ramp based on equation
(1), using an exponent of 1.0 rather than 1.5 for the D(i) term
- General grade of ramp (upgrade, downgrade)
|
Traffic Volume Variables
- Annual average daily traffic volume of the mainline freeway section
adjacent to speed-change lane (veh/day)
|
For the sample of 200 ramps discussed above, data on the radius of each horizontal curve on the ramp were obtained from the aerial photograph of the interchange. The alternative measures of the horizontal curvature or curviness of each ramp were considered in statistical analyses.
These were:
- Alternative 1—The smallest radius of all horizontal curves on the ramp.
- Alternative 2—The horizontal alignment index (curviness) of the ramp based on the following
equation used in previous work by Bared and Vogt:
H=(1/Ln) (å (D1)1.5 lhi (1)
where:
H = horizontal alignment index
Ln = total length of ramp, including horizontal curves and tangents in hundreds of feet
Di = degree of curvature for the ith horizontal curve [change in angular heading per 31 m (100 ft)]
lhi = length of ith curve (in hundred of feet)
- Alternative 3—The same equation for horizontal alignment index shown in equation (1), but with the coefficient of the Di term set equal to 1.0, rather than 1.5.
Appendix A defines each of the variables in tables 5, 7, and 8 as continuous or categorical and defines the units of each continuous variable and the levels of each categorical variable.
Previous | Table of Contents | Next | Top
|


