U.S. Department of Transportation
Federal Highway Administration
1200 New Jersey Avenue, SE
Washington, DC 20590
202-366-4000
Federal Highway Administration Research and Technology
Coordinating, Developing, and Delivering Highway Transportation Innovations
 |
| This report is an archived publication and may contain dated technical, contact, and link information |
|
Publication Number: FHWA-HRT-04-133
Date: December 2005 |
||||
Enhanced Night Visibility, Volume II: Overview of Phase I and Development of Phase IIPDF Version (687 KB)
PDF files can be viewed with the Acrobat® Reader® CHAPTER 5—ACTIVITY 4. EXPANDED COST-BENEFIT ANALYSISA thorough economic analysis of UV–A and fluorescent technology is greatly needed. Analyses conducted to date, although valuable, have not considered all the variables that can affect a cost-benefit outcome. For example, the Center for Applied Research®, Inc. (CFAR) performed an analysis that focused on the percent reduction in crashes required to recover the increased cost of fluorescent roadway delineation and auxiliary UV–A headlamps.(1) CFAR computed estimated costs of implementing the UV–A and fluorescent technology and compared them to potential cost reductions from crashes avoided by using UV–A and fluorescent technology. CFAR did not consider all variables associated with a crash such as visibility condition, road type, driver age, and rural versus urban driving conditions. Without examining these factors, it is not possible to accurately determine which accidents could be avoided with the UV–A fluorescent technology and which would be unavoidable regardless of the technology. The research team planned to conduct a thorough economic analysis of UV–A and fluorescent technology. This was to occur through nine tasks conducted as part of five major analyses:
TASK 4.1: CONDUCT DATABASE ANALYSES TO ESTIMATE THE CURRENT COST OF CRASHESThe purpose of this analysis was to classify the types of crashes whose frequency and severity could be reduced by the use of UV–A headlamps and fluorescent markings. The team was to examine national crash databases to identify these crash types. The first phase of this analysis was to involve developing a list of variables available from the databases. These variables were to be used to define relevant crash types. The list included, but was not limited to, the following variables:
Some potential crash types include the following variables:
During this phase, it would be necessary to conduct some exploratory analyses to determine if there were sufficient crashes to analyze for each crash type. This would have affected the identification of crash types and determined how many years of data should have been used from each database. After all of the relevant crash types were identified, the process of estimating the cost of these types of motor-vehicle crashes was to begin. The cost would be defined in terms of injury incidence and severity, vehicle damage, and other relevant factors (e.g., the number of working days lost, type and length of medical care, and so on). These cost-determining factors were to be extracted from both nonfatal and fatal motor-vehicle crashes. The results of the database analysis were to determine the cost of motor vehicle crashes. This information was to be incorporated into data reflecting the cost of installing and maintaining UV–A and fluorescent technology. These cost data were to be compared to the calculated benefit data to determine the cost-benefit ratio of UV–A and fluorescent technology. TASK 4.2: DETERMINE UV–A HEADLAMP UNIT, OPERATING, AND MAINTENANCE COSTSTask 4.2 asked the researchers to determine the unit cost of making and installing UV–A headlamps in new vehicles, the unit cost of retrofitting existing vehicles, and the additional operating and maintenance costs (if any) that UV–A headlamps will impose on the automobile owner-operator. This task was to use information from activity 1. Initial answers to this task were to depend on engineering estimates from the headlamp manufacturers. The experience that the vehicle team was to derive from installing the experimental UV–A headlamps in the cars of 100 volunteers was to enable the team to refine the engineering estimates. The possible measures of a headlamp’s continuing effectiveness included power output (over the relevant part of the spectrum), energy efficiency, and physical integrity. TASK 4.3: DETERMINE FLUORESCENT TCD DETERIORATION RATE AND ITS FACTORSThe goal of task 4.3 was to determine the rate at which fluorescent TCDs deteriorate over time and the factors that influence that rate. It would have been necessary to estimate the service life of each type of fluorescent TCD in order to estimate the frequency with which it would need replacing, and hence, to compute its unit life cycle cost. This task was to use data from task 2 of activity 2. The research team was to place the TCDs in a variety of locations to expose them to as many natural and artificial fluorescence-deteriorating factors as possible; it was hoped that this would produce numerous independent (i.e., uncorrelated) variations. Following is a list of factors that might have influenced the rate of deterioration (or frequency of failure):
The useful life of a TCD may be modeled either as a steady, more or less predictable deterioration in its effectiveness or as the cumulative probability of its failure in a given time. The continuing effectiveness of a TCD would be indicated by one or more of the following measures:
Fluorescent TCDs were to undergo field tests, first in controlled conditions on the Smart Road (as described in activity 2) in Blacksburg, VA, and later on selected segments of public roads in Albemarle and Montgomery Counties, VA. The rate of deterioration (or the frequency of failure) was to be monitored for the duration of the study. TASK 4.4: DETERMINE FLUORESCENT AND CONVENTIONAL TCD UNIT COSTSTask 4.4 was to determine material and installation unit costs associated with the fluorescent and comparable conventional TCDs. The unit costs associated with each type of TCD were to be determined in task 3 of activity 2. In addition, the research team envisioned that much of this information would be readily available from the material suppliers or the manufacturers. The costs were to be disaggregated by type of TCD (i.e., pavement marking, delineator, and sign) and whether it was a conventional device or a fluorescent device. The cost for the material itself was to be obtained along with the total cost (material plus installation). The unit costs associated with the fluorescent devices were to be scrutinized to ensure that what was used in a subsequent economic analysis would be representative of what VDOT or another state department of transportation would encounter if this particular device were procured for statewide deployment. This scrutiny was to ensure that the fluorescent TCD costs were being evaluated similarly to those of the more readily available conventional devices. TASK 4.5: DETERMINE UV–A HEADLAMP AND FLUORESCEN TCD EFFECT ON ACCIDENT COSTSTask 4.5 was to determine the effect that UV-A headlamps in a given percentage of the motor vehicle fleet would have on accident costs, the effect of fluorescent TCDs on accident costs for a given percentage of the State's centerline miles, and any additional effect of an interaction of UV-A headlamps and fluorescent TCDs on accident costs. This task would depend on the findings of the driver/pedestrian team and published research on accident costs. The findings were to be largely a synthesis of the team's original research (concerning the driver's perception of and response to fluorescent TCDs and other fluorescent objects such as pedestrians' clothing) with published research concerning the cost and probability of accidents. The expected costs associated with accidents can be broken into two components: the expected cost per accident of each type and the expected number of accidents per million vehicle miles traveled (VMT). Points of comparison between the results of the studies, envisioned as part of this project, and the extant literature relating accident rates to characteristics of the vehicle, the roadway, the driver, and the weather were to form the basis for estimating the effect of UV–A headlamps and fluorescent TCDs on the expected number of accidents, all other things being equal. TASK 4.6: DETERMINE EFFECT OF UV–A HEADLAMPS AND FLUORESCENT TCDS ON OTHER ROAD USER COSTS AND POLLUTION EMISSIONSThe goal of task 4.6 was to determine the effect on other road user costs and on pollution emissions of UV–A headlamps in a given percentage of the motor vehicle fleet and fluorescent TCDs on a given percentage of the State's centerline miles. In addition to an effect on safety, the UV–A and fluorescent technology conceivably may alleviate or aggravate certain other costs borne either by the motorist or by third parties including the following possibilities:
TASK 4.7: DETERMINE ENHANCED VISIBILITY PROVIDEDBY UV–A HEADLAMPSTask 4.7 was to determine the degree of enhanced visibility of TCDs and pedestrians illuminated by UV–A headlamps for various ambient lighting conditions. The proposed approach began by specifying the UV–A system parameters of interest. This task likely would be performed by the driver/pedestrian team in conjunction with the vehicle and infrastructure teams. A decision was to be made regarding whether to test available systems that were not necessarily optimal (e.g., a system that required more power than a car manufacturer might deem acceptable) or to specify systems that would require prototyping. It was anticipated that six headlamp configurations would be tested. The ambient visibility conditions of interest were in snow, rain, fog, and clear night. To determine the distance at which drivers can detect the TCDs, drivers were to drive an instrumented vehicle on the Smart Road and inform the experimenter when the TCDs were detectable and recognizable. The experiment was to consist of two segments: one to evaluate the visibility of pavement markings and marking posts and a second to determine the visibility of pedestrians. Evaluation of the Visibility of TCDsExperimental DesignThe experiment was to use a 2 (Age: young, old) by 3 (Visibility Condition: between subjects; clear, rain, fog) by 6 (Headlamp Type: within subject) by 4 (TCDs: within subject) mixed-factor design. The snow visibility condition was excluded because snow would have covered the TCDs. The dependent variables were to be the participant's detection of the end of pavement markings and the visibility distance of marking posts. The drivers (60 divided into 30 younger and 30 older) were to be recruited from Blacksburg, VA, and the surrounding communities. All drivers were to possess a current, valid Virginia State driver's license. In addition, they were to have successfully completed a health screening questionnaire. Visual tests for acuity, contrast sensitivity, and color vision were to be administered. Drivers were to be paid for their participation. ApparatusThis study was to use instrumented vehicles outfitted with halogen, HID, and UV–A headlamps. The beam configuration for the UV–A headlamps was to have an elliptical shape. At 90 percent of maximum intensity, the beam was to be aimed approximately 0.5° vertically (V) and 2° horizontally (H). At 50 percent, the beam configuration was to be approximately 1.5° V and 4°H. At 10 percent, the beam shape was to be approximately 4° V and 10° H. The aim was to be straight forward vertically and horizontally. In addition, in-vehicle instrumentation to collect distance traveled was to be installed. The pavement marking types to be tested were conventional tape, florescent paint with fluorescent glass beads, and fluorescent thermoplastic with fluorescent glass beads. The location of the pavement markings as applied to the Smart Road is shown in figure 3. Along the solid edgeline, reflective tags (similar to raised pavement markers) were to be placed every 5 m (16 ft) to determine the distance viewed down the edgeline. Marking posts were to be located both inside and outside the all-weather test section of the facility. 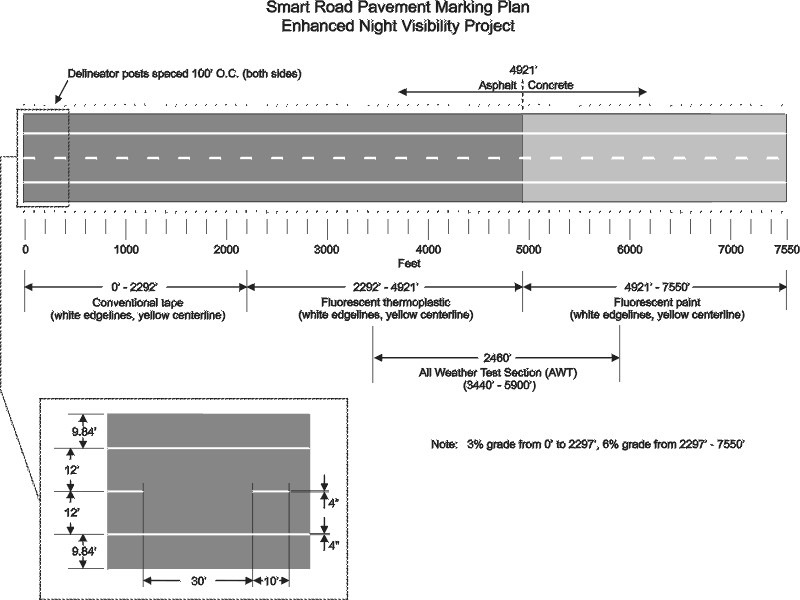 Figure 3. Diagram. Smart Road pavement marking plan.
ProcedureDrivers were to be met at the VTCTR to read and sign an informed consent form, complete a brief vision and hearing exam, and read an introduction to the study. Afterward, drivers were to be taken to the Smart Road test facility. To ensure that participants had the same viewing perspective as they would when driving, the participants were to sit in the driver's seat and operate the vehicle. The experimenter was to sit in the front passenger seat and record the participants' comments, tell participants where to drive for each test, and flag the datastream to indicate when participants had detected the end of the pavement marking. In the sections with marking posts, participants were to report the number of marking posts they could detect. Visibility in the rain condition was to be tested in the all-weather portion of the Smart Road. This procedure was to be followed for each of the weather conditions. For those locations at which marking posts were to be installed, the number of marking posts detectable by the participants was to be determined. The rain visibility condition was to be tested in the all-weather portion of the Smart Road. This procedure was to be followed for each of the weather conditions. Evaluation of Pedestrian and Object VisibilityExperimental DesignThe experiment was to use a 2 (Age: young, old) by 4 (Visibility Condition: clear, rain, fog, and snow) by 6 (Headlamp Type) mixed-factor design. The dependent variable was to be the distance at which mock pedestrians can be detected. Drivers (24 divided into 12 younger and 12 older) were to be recruited from Blacksburg, VA, and the surrounding communities. These participants likely would have been the same as those in the previously defined experiment. All drivers were to possess a current, valid Virginia State driver's license. In addition, they were to successfully complete a health screening questionnaire. Visual tests for acuity, contrast sensitivity, and color vision were to be administered. Drivers were to be paid for their participation. ApparatusThis study was to use instrumented vehicles outfitted with halogen, HID, and UV–A headlamps. The beam configuration for the UV–A headlamps was to be an elliptical shape. At 90 percent of maximum intensity, the beam was to be approximately 0.5° V and 2° H. At 50 percent, the beam configuration was to be approximately 1.5° V and 4° H. At 10 percent, the beam shape was to be approximately 4° V and 10° H. The aim was to be straight forward both vertically and horizontally. In addition, in-vehicle instrumentation to collect distance traveled was to be installed along with an incident button to flag the datastream. The following mockups were to be installed on the Smart Road test facility:
One possible dynamic object was a barrel sent into the roadway down a ramp on the side of the road. The pedestrians were to be dressed with light and dark machine-laundered clothing (i.e., clothing with varying levels of fluorescent properties). The mockups were to be placed both within and outside of the all-weather testing area. ProcedureDrivers were to be met at the VTCTR to read and sign an informed consent form, complete a brief vision and hearing exam, and read an introduction to the study. Afterward, participants were to be taken to the Smart Road test facility. To make this experiment as realistic as possible, the participants were to drive the vehicle and maintain a speed of 16 km/h (10 mi/h) while scanning the roadway for potential hazards. Participants also were to state when they noticed anything out of the ordinary in the roadway scene (detected an object). Then, after detecting an object, they were to tell the experimenter when they could recognize the object. The experimenter, sitting in the front passenger seat, was to flag the datastream when the participant announced detection and recognition of the object. Two pedestrian mockups were to be tested using halogen headlamps, two were to be tested with HID headlamps, and two were to be tested with UV–A headlamps. This procedure was to be followed for each of the weather conditions. TASK 4.8: EVALUATE POTENTIAL FOR DRIVER OVERCONFIDENCE WHEN USING UV–A HEADLAMPSPast research has shown that the highest potential payoff of the UV-A and fluorescent technology is in areas where there is little roadside artificial light such as in rural areas. Other research has shown that fluorescent traffic control devices provide added visibility in fog, smoke, dusk, dawn, or wet conditions. On the other hand, pavement markings that greatly enhance the distance at which drivers can see the roadway in front of them may lead to increased driving speeds. For example, it has been suggested that on Interstate 64 (I–64) across Afton Mountain in Virginia, drivers' speed increased after embedded pavement lights were installed to increase visibility in this heavy fog area. The purpose of this task was to evaluate the effects of UV-A and fluorescent technology on long-term driving behavior. This was to be accomplished by installing instrumentation in privately owned vehicles to determine vehicle position (i.e., global positioning system or GPS), speed, and visibility condition. The GPS was to be used to indicate when the vehicle was traveling on a designated section of the roadway, which would trigger recording of vehicle speed and visibility condition during this time. This information was to be used to determine effects on long-term driving behavior. Experimental DesignThe experiment was to use a 3 (Age) by 2 (UV–A) design. The driving behavior of three participant age groups—younger (18 to 25 years old), middle-aged (35 to 45), and older (60 and over)—was to be measured in driving situations with and without the use of UV–A headlamps. Both genders were to be equally represented. Visibility conditions including rain, fog, and time of day were to be analyzed later. In addition, data on road type including interstate roadways, primary roads, secondary roads, and rural roads were to be analyzed later. It was anticipated that 60 drivers as described above would be recruited for this study. Drivers were to be selected based on their frequency of driving the designated routes; that is, drivers who used the designated highways as part of their daily commute would have been preferable because such participants would have contributed more data to the study. All drivers were to hold a valid driver's license and pass a vision and hearing screening test. Recruiting was to have been through local newspaper advertisements and posted fliers. Drivers were to be paid for participation in the study. The study was to be implemented in the rural areas of Montgomery and Albemarle Counties, VA. The study was to begin 5 months before fluorescent TCDs were installed to provide baseline data and was to continue for 5 months after the fluorescent TCD installation. ApparatusDrivers were to use one of four specially instrumented vehicles (or instrumentation packages in their own vehicles) for a period of up to 2 weeks each. To make the instrumentation of 12 vehicles feasible, only those subsystems required to answer the questions in the experiment were to be installed. Instrumentation was to include a GPS device, speed recording hardware, accelerometers, brake-activation recording hardware, and a video camera to record visibility outside the windshield. Data recording was to occur only when data from the GPS indicated that the driver was traveling on designated roadways, that is, roadways with installed fluorescent TCDs. Data recording was to occur at a rate of 1 Hertz (Hz). The resolution was set low to allow data collection for several weeks before downloading became necessary. TASK 4.9: ESTIMATE DEGREE OF CRASH REDUCTIONIt was considered important to collect objective performance data to determine the safety benefits of UV–A-equipped vehicles. The collection of objective performance data would have required an innovative approach. The fundamental concept was to use trigger criteria to determine the onset of critical incidents and accidents that occur while driving instrumented vehicles. With proper instrumentation, including video, the research team's experience had shown that it was possible to detect the occurrence of up to 90 percent of incidents for subsequent recording. This instrumentation could be installed in personal vehicles in addition to research vehicles. After a trigger had been exceeded, the driver performance measures surrounding the occurrence of a critical incident would be saved for future analysis. Through analysis of these data, it was anticipated that critical incidents related to issues of visibility both with and without UV–A headlamps could be used to estimate safety benefits. The four systems to be used in task 4.8 were also to be used to collect critical incident data for analysis. Experimental DesignThe experiment was to use a 2 (Gender) by 2 (Location) by 3 (Age) full-factor between-subjects design. Five participants were to be recruited for each gender and age group for a total of 60 drivers. Note that these 60 drivers were to be the same drivers as described in task 4.8. Of the drivers selected, 30 were to be selected from the rural areas surrounding Blacksburg, VA, and 30 were to be selected from the urban areas of northern Virginia. Drivers were to represent younger (18 to 25 years), middle-aged (35 to 45 years), and older (60 years and older) driving populations, and both genders were to be represented. All drivers were to hold a valid driver's license and pass a vision and hearing screening test. Recruiting was to have been through local newspaper advertisements and posted fliers. Drivers were to be paid for participation in the study. ApparatusThe hardware systems available for this research were previously described in task 4.8. The video and data collection systems were to save event-triggered data. The video image was to pass through a computer-controlled video titler to stamp a frame number on the video for synchronization with an electronic data file. This multiplexed video signal was then to be passed to a bank of video cassette recorders that would record data at 1 Hz. Each time an event was detected by the data collection system, the electronic data and real-time video would mark the event on the videotape. In addition to the video data, a variety of driver performance measures were to be collected. A power inverter was to be used to supply the data collection equipment with power from the car battery. The total system would require less than 150 W of power and was not to draw enough current to damage or drain the batteries, even if the vehicle was shut off. No additional power sources (e.g., generators) were to be required as part of the data collection hardware. The entire data collection system fit into a unit the size of a briefcase. All of the sensor mountings to the vehicles were temporary, resulting in no damage to the vehicle. The camera was to be mounted in a duplicate rearview mirror purchased for the experiment, which was to be replaced with the original mirror after the study was completed. ProcedureBy using the selection criteria described earlier whenever possible, it was anticipated that a minimum of 48,280 km (about 30,000 mi) of data could be collected. Based on previous experiences, this amount of data was expected to result in roughly 500 to 1,000 critical incidents for analysis. After the data were collected, the driver error and critical incident data could be analyzed to help determine the relative safety of UV–A and fluorescent technology. The researchers considered accomplishing this by comparing a baseline condition of no UV–A headlamps or fluorescent TCDs to the experimental condition with these technologies. The study was to be implemented in Montgomery and Albemarle Counties, VA. The study was to begin 5 months before fluorescent TCDs were installed to provide baseline data and was to continue for 5 months after the fluorescent TCD installation.
|

