U.S. Department of Transportation
Federal Highway Administration
1200 New Jersey Avenue, SE
Washington, DC 20590
202-366-4000
Federal Highway Administration Research and Technology
Coordinating, Developing, and Delivering Highway Transportation Innovations
 |
| This report is an archived publication and may contain dated technical, contact, and link information |
|
Publication Number: FHWA-HRT-04-135
Date: December 2005 |
|||||||||||||||||||||||||||||||||||||||||||||||||||||||||||||||||||||||||||||||||||||||||||||||||||||||||||||||||||||||||||||||||||||||||||||||||||||||||||||||||||||||||||||||||||||||||||||||||||||||||||||||||||||||||||||||
Enhanced Night Visibility, Volume IV: Phase II—Study 2: Visual Performance During Nighttime Driving in RainPDF Version (1.61 MB)
PDF files can be viewed with the Acrobat® Reader® CHAPTER 2—METHODSPARTICIPANTSThirty individuals participated in this study. Participants were divided into three age categories: 10 drivers were between the ages of 18 and 25 (younger category), 10 were between the ages of 40 and 50 (middle-aged category), and 10 were over 65 (older category). Each category had five males and five females. Selected participants had to meet the conditions of a screening questionnaire (appendix A). Participants also had to sign an informed consent form (appendix B), present a valid driver’s license, pass the visual acuity test (appendix C) with a score of 20/40 or better (as required by Virginia State law), and have no health conditions that made operating the research vehicles a risk. Participants were instructed about their right to withdraw freely from the research program at any time without penalty, and they were told that no one would try to make them participate if they did not want to continue. If they chose at any time not to participate further, they were instructed that they would be paid for the amount of actual participation time. Participants received 20 dollars per hour for their participation. All data gathered as part of this experiment were treated with complete anonymity. EXPERIMENTAL DESIGNA mixed-factor design was used to collect data during the onroad portion of the study (i.e., detection and recognition tasks, table 1 and table 2). There were three independent variables:
The between-subjects variable of the experiment was age. The within-subject variables were VES configuration and type of object. Table 1 and table 2 show a representation of the experimental design; a detailed explanation of each of the independent variables of interest is presented afterward.
INDEPENDENT VARIABLESAgeThe age factor had three levels: younger participants (18 to 25), middle-aged participants (40 to 50), and older participants (65 or older). These age groups were created based on literature review findings (refer to ENV Volume II) that suggest changes in vision during certain ages. (See references 1, 2, 3, 4, and 5.) Each age group comprised five males and five females. Gender was used as a control but not as a factor of interest. VESThe VES configurations were defined as follows:
In-depth technical specifications of each headlamp appear in ENV Volume XVII, Characterization of Experimental Vision Enhancement Systems. The presentation orders for each VES and object combination were counterbalanced. Table 3 provides an example of the VES configuration order for a pair of participants. The first column, labeled “Order,” indicates the order in which the VESs were presented. The second column, labeled “VES,” presents the VES configuration that was used. The third column, labeled “Vehicle,” presents the vehicle upon which the headlamps were mounted, either a sedan, pickup truck, white sports utility vehicle (SUV), or black SUV.
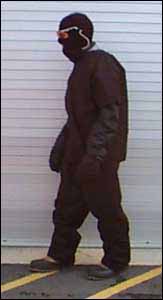
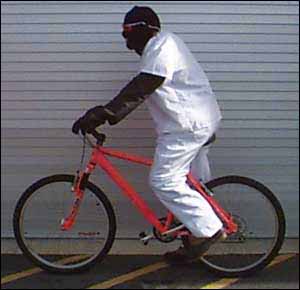
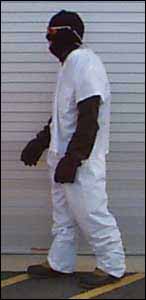
The 12 VES configurations tested were selected based on several considerations. The HLB and the HID headlamps currently are available on the market and reflect the most commonly used headlamps (HLB) and a growing section of the market (HID); therefore, they were added as two of the configurations to allow the comparison of new VES alternatives with what is readily available. There also was some concern about possible changes in the detection and recognition distances resulting from the use of high-profile headlamps (e.g., halogens on an SUV) versus lower profile headlamps (e.g., halogens on a sedan). This is important to consider, given the growing number of higher profile vehicles on the Nation’s roadways; therefore, halogen headlamps were included as VES configurations at a low profile (i.e., HLB–LP) and a high profile (i.e., HLB) on a sedan and SUV, respectively. All of the UV–A headlamps had to be paired with HLB and HID headlamps because UV–A headlamps provide minimal visible light. These UV–A headlamps stimulate the fluorescent properties of objects irradiated by the UV radiation, producing visible light. Their purpose is to supplement, not eliminate, the regular headlamps. These UV–A and HLB/HID pairings resulted in six different VES configurations: three in which the pairing was made with HLB lamps and three in which HID lamps were used. The three different UV–A conditions inside each pairing category resulted from the use of three different forms of UV–A headlamp configurations: five UV–A lamps, three UV–A lamps, or hybrid UV–A headlamps. The hybrid UV–A headlamp is an experimental prototype that produces a significant amount of visible light, although not enough light to allow driving without standard headlamps. The UV–A headlamps used in the five UV–A and three UV–A configurations produce far less visible light. The HHB configuration was included to compare detection and recognition distances of the VESs of interest in this study with those of commonly available halogen high-beam headlamps. In addition, a new alternative to the standard halogen low-beams, which is intended to provide drivers with more visible light output (HOH), was considered. The IR–TIS was included because of its ability to present the driver with images of the environment based on the temperature differential of objects. This approach has the potential to allow very early detection of pedestrians, cyclists, and animals (i.e., objects generating heat) as well as roadway infrastructure objects that shed heat (e.g., guardrails, light posts). ObjectThe seven different objects selected for this study included pedestrians, cyclists, and static objects (table 4 and figure 1 through figure 5). The main reason for including the pedestrians and cyclists was because of the high crash-fatality rates for these nonmotorists.(6,7) This study used actual pedestrians and cyclists to evaluate the effects of object motion on detection and recognition distances, although pedestrian mockups have been used in previous research of this type.(8) In this study, using mockups would have improperly restricted the performance capabilities of the IR–TIS and would have limited the external validity of the study.
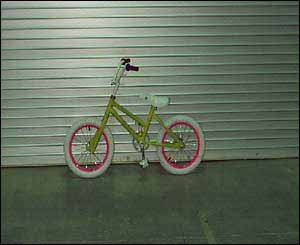
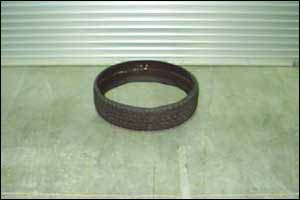
Pedestrians and cyclists were presented to the drivers at two different contrast levels: (1) black clothing against a rainy night background and (2) white clothing against a rainy night background. The dynamic pedestrians walked in two different directions: (1) perpendicular to the vehicle path, representing a pedestrian crossing the road, and (2) parallel to the vehicle path, representing a pedestrian walking along the shoulder. Two objects other than pedestrians or cyclists also were used: a child’s 25-cm (10-inch) bicycle and a tire tread from a 71- by 23-cm (28- by 9-inch) steel-belted truck radial tire. The tire tread was selected because of its potential for very low detection distances, which often lead to last-moment object-avoidance maneuvers. The child’s bicycle was intended to represent the possible presence of a child in the area. The seven objects of interest are described in table 4. Detailed information about the characterization of the different objects appears in ENV Volume IX.
OBJECTIVE DEPENDENT VARIABLESDetection and recognition distances were obtained to analyze the degree to which the different VES configurations enhanced nighttime visibility while driving. These two variables were selected for their common use and acceptance in the human factors transportation literature. (See references 9, 10, 11, 12, and 13.) Both terms, detection and recognition, were explained to the participants during the training session. Detection was explained as follows: “Detection is when you can just tell that something is on the road in front of you. You cannot tell what the object is, but you know something is there.” Recognition was explained as follows: “Recognition is when you not only know something is there, but you also know what it is.” During training and practice, each participant was instructed on the use of a hand-held wand used to mark the moments when he or she detected and recognized objects. The participant was instructed to press a button on the wand when he or she detected an object on the road, then perform a second button press when he or she recognized the object. The in-vehicle experimenter flagged the data collection the moment the participant drove past the object. Detection and recognition distances were calculated from distance data collected at these three points in time. SUBJECTIVE RATINGSSubjective ratings also were collected as dependent variables. Each participant was asked to evaluate each VES on seven statements using a seven-point Likert-type scale. The two anchor points of the scale were “1” (indicating “Strongly Agree”) and “7” (indicating “Strongly Disagree”). The statements addressed each participant’s perception of improved vision, safety, and comfort after experiencing a particular VES. The participant was asked to compare each experimental VES to his or her regular headlamps (i.e., the headlamps on the participant’s own vehicle). Researchers assumed that the participant’s own vehicle represented what he or she knew best, and therefore, was most comfortable using. The statements on the questionnaire follow. Note that while the word “headlamp” is used throughout the ENV series, the subjective questions posed to the participants used the synonymous word “headlight,” as reflected below.
SAFETY PROCEDURESSafety procedures were implemented as part of the experiment. These procedures were used to minimize possible risks to participants during the experiment. The safety measures required that:
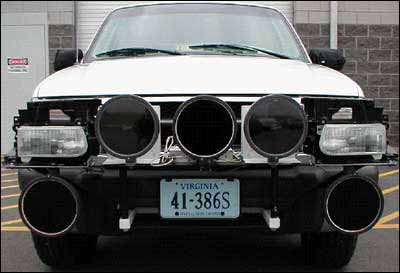
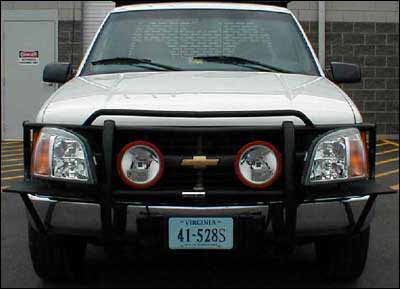
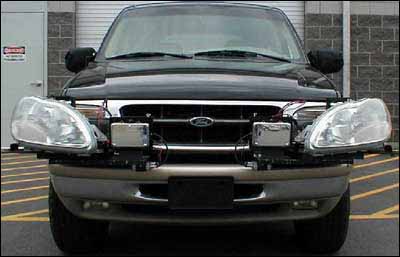
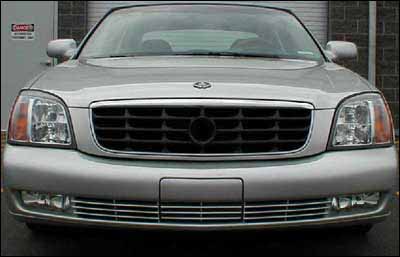
The onroad pedestrians and cyclists were trained when to clear the road, based on a preset safety-envelope mark. In addition, they were provided with radios in case the in-vehicle experimenter needed to communicate with them. APPARATUS AND MATERIALSAll vehicles were equipped with an electronic distance-measuring instrument. The measuring device was connected to a laptop computer that was equipped with software specifically developed for this study. The software allowed the experimenter to mark locations and record whether the trial was successful (figure 6). Only the driver portion of the software was used. The software gathers information such as the participant’s age and gender, as well as the identification number assigned to that participant. In addition, the software shows the object order presented to the participant during a given VES configuration. Onroad driving was conducted using four vehicles: two SUVs, a pickup truck, and a luxury passenger vehicle (figure 7 through figure 10). Figure 6. Diagram. Data collection display screen. The VESs were distributed among the different vehicles. The two SUVs and the pickup truck had light bars installed that allowed the headlamps (i.e., HLB and HID) to be switched to maintain a more consistent horizontal and vertical position among the different VESs (figure 7 through figure 10). The HLB–LP and IR–TIS were the only exceptions; these were factory-installed on the sedan.
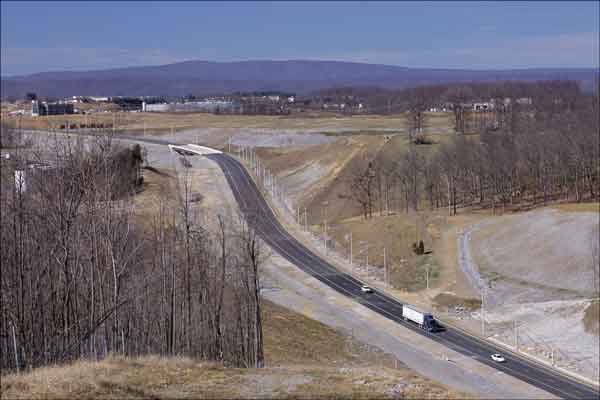
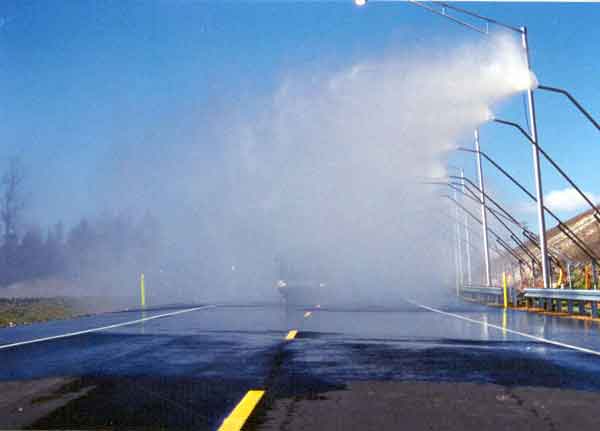
Smart RoadThe all-weather testing facility on the Smart Road (overhead lighting turned off) was used in this study (figure 11, figure 12, and appendix G). The different objects were presented at four locations on the Smart Road (figure 13). The participants changed vehicles on the turnaround next to the entrance of the Smart Road. One onroad experimenter was assigned to each participant; this experimenter was responsible for escorting the participant to the next vehicle, showing him or her where the controls were, and verifying that the right VES configuration was being tested. Four other onroad experimenters were positioned at the various locations. Two onroad experimenters were assigned to locations 1 and 5, and two additional experimenters were assigned to locations 2 and 4. Appendix I contains additional details on the protocol for the onroad experimenters. A total of six onroad and two in-vehicle experimenters were part of the study each night. Figure 11. Photo. Smart Road. The all-weather testing facility on the Virginia Smart Road generated the rain (figure 12). This ensured a constant amount of precipitation throughout the data collection effort. Data were not collected during heavy wind conditions. The precipitation rate selected was 10.2 cm/h (4 inches/h), which required most of the participants to use the vehicles’ windshield wipers at a high speed. Figure 12. Photo. Smart Road rain towers.
Figure 13. Diagram. Locations where the objects were presented for the adverse weather condition (note the area where rain was generated). Headlamp AimingThe headlamps used for the HLB, HID, HOH, HHB, and UV–A configurations were located on external light bars. To change from one configuration to another, the HLB and HID headlamps were moved onto, off of, and between vehicles. Each light assembly movement required a re-aiming process, which took place before starting the experimental session each night. At the beginning of the Phase II studies, a headlamp aimer was not available to the contractor, so an aiming protocol was developed with the help of experts in the field. (See references 14, 15, 16, and 17.) The details of the aiming protocol used for this specific study are described in appendix J. During the photometric characterization of the headlamps, it was discovered that the position of the maximum intensity location of the HLB, HOH, and HHB configurations was aimed higher and more toward the left than typical. This aiming deviation likely increased detection and recognition distances for the HLB and HOH configurations and likely decreased them for the HHB configuration. Details about the aiming procedure and the maximum intensity location are discussed in ENV Volume XVII, Characterization of Experimental Vision Enhancement Systems. EXPERIMENTAL PROCEDURETwo participants performed the experiment simultaneously. The experiment consisted of three sessions, and each experimental session lasted approximately 3.5 h. The first session included screening, laboratory training, and IR–TIS training. The other two sessions involved two nights of the experiment on the Smart Road. During the first onroad session, participants were familiarized with the Smart Road and the experimental objects before starting the experiment. Six VES configurations were presented to the participants during the first onroad session, and the remaining six configurations were presented during the second session. The order was counterbalanced. The following paragraphs discuss the procedure details. Participant ScreeningInitially, candidates were screened over the telephone (appendix A). If a candidate qualified for the study, a time was scheduled for testing. Each candidate was instructed to meet the experimenter at the contractor facility. After arriving, the candidate received an overview of the study. Then the candidate was asked to complete the informed consent form (appendix B) and take an informal vision test for acuity using a Snellen chart, a contrast sensitivity test, and a color vision test (appendix C). The vision tests were performed to ensure that all participants had at least 20/40 vision and identify any type of vision disparity that might have influenced the results. A detailed experimenter protocol for vision testing appears in appendix D. If no problems were identified, the participant was trained on the experimental tasks to be performed during the drive. TrainingEach participant was taught how to perform the tasks associated with object detection and recognition and told how the questionnaires would be used. The study protocol and pictures of the objects were presented at this point (appendixes D and E). Each participant also was familiarized with the detection and recognition definitions, use of the pushbutton wand, and Likert-type scales for the questionnaire. The training presentation outlined the procedures, showed pictures of the objects, and allowed for questions. The purpose of this lab training and practice was to allow all participants to begin the experiment with a standard knowledge base. After the lab training, the participant practiced with the IR–TIS, and examples of the experimental objects were presented as part of the training practice. FamiliarizationBecause participants changed vehicles as part of the study, the familiarization process occurred as soon as the participant reached each experimental vehicle. While the vehicle was parked, the onroad experimenter reviewed general information concerning the vehicle’s operation (appendix K). The participant was asked to adjust the seat and steering wheel position for his or her driving comfort. When the participant felt comfortable with the controls of the vehicle, the experiment was ready to begin. Driving InstructionsParticipants were instructed to place the vehicle in park upon reaching each of the turnarounds while the onroad objects were changed. Participants were instructed to drive at 16 km/h (10 mi/h) during the experimental sessions and to follow instructions from the in-vehicle experimenter at all times. Driving and Practice LapThe participant drove down the road to become familiar with the road and the vehicle; no objects were presented at this point. At the bottom turnaround, the experimenter gave the pushbutton wand to the participant and told him or her that this portion of the session was a practice to familiarize him or her with the objects. The participant then drove back up the road for a practice run of detection and recognition tasks, obtaining feedback from the experimenter as needed. After the practice tasks, the participant began the experimental tasks, driving with the first group of six VESs in the order assigned to the first night. General Onroad ProcedureDistance data were collected while the participant drove with each VES. The in-vehicle experimenter provided the participant with a pushbutton wand to flag the data collection program when detection and recognition were performed. Other than detection, recognition, and maintaining 16 km/h (10 mi/h), the participant performed no other tasks while driving. The experimenter sat in the passenger seat and told the participant when he or she could begin driving and where to park. The in-vehicle experimenter also administered the subjective questionnaires after each VES configuration and controlled the data collection program. Additional details on the in-vehicle experimenter protocol appear in appendix F. Sequence of Data CollectionEvery participant followed the same sequence of events when collecting the data for each of the VES configurations. This sequence was as follows:
The study was performed twice every night (first shift: 7:45 p.m. to 11 p.m.; second shift: 11:30 p.m. to 2:30 a.m.). Participants who usually worked and drove late at night ran in the second shift to minimize the possibility of fatigue. Other participants drove during the first shift. Participants were paid for the total number of hours (training and both experimental sessions) at the end of the second experimental session. DATA ANALYSISData for this research were contained in one data file per VES configuration per participant. All the data collected for the 30 participants were merged into a single database that included objective and subjective data. An analysis of variance (ANOVA) was performed to evaluate drivers’ visual performance under each of the different treatments. PROC ANOVA was used in SAS® statistical software to compute the ANOVA. The full experimental design model was used in the data analysis (table 5).
The ANOVA evaluated whether there were significant differences among the different VESs in terms of the dependent variables. The main effects that characterized this study were VES configuration (VES), driver’s age (Age), and type of object (Object). A Bonferroni post hoc analysis was performed for the significant main effects (p < 0.05). For the significant interactions, the means and standard errors were graphed and discussed. Post hoc analyses assisted in the identification of experimental levels that were responsible for the statistical significance of the main effects. Note that the significance of a main effect or interaction does not make all interior levels significantly different. For a detailed discussion of post hoc tests, see Winer, Brown, and Michels.(18)
|